Instrument a .NET Application with OpenTelemetry
20 minutesDownload the Splunk Distribution of OpenTelemetry
For this workshop, we’ll install the Splunk Distribution of OpenTelemetry manually rather than using the NuGet packages.
We’ll start by downloading the latest splunk-otel-dotnet-install.sh file,
which we’ll use to instrument our .NET application:
cd ~/workshop/docker-k8s-otel/helloworld

curl -sSfL https://github.com/signalfx/splunk-otel-dotnet/releases/latest/download/splunk-otel-dotnet-install.sh -O
Refer to Install the Splunk Distribution of OpenTelemetry .NET manually for further details on the installation process.
Install the Distribution
In the terminal, install the distribution as follows
sh ./splunk-otel-dotnet-install.shDownloading v1.8.0 for linux-glibc (/tmp/tmp.m3tSdtbmge/splunk-opentelemetry-dotnet-linux-glibc-x64.zip)...Note: we may need to include the ARCHITECTURE environment when running the command above:
ARCHITECTURE=x64 sh ./splunk-otel-dotnet-install.sh
Activate the Instrumentation
Next, we can activate the OpenTelemetry instrumentation:
. $HOME/.splunk-otel-dotnet/instrument.shSet the Deployment Environment
Let’s set the deployment environment, to ensure our data flows into its own environment within Splunk Observability Cloud:
export OTEL_RESOURCE_ATTRIBUTES=deployment.environment=otel-$INSTANCERun the Application with Instrumentation
We can run the application as follows:
dotnet runA Challenge For You
How can we see what traces are being exported by the .NET application from our Linux instance?
Click here to see the answer
There are two ways we can do this:
- We could add
OTEL_TRACES_EXPORTER=otlp,consoleat the start of thedotnet runcommand, which ensures that traces are both written to collector via OTLP as well as the console.
OTEL_TRACES_EXPORTER=otlp,console dotnet run - Alternatively, we could add the debug exporter to the collector configuration, and add it to the traces pipeline, which ensures the traces are written to the collector logs.
exporters:
  debug:
    verbosity: detailed
service:
  pipelines:
    traces:
      receivers: [jaeger, otlp, zipkin]
      processors:
      - memory_limiter
      - batch
      - resourcedetection
      exporters: [otlphttp, signalfx, debug]
Access the Application
Once the application is running, use a second SSH terminal and access it using curl:
curl http://localhost:8080/helloAs before, it should return Hello, World!.
If you enabled trace logging, you should see a trace written the console or collector logs such as the following:
info: Program[0]
/hello endpoint invoked anonymously
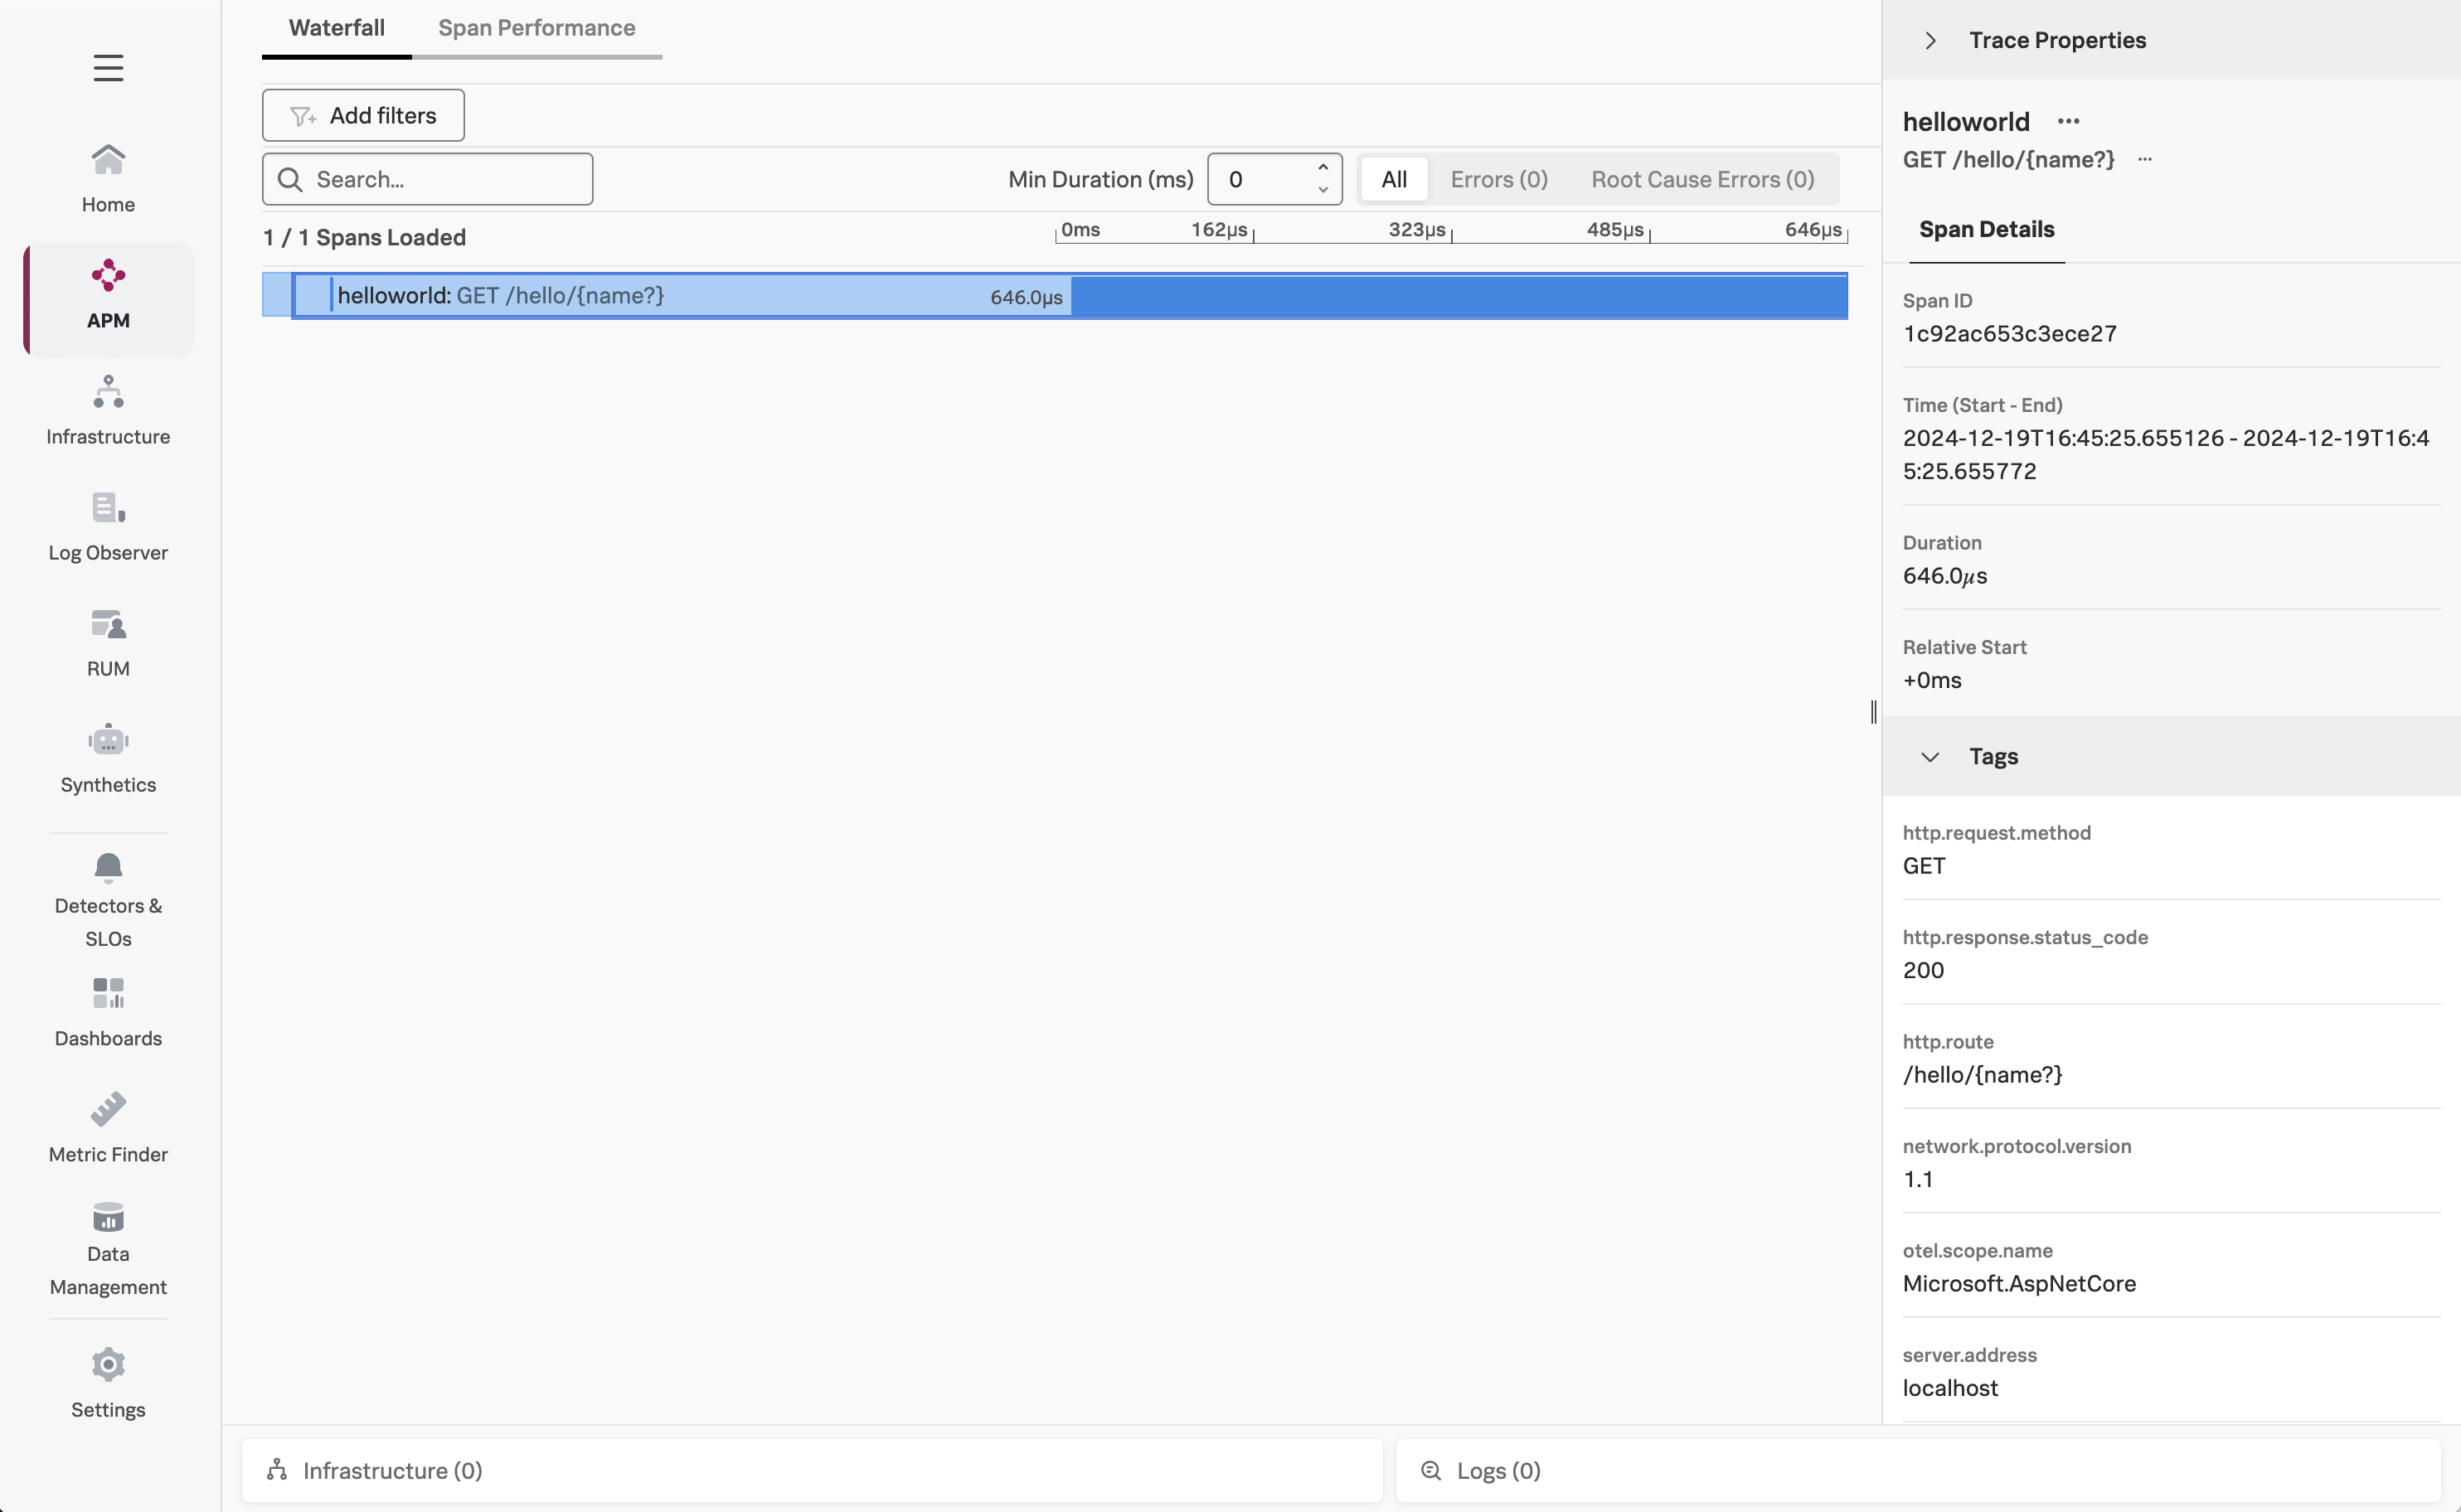
Activity.TraceId: c7bbf57314e4856447508cd8addd49b0
Activity.SpanId: 1c92ac653c3ece27
Activity.TraceFlags: Recorded
Activity.ActivitySourceName: Microsoft.AspNetCore
Activity.DisplayName: GET /hello/{name?}
Activity.Kind: Server
Activity.StartTime: 2024-12-20T00:45:25.6551267Z
Activity.Duration: 00:00:00.0006464
Activity.Tags:
server.address: localhost
server.port: 8080
http.request.method: GET
url.scheme: http
url.path: /hello
network.protocol.version: 1.1
user_agent.original: curl/7.81.0
http.route: /hello/{name?}
http.response.status_code: 200
Resource associated with Activity:
splunk.distro.version: 1.8.0
telemetry.distro.name: splunk-otel-dotnet
telemetry.distro.version: 1.8.0
service.name: helloworld
os.type: linux
os.description: Ubuntu 22.04.5 LTS
os.build_id: 6.8.0-1021-aws
os.name: Ubuntu
os.version: 22.04
host.name: derek-1
host.id: 20cf15fcc7054b468647b73b8f87c556
process.owner: splunk
process.pid: 16997
process.runtime.description: .NET 8.0.11
process.runtime.name: .NET
process.runtime.version: 8.0.11
container.id: 2
telemetry.sdk.name: opentelemetry
telemetry.sdk.language: dotnet
telemetry.sdk.version: 1.9.0
deployment.environment: otel-derek-1View your application in Splunk Observability Cloud
Now that the setup is complete, let’s confirm that traces are sent to Splunk Observability Cloud. Note that when the application is deployed for the first time, it may take a few minutes for the data to appear.
Navigate to APM, then use the Environment dropdown to select your environment (i.e. otel-instancename).
If everything was deployed correctly, you should see helloworld displayed in the list of services:
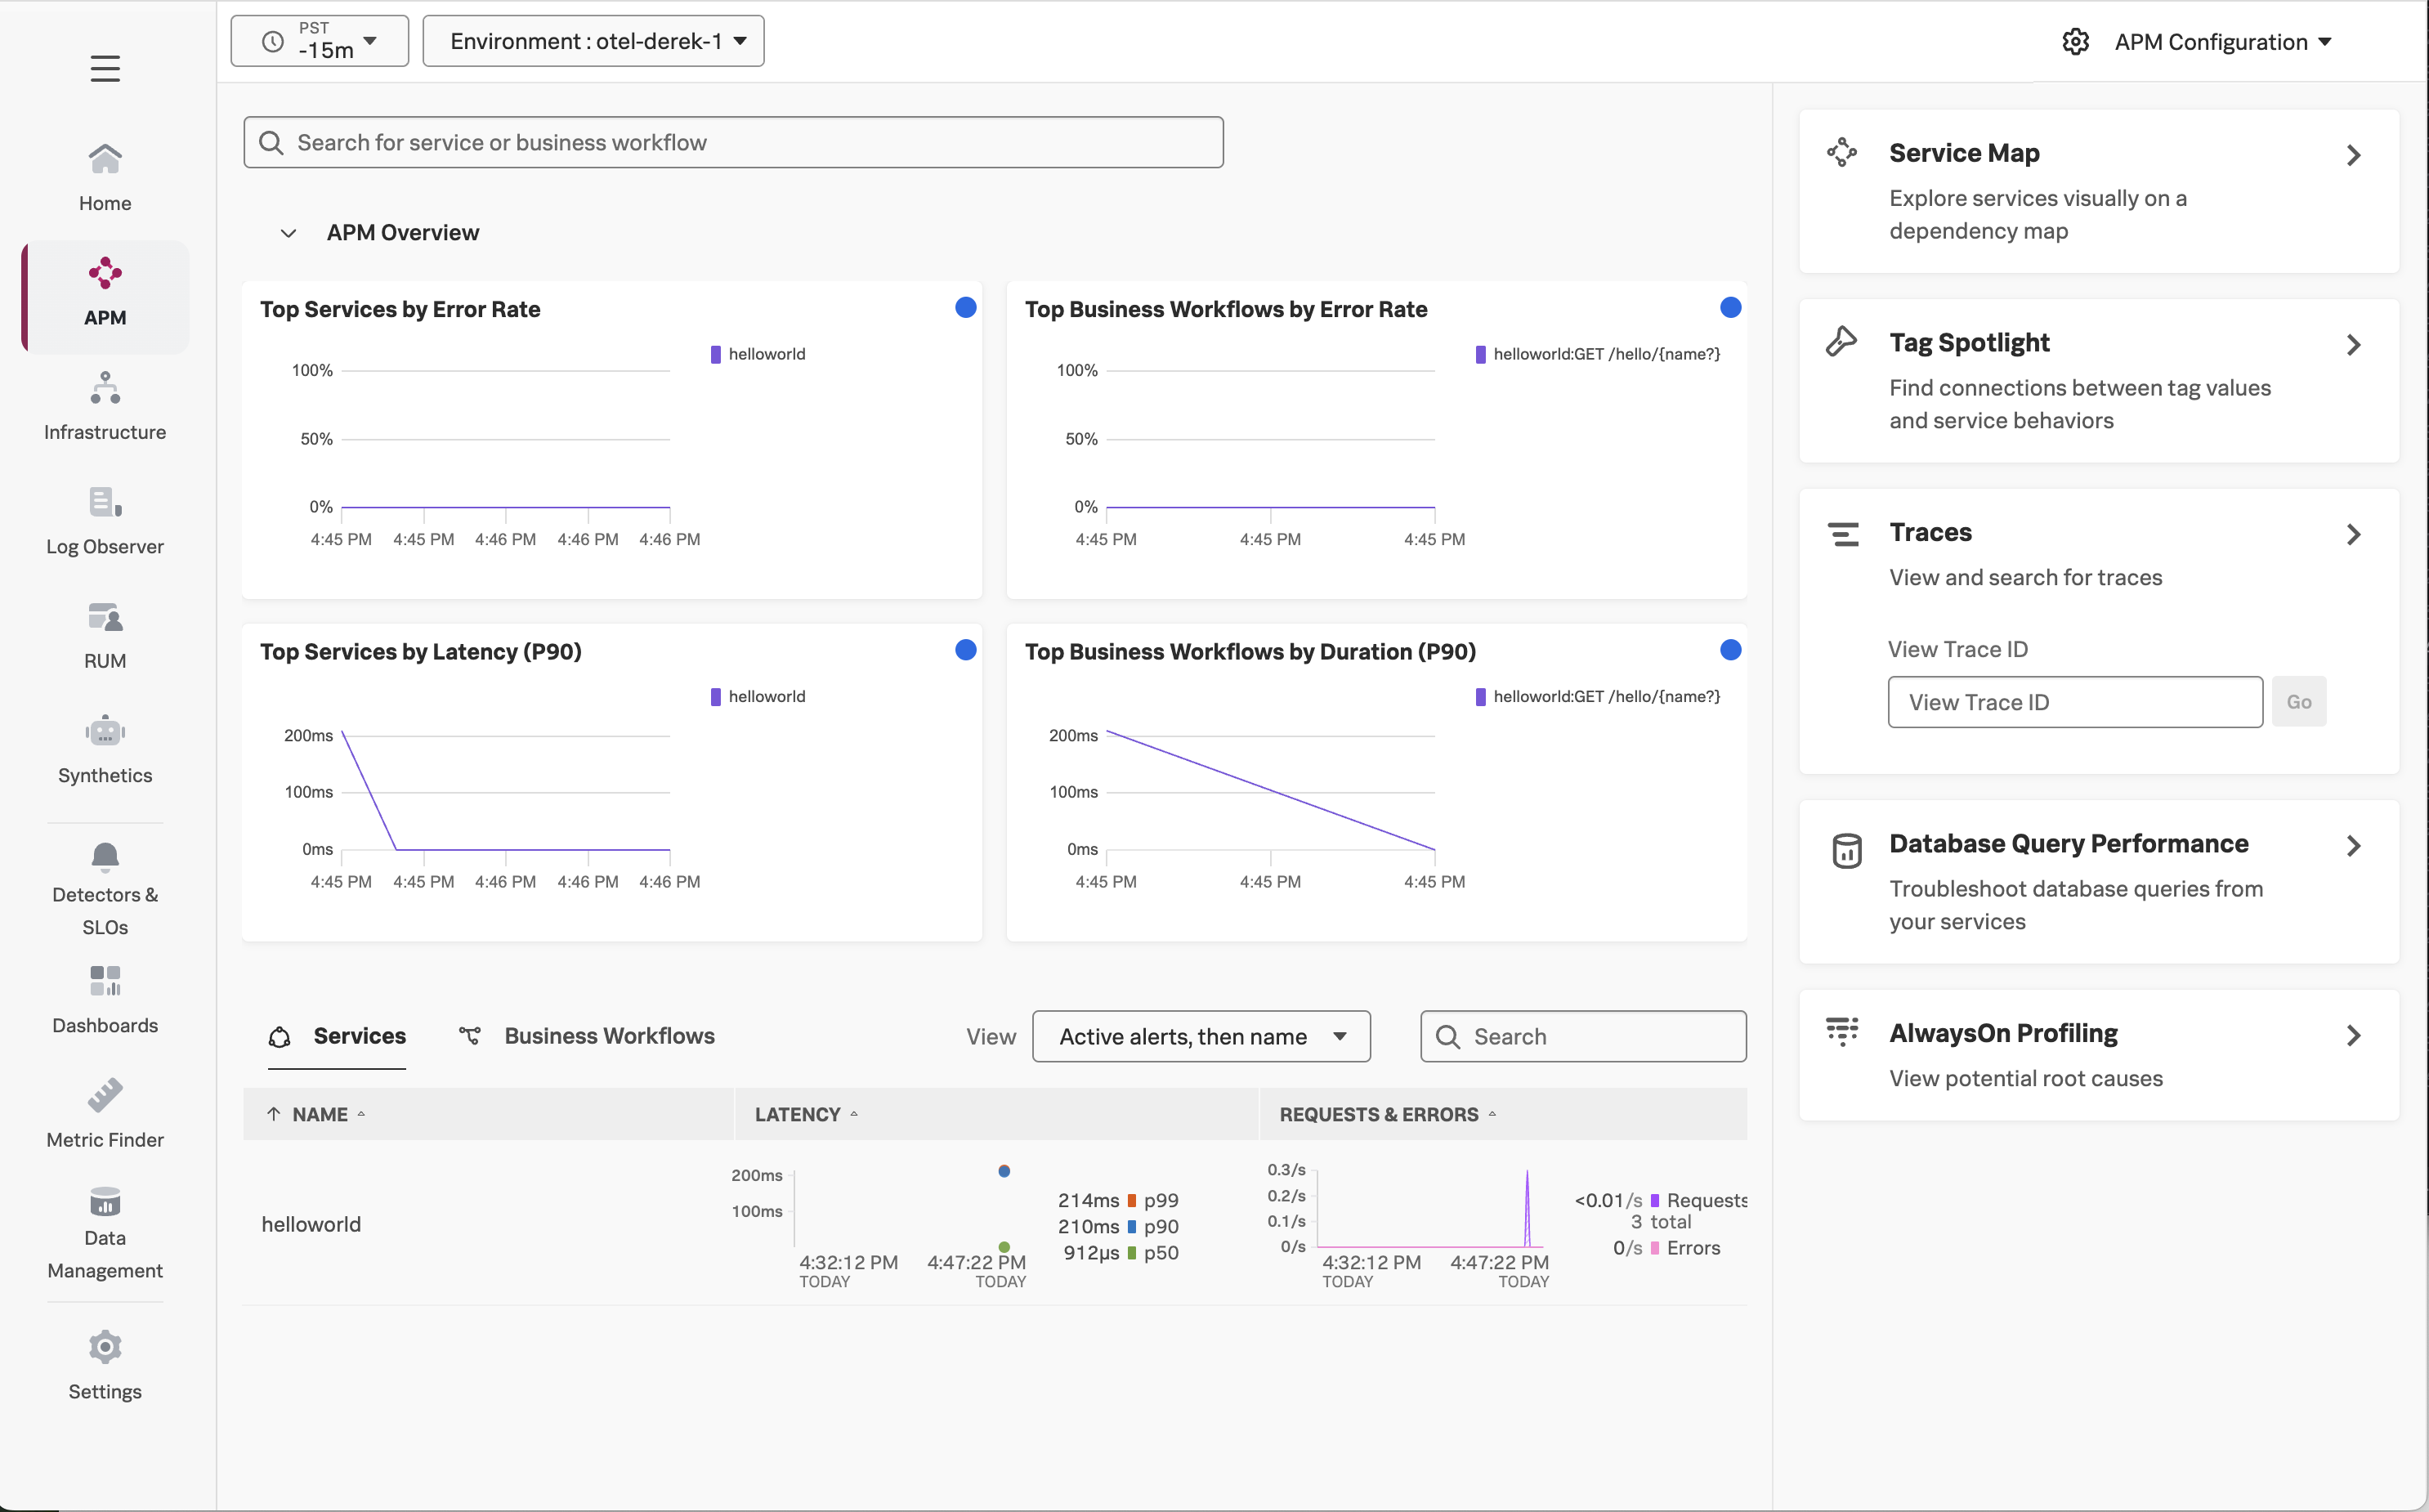
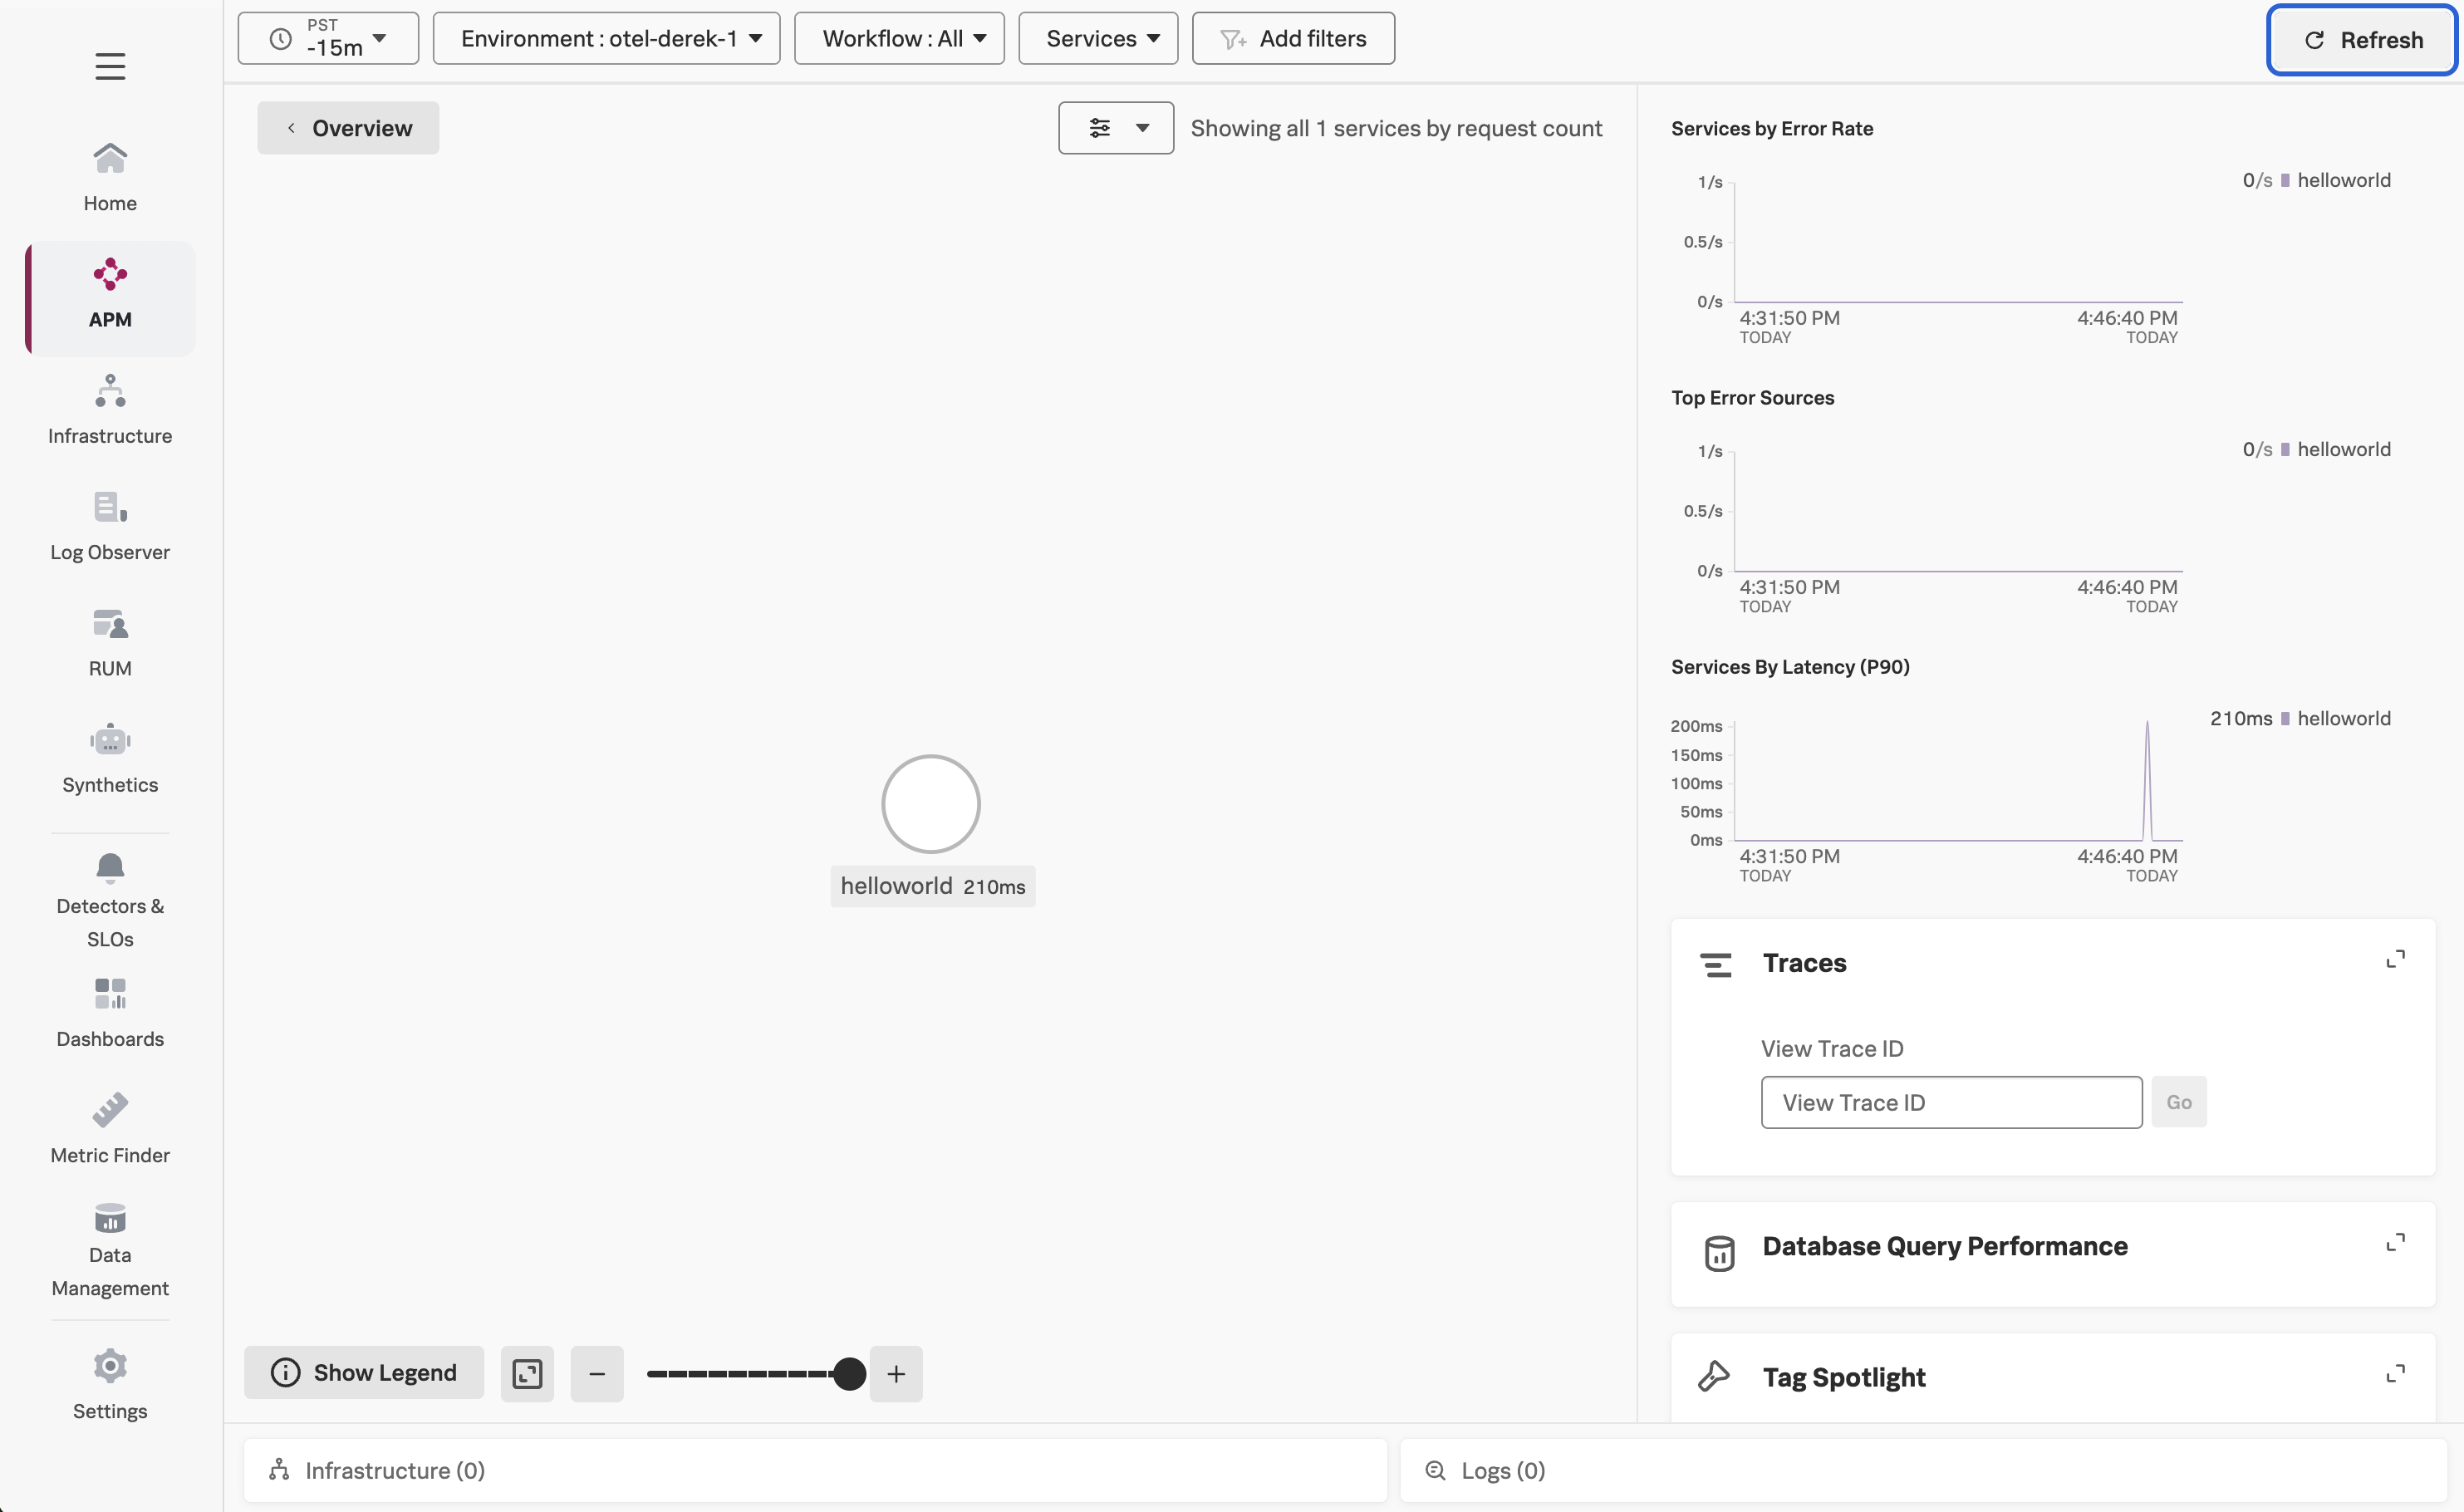
Click on Service Map on the right-hand side to view the service map.
Next, click on Traces on the right-hand side to see the traces captured for this application.
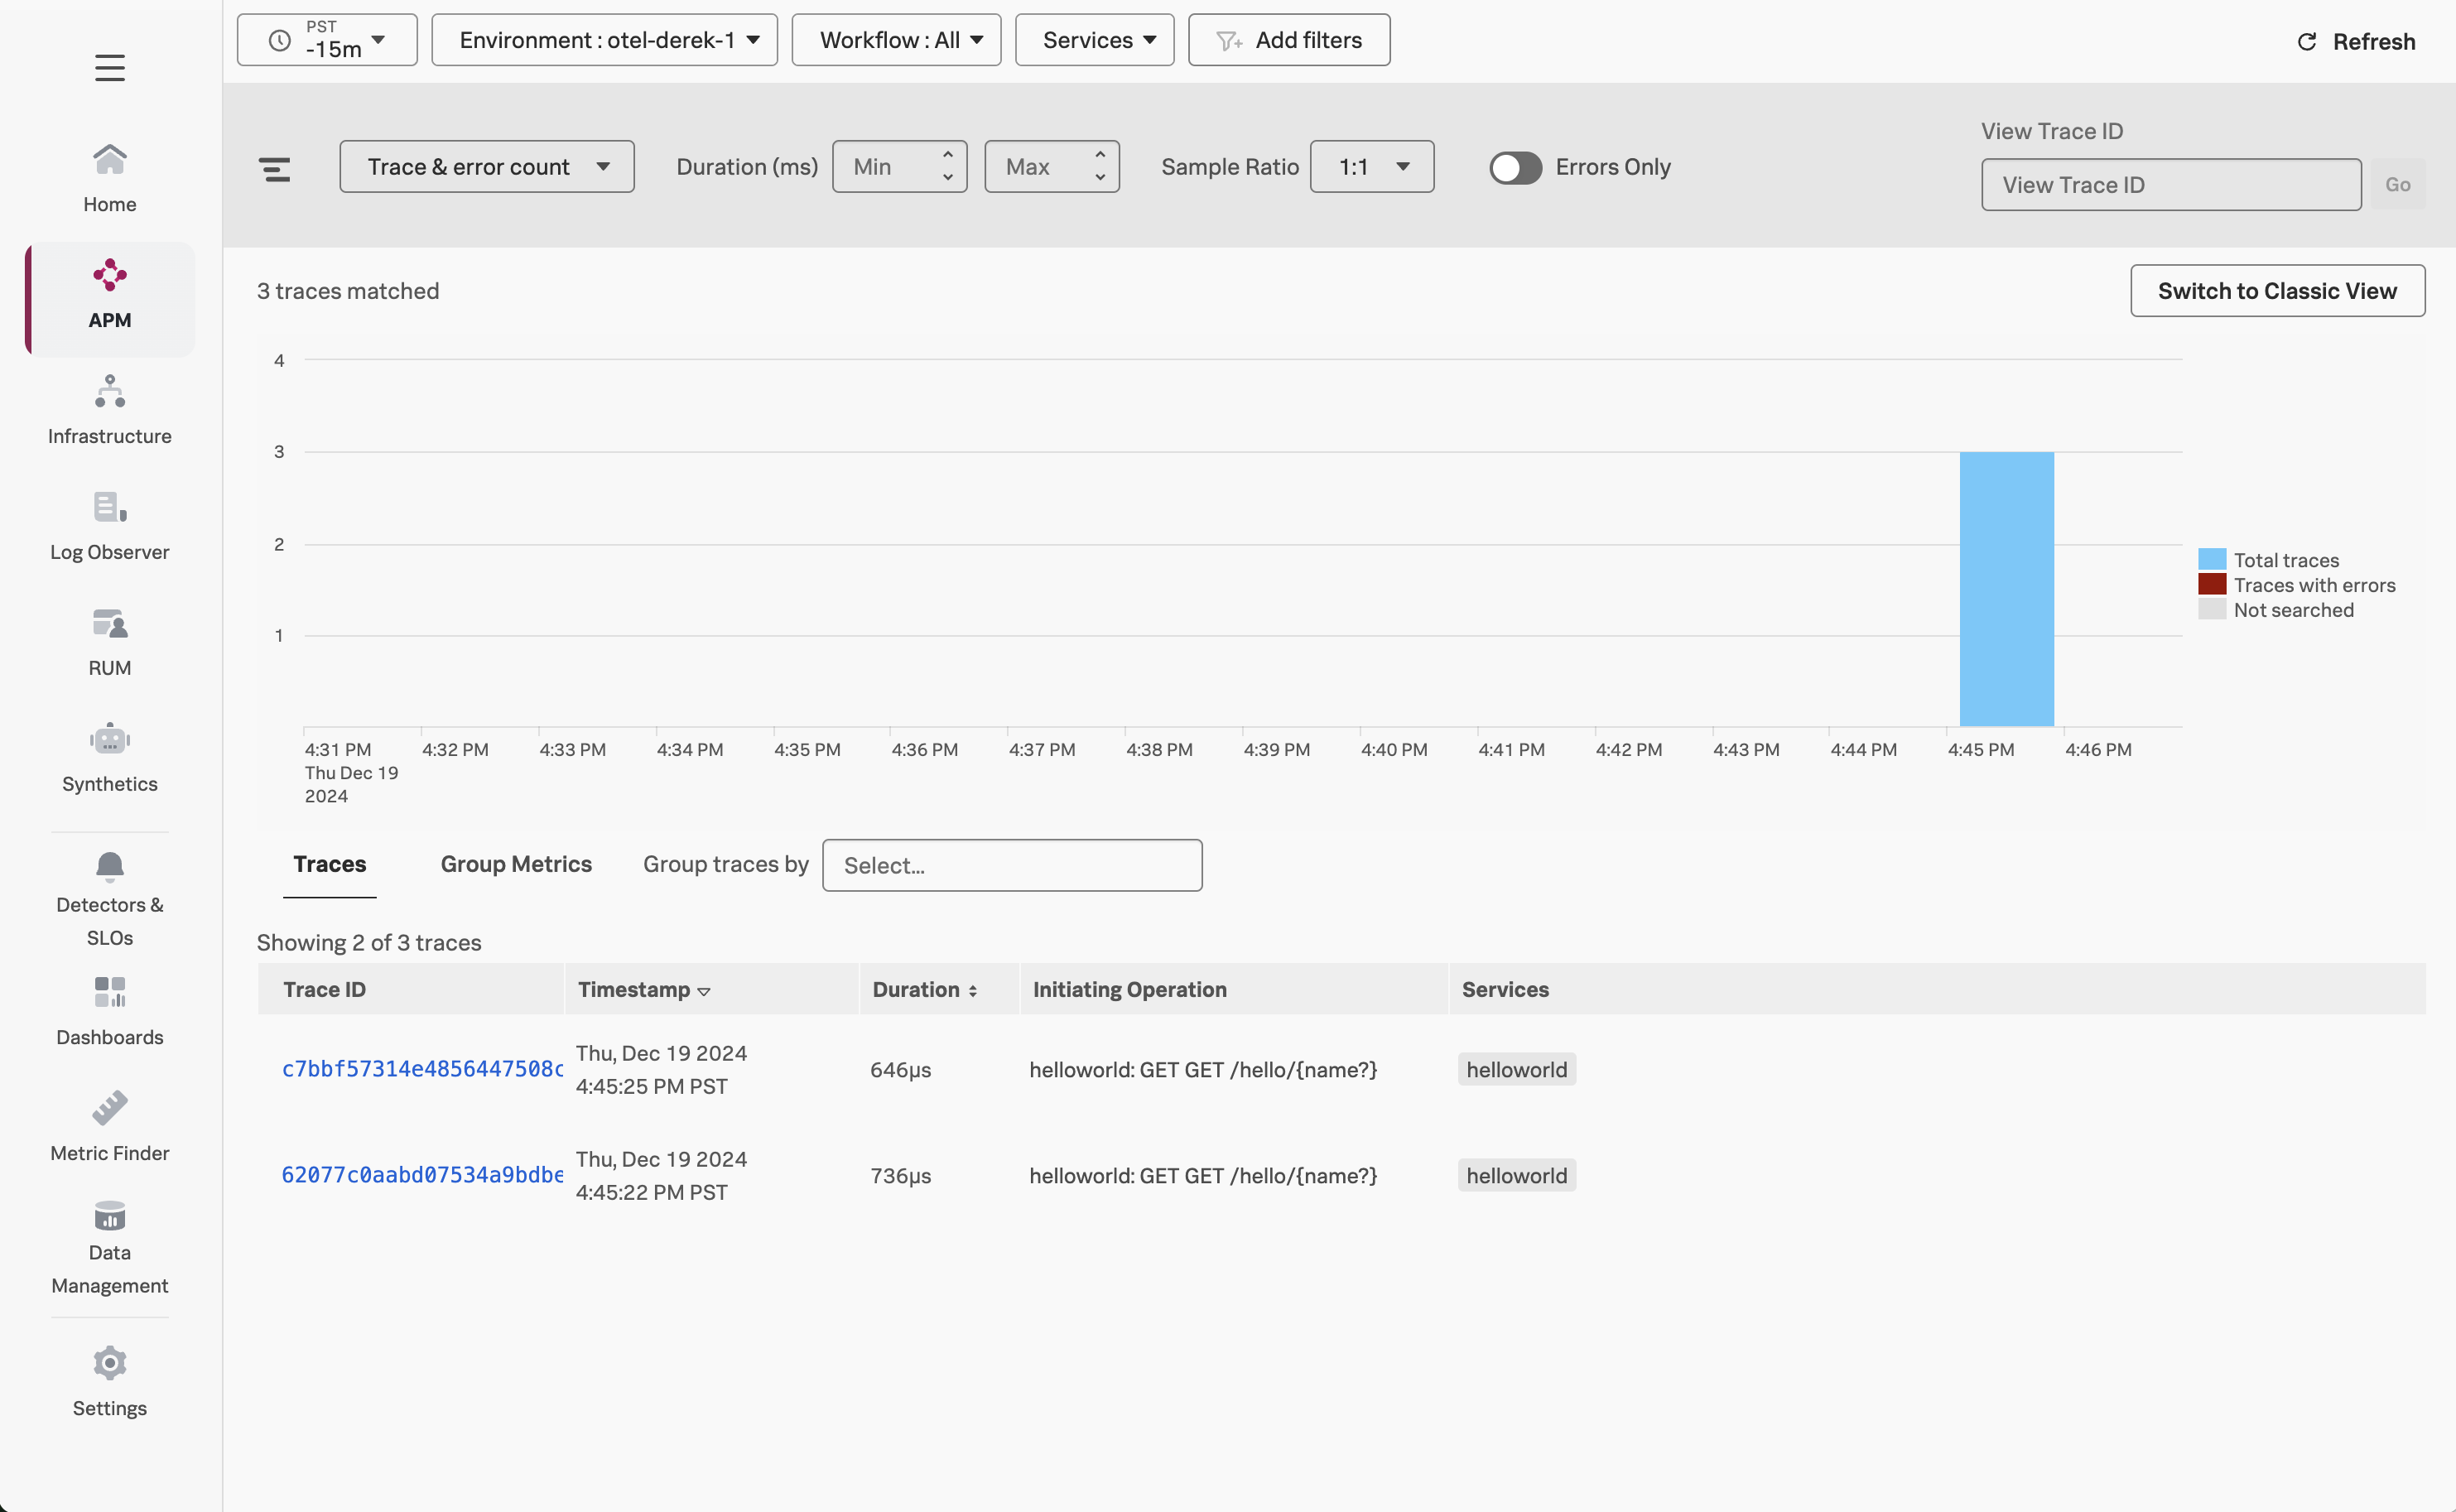
An individual trace should look like the following:
Press Ctrl + C to quit your Helloworld app before moving to the next step.