Install the OpenTelemetry Collector in K8s
15 minutesRecap of Part 1 of the Workshop
At this point in the workshop, we’ve successfully:
- Deployed the Splunk distribution of the OpenTelemetry Collector on our Linux Host
- Configured it to send traces and metrics to Splunk Observability Cloud
- Deployed a .NET application and instrumented it with OpenTelemetry
- Dockerized the .NET application and ensured traces are flowing to o11y cloud
If you haven’t completed the steps listed above, please execute the following commands before proceeding with the remainder of the workshop:
cp /home/splunk/workshop/docker-k8s-otel/docker/Dockerfile /home/splunk/workshop/docker-k8s-otel/helloworld/
cp /home/splunk/workshop/docker-k8s-otel/docker/entrypoint.sh /home/splunk/workshop/docker-k8s-otel/helloworld/
IMPORTANT once these files are copied, open
/home/splunk/workshop/docker-k8s-otel/helloworld/Dockerfile
with an editor and replace$INSTANCEin your Dockerfile with your instance name, which can be determined by runningecho $INSTANCE.
Introduction to Part 2 of the Workshop
In the next part of the workshop, we want to run the application in Kubernetes, so we’ll need to deploy the Splunk distribution of the OpenTelemetry Collector in our Kubernetes cluster.
Let’s define some key terms first.
Key Terms
What is Kubernetes?
“Kubernetes is a portable, extensible, open source platform for managing containerized workloads and services, that facilitates both declarative configuration and automation.”
Source: https://kubernetes.io/docs/concepts/overview/
We’ll deploy the Docker image we built earlier for our application into our Kubernetes cluster, after making a small modification to the Dockerfile.
What is Helm?
Helm is a package manager for Kubernetes.
“It helps you define, install, and upgrade even the most complex Kubernetes application.”
Source: https://helm.sh/
We’ll use Helm to deploy the OpenTelemetry collector in our K8s cluster.
Benefits of Helm
- Manage Complexity
- deal with a single values.yaml file rather than dozens of manifest files
- Easy Updates
- in-place upgrades
- Rollback support
- Just use helm rollback to roll back to an older version of a release
Uninstall the Host Collector
Before moving forward, let’s remove the collector we installed earlier on the Linux host:
curl -sSL https://dl.signalfx.com/splunk-otel-collector.sh > /tmp/splunk-otel-collector.sh;
sudo sh /tmp/splunk-otel-collector.sh --uninstall
Install the Collector using Helm
Let’s use the command line rather than the in-product wizard to create our own
helm command to install the collector.
We first need to add the helm repo:
helm repo add splunk-otel-collector-chart https://signalfx.github.io/splunk-otel-collector-chartAnd ensure the repo is up-to-date:
helm repo updateTo configure the helm chart deployment, let’s create a new file named values.yaml in
the /home/splunk directory:
# swith to the /home/splunk dir
cd /home/splunk
# create a values.yaml file in vi
vi values.yaml
Press ‘i’ to enter into insert mode in vi before pasting the text below.
Then paste the following contents:
logsEngine: otel
agent:
  config:
    receivers:
      hostmetrics:
        collection_interval: 10s
        root_path: /hostfs
        scrapers:
          cpu: null
          disk: null
          filesystem:
            exclude_mount_points:
              match_type: regexp
              mount_points:
              - /var/*
              - /snap/*
              - /boot/*
              - /boot
              - /opt/orbstack/*
              - /mnt/machines/*
              - /Users/*
          load: null
          memory: null
          network: null
          paging: null
          processes: null
To save your changes in vi, press the
esckey to enter command mode, then type:wq!followed by pressing theenter/returnkey.
Now we can use the following command to install the collector:
  helm install splunk-otel-collector --version 0.111.0 \
  --set="splunkObservability.realm=$REALM" \
  --set="splunkObservability.accessToken=$ACCESS_TOKEN" \
  --set="clusterName=$INSTANCE-cluster" \
  --set="environment=otel-$INSTANCE" \
  --set="splunkPlatform.token=$HEC_TOKEN" \
  --set="splunkPlatform.endpoint=$HEC_URL" \
  --set="splunkPlatform.index=splunk4rookies-workshop" \
  -f values.yaml \
  splunk-otel-collector-chart/splunk-otel-collector
NAME: splunk-otel-collector
LAST DEPLOYED: Fri Dec 20 01:01:43 2024
NAMESPACE: default
STATUS: deployed
REVISION: 1
TEST SUITE: None
NOTES:
Splunk OpenTelemetry Collector is installed and configured to send data to Splunk Observability realm us1.Confirm the Collector is Running
We can confirm whether the collector is running with the following command:
kubectl get podsNAME READY STATUS RESTARTS AGE
splunk-otel-collector-agent-8xvk8 1/1 Running 0 49s
splunk-otel-collector-k8s-cluster-receiver-d54857c89-tx7qr 1/1 Running 0 49sConfirm your K8s Cluster is in O11y Cloud
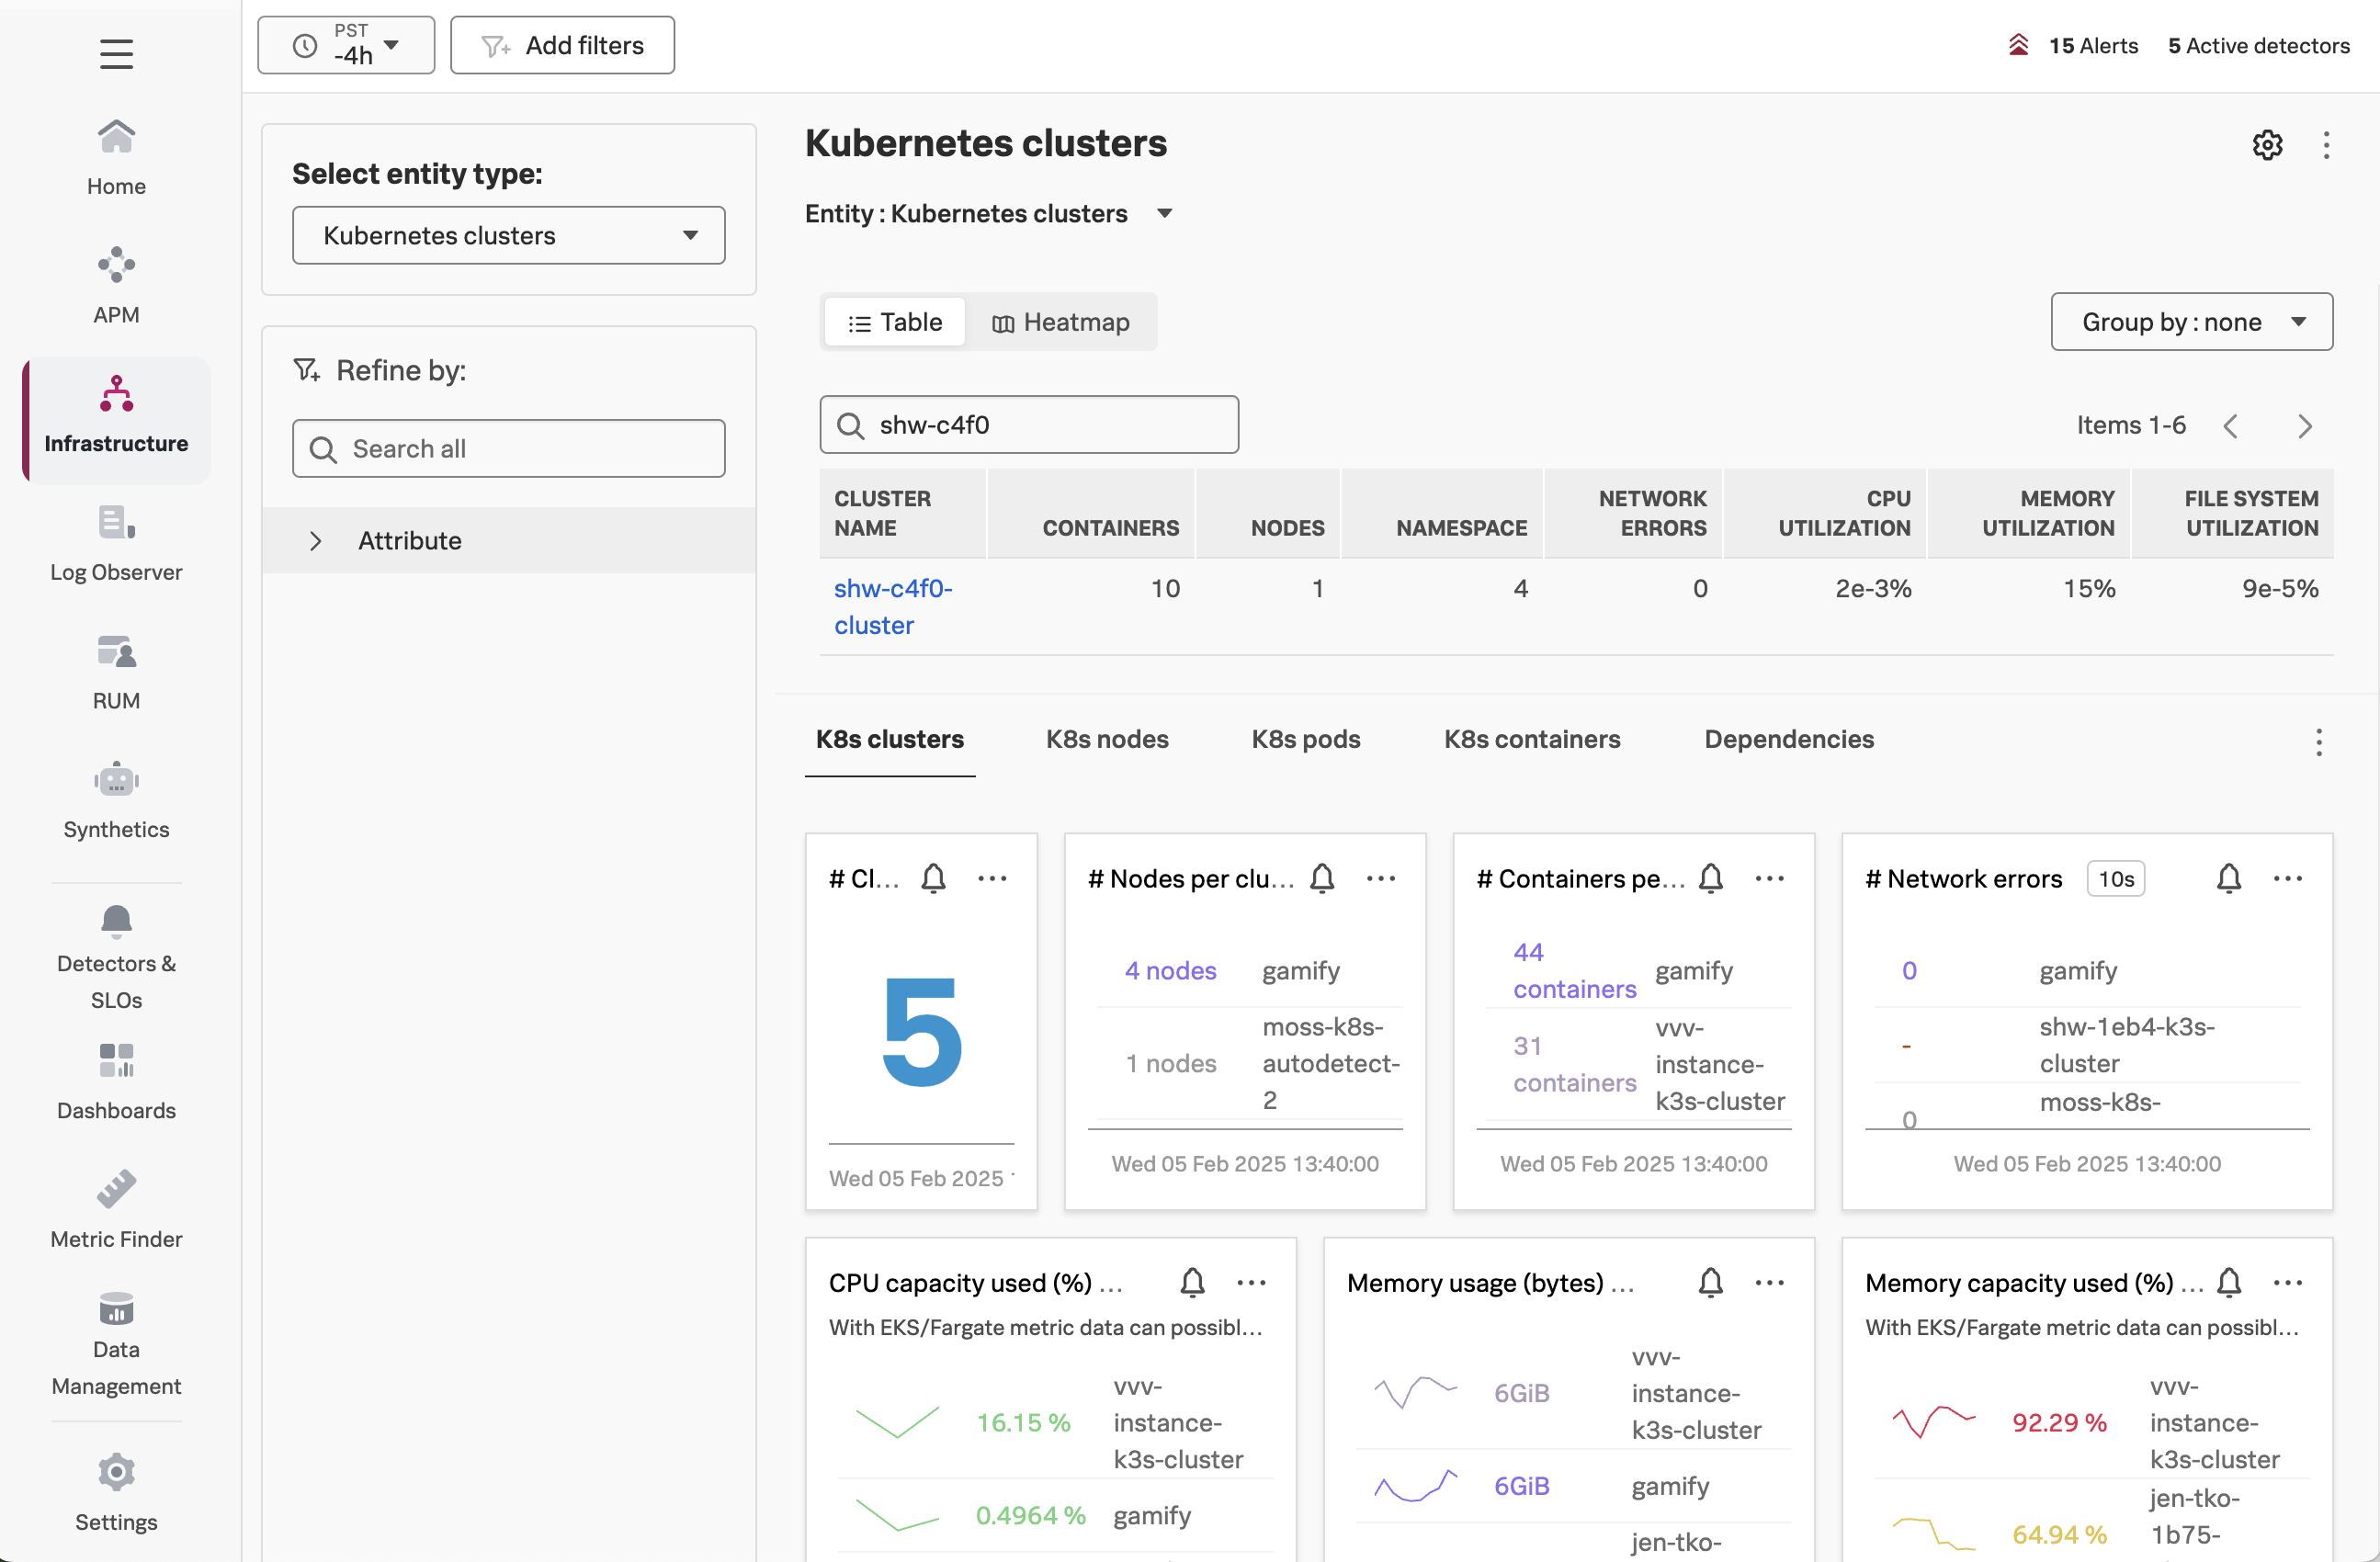
In Splunk Observability Cloud, navigate to Infrastructure -> Kubernetes -> Kubernetes Clusters,
and then search for your cluster name (which is $INSTANCE-cluster):