This workshop will enable you to build a distributed trace for a small serverless application that runs on AWS Lambda, producing and consuming a message via AWS Kinesis
By the end of this workshop you'll have gotten hands-on experience instrumenting a .NET application with OpenTelemetry, then Dockerizing the application and deploying it to Kubernetes. You’ll also gain experience deploying the OpenTelemetry collector using Helm, customizing the collector configuration, and troubleshooting collector configuration issues.
By the end of this workshop you'll have gotten hands-on experience deploying the OpenTelemetry Collector, instrumenting an application with OpenTelemetry, capturing tags from the application, and using Troubleshooting MetricSets and Tag Spotlight to determine the root cause of an issue.
In this workshop you will practice setting up the OpenTelemetry Collector configuration from scratch and go though several advanced configuration scenarios's
Learn how to enable automatic discovery and configuration for your Java-based application running in Kubernetes. Experience real-time monitoring to help you maximize application behavior with end-to-end visibility.
Subsections of Automatic Discovery Workshops
PetClinic Monolith Workshop
30 minutesAuthor
Robert Castley
The goal is to walk through the basic steps to configure the following components of the Splunk Observability Cloud platform:
Splunk Infrastructure Monitoring (IM)
Splunk Automatic Discovery for Java (APM)
Database Query Performance
AlwaysOn Profiling
Splunk Real User Monitoring (RUM)
RUM to APM Correlation
Splunk Log Observer (LO)
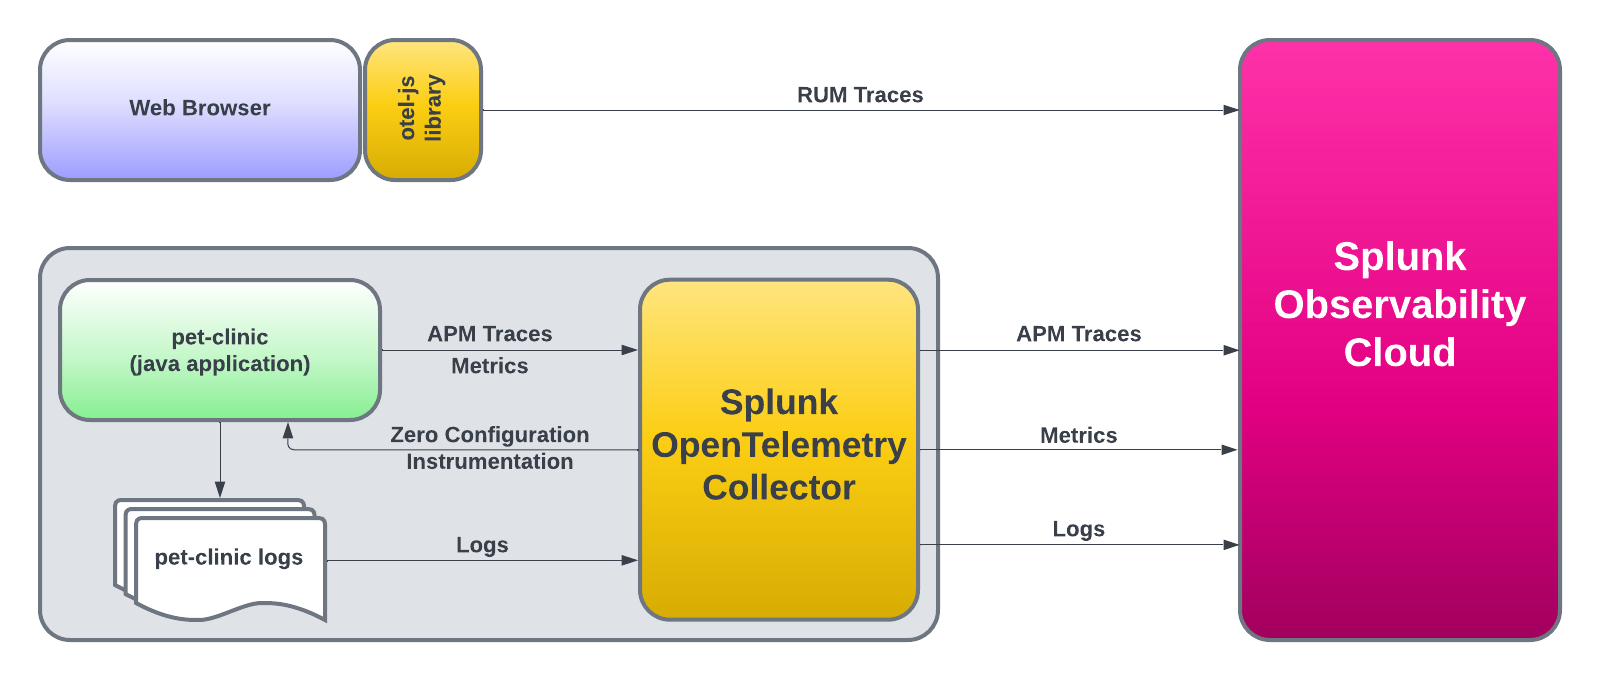
We will also show the steps about how to clone (download) a sample Java application (Spring PetClinic), as well as how to compile, package and run the application.
Once the application is up and running, we will instantly start seeing metrics, traces and logs via the automatic discovery and configuration for Java 2.x that will be used by the Splunk APM product.
After that, we will instrument PetClinic’s end user interface (HTML pages rendered by the application) with the Splunk OpenTelemetry Javascript Libraries (RUM) that will generate RUM traces around all the individual clicks and page loads executed by an end user.
Lastly, we will view the logs generated by the automatic injection of trace metadata into the PetClinic application logs.
Prerequisites
Outbound SSH access to port 2222.
Outbound HTTP access to port 8083.
Familiarity with the bash shell and vi/vim editor.
Subsections of PetClinic Monolith Workshop
Installing the OpenTelemetry Collector
The Splunk OpenTelemetry Collector is the core component of instrumenting infrastructure and applications. Its role is to collect and send:
Infrastructure metrics (disk, CPU, memory, etc)
Application Performance Monitoring (APM) traces
Profiling data
Host and application logs
Remove any existing OpenTelemetry Collectors
If you have completed the Splunk IM workshop, please ensure you have deleted the collector running in Kubernetes before continuing. This can be done by running the following command:
helm delete splunk-otel-collector
The EC2 instance may already have an older version of the collector already installed. To uninstall the collector, run the following commands:
curl -sSL https://dl.signalfx.com/splunk-otel-collector.sh > /tmp/splunk-otel-collector.sh
sudo sh /tmp/splunk-otel-collector.sh --uninstall
To ensure your instance is configured correctly, we need to confirm that the required environment variables for this workshop are set correctly. In your terminal run the following command:
. ~/workshop/scripts/check_env.sh
In the output check that all of the following environment variables are present and have values set. If any are missing, please contact your instructor:
We can then go ahead and install the Collector. Some additional parameters are passed to the install script, they are:
--with-instrumentation - This will install the agent from the Splunk distribution of OpenTelemetry Java, which is then loaded automatically when the PetClinic Java application starts up. No configuration is required!
--deployment-environment - Sets the resource attribute deployment.environment to the value passed. This is used to filter views in the UI.
--enable-profiler - Enables the profiler for the Java application. This will generate CPU profiles for the application.
--enable-profiler-memory - Enables the profiler for the Java application. This will generate memory profiles for the application.
--enable-metrics - Enables the exporting of Micrometer metrics
--hec-token - Sets the HEC token for the collector to use
--hec-url - Sets the HEC URL for the collector to use
Next, we will patch the collector to expose the hostname of the instance and not the AWS instance ID. This will make it easier to filter data in the UI:
Once the agent_config.yaml has been patched, you will need to restart the collector:
sudo systemctl restart splunk-otel-collector
Once the installation is completed, you can navigate to the Hosts with agent installed dashboard to see the data from your host, Dashboards → Hosts with agent installed.
Use the dashboard filter and select host.name and type or select the hostname of your workshop instance (you can get this from the command prompt in your terminal session). Once you see data flowing for your host, we are then ready to get started with the APM component.
Building the Spring PetClinic Application
The first thing we need to set up APM is… well, an application. For this exercise, we will use the Spring PetClinic application. This is a very popular sample Java application built with the Spring framework (Springboot).
First, clone the PetClinic GitHub repository, and then we will compile, build, package and test the application:
Next, we will start another container running Locust that will generate some simple traffic to the PetClinic application. Locust is a simple load-testing tool that can be used to generate traffic to a web application.
Next, compile, build and package PetClinic using maven:
./mvnw package -Dmaven.test.skip=true
Info
This will take a few minutes the first time you run and will download a lot of dependencies before it compiles the application. Future builds will be a lot quicker.
Once the build completes, you need to obtain the public IP address of the instance you are running on. You can do this by running the following command:
curl http://ifconfig.me
You will see an IP address returned, make a note of this as we will need it to validate that the application is running.
Automatic discovery and configuration for Java
You can now start the application with the following command. Notice that we are passing the mysql profile to the application, this will tell the application to use the MySQL database we started earlier. We are also setting the otel.service.name and otel.resource.attributes to a logical names using the instance name. These will also be used in the UI for filtering:
You can validate the application is running by visiting http://<IP_ADDRESS>:8083 (replace <IP_ADDRESS> with the IP address you obtained earlier).
When we installed the collector we configured it to enable AlwaysOn Profiling and Metrics. This means that the collector will automatically generate CPU and Memory profiles for the application and send them to Splunk Observability Cloud.
When you start the PetClinic application you will see the collector automatically detect the application and instrument it for traces and profiling.
Picked up JAVA_TOOL_OPTIONS: -javaagent:/usr/lib/splunk-instrumentation/splunk-otel-javaagent.jar
OpenJDK 64-Bit Server VM warning: Sharing is only supported for boot loader classes because bootstrap classpath has been appended
[otel.javaagent 2024-08-20 11:35:58:970 +0000] [main] INFO io.opentelemetry.javaagent.tooling.VersionLogger - opentelemetry-javaagent - version: splunk-2.6.0-otel-2.6.0
[otel.javaagent 2024-08-20 11:35:59:730 +0000] [main] INFO com.splunk.opentelemetry.profiler.ConfigurationLogger - -----------------------
[otel.javaagent 2024-08-20 11:35:59:730 +0000] [main] INFO com.splunk.opentelemetry.profiler.ConfigurationLogger - Profiler configuration:
[otel.javaagent 2024-08-20 11:35:59:730 +0000] [main] INFO com.splunk.opentelemetry.profiler.ConfigurationLogger -                  splunk.profiler.enabled : true
[otel.javaagent 2024-08-20 11:35:59:731 +0000] [main] INFO com.splunk.opentelemetry.profiler.ConfigurationLogger -                splunk.profiler.directory : /tmp
[otel.javaagent 2024-08-20 11:35:59:731 +0000] [main] INFO com.splunk.opentelemetry.profiler.ConfigurationLogger -       splunk.profiler.recording.duration : 20s
[otel.javaagent 2024-08-20 11:35:59:731 +0000] [main] INFO com.splunk.opentelemetry.profiler.ConfigurationLogger -               splunk.profiler.keep-files : false
[otel.javaagent 2024-08-20 11:35:59:732 +0000] [main] INFO com.splunk.opentelemetry.profiler.ConfigurationLogger -            splunk.profiler.logs-endpoint : null
[otel.javaagent 2024-08-20 11:35:59:732 +0000] [main] INFO com.splunk.opentelemetry.profiler.ConfigurationLogger -              otel.exporter.otlp.endpoint : null
[otel.javaagent 2024-08-20 11:35:59:732 +0000] [main] INFO com.splunk.opentelemetry.profiler.ConfigurationLogger -           splunk.profiler.memory.enabled : true
[otel.javaagent 2024-08-20 11:35:59:732 +0000] [main] INFO com.splunk.opentelemetry.profiler.ConfigurationLogger -        splunk.profiler.memory.event.rate : 150/s
[otel.javaagent 2024-08-20 11:35:59:732 +0000] [main] INFO com.splunk.opentelemetry.profiler.ConfigurationLogger -      splunk.profiler.call.stack.interval : PT10S
[otel.javaagent 2024-08-20 11:35:59:733 +0000] [main] INFO com.splunk.opentelemetry.profiler.ConfigurationLogger -  splunk.profiler.include.internal.stacks : false
[otel.javaagent 2024-08-20 11:35:59:733 +0000] [main] INFO com.splunk.opentelemetry.profiler.ConfigurationLogger -      splunk.profiler.tracing.stacks.only : false
[otel.javaagent 2024-08-20 11:35:59:733 +0000] [main] INFO com.splunk.opentelemetry.profiler.ConfigurationLogger - -----------------------
[otel.javaagent 2024-08-20 11:35:59:733 +0000] [main] INFO com.splunk.opentelemetry.profiler.JfrActivator - Profiler is active.
You can now visit the Splunk APM UI and examine the application components, traces, profiling, DB Query performance and metrics. From the left-hand menu click APM and then click the Environment dropdown and select your environment e.g. <INSTANCE>-petclinic (where<INSTANCE> is replaced with the value you noted down earlier).
Once your validation is complete you can stop the application by pressing Ctrl-c.
Resource attributes can be added to every reported span. For example version=0.314. A comma-separated list of resource attributes can also be defined e.g. key1=val1,key2=val2.
Let’s launch the PetClinic again using new resource attributes. Note, that adding resource attributes to the run command will override what was defined when we installed the collector. Let’s add a new resource attribute version=0.314:
Back in the Splunk APM UI we can drill down on a recent trace and see the new version attribute in a span.
3. Real User Monitoring
For the Real User Monitoring (RUM) instrumentation, we will add the Open Telemetry Javascript https://github.com/signalfx/splunk-otel-js-web snippet in the pages, we will use the wizard again Data Management → Add Integration → RUM Instrumentation → Browser Instrumentation.
Your instructor will inform you which token to use from the dropdown, click Next. Enter App name and Environment using the following syntax:
<INSTANCE>-petclinic-service - replacing <INSTANCE> with the value you noted down earlier.
<INSTANCE>-petclinic-env - replacing <INSTANCE> with the value you noted down earlier.
The wizard will then show a snippet of HTML code that needs to be placed at the top of the pages in the <head> section. The following is an example of the (do not use this snippet, use the one generated by the wizard):
/*
IMPORTANT: Replace the <version> placeholder in the src URL with a
version from https://github.com/signalfx/splunk-otel-js-web/releases
*/
<scriptsrc="https://cdn.signalfx.com/o11y-gdi-rum/latest/splunk-otel-web.js"crossorigin="anonymous"></script><script>SplunkRum.init({realm:"eu0",rumAccessToken:"<redacted>",applicationName:"petclinic-1be0-petclinic-service",deploymentEnvironment:"petclinic-1be0-petclinic-env"});</script>
The Spring PetClinic application uses a single HTML page as the “layout” page, that is reused across all pages of the application. This is the perfect location to insert the Splunk RUM Instrumentation Library as it will be loaded in all pages automatically.
Let’s then edit the layout page:
vi src/main/resources/templates/fragments/layout.html
Next, insert the snippet we generated above in the <head> section of the page. Make sure you don’t include the comment and replace <version> in the source URL to latest e.g.
Then let’s visit the application using a browser to generate real-user traffic http://<IP_ADDRESS>:8083.
In RUM, filter down into the environment as defined in the RUM snippet above and click through to the dashboard.
When you drill down into a RUM trace you will see a link to APM in the spans. Clicking on the trace ID will take you to the corresponding APM trace for the current RUM trace.
4. Log Observer
For the Splunk Log Observer component, the Splunk OpenTelemetry Collector automatically collects logs from the Spring PetClinic application and sends them to Splunk Observability Cloud using the OTLP exporter, anotating the log events with trace_id, span_id and trace flags.
Log Observer provides a real-time view of logs from your applications and infrastructure. It allows you to search, filter, and analyze logs to troubleshoot issues and monitor your environment.
Go back to the PetClinic web application and click on the Error link several times. This will generate some log messages in the PetClinic application logs.
From the left-hand menu click on Log Observer and ensure Index is set to splunk4rookies-workshop.
Next, click Add Filter search for the field service.name select the value <INSTANCE>-petclinic-service and click = (include). You should now see only the log messages from your PetClinic application.
Select one of the log entries that were generated by clicking on the Error link in the PetClinic application. You will see the log message and the trace metadata that was automatically injected into the log message. Also, you will notice that Related Content is available for APM and Infrastructure.
This is the end of the workshop and we have certainly covered a lot of ground. At this point, you should have metrics, traces (APM & RUM), logs, database query performance and code profiling being reported into Splunk Observability Cloud and all without having to modify the PetClinic application code (well except for RUM).
Congratulations!
Spring PetClinic SpringBoot Based Microservices On Kubernetes
90 minutesAuthor
Pieter Hagen
The goal of this workshop is to introduce the features of Splunk’s automatic discovery and configuration for Java.
The workshop scenario will be created by installing a simple (un-instrumented) Java microservices application in Kubernetes.
By following the simple steps to install the Splunk OpenTelemetry Collector and enabling automatic discovery and configuration for existing Java based deployments you will learn how easy it is to send metrics, traces and logs to Splunk Observability Cloud.
Prerequisites
Outbound SSH access to port 2222.
Outbound HTTP access to port 81.
Familiarity with the Linux command line.
During this workshop we will cover the following components:
Splunk Infrastructure Monitoring (IM)
Splunk automatic discovery and configuration for Java (APM)
Database Query Performance
AlwaysOn Profiling
Splunk Log Observer (LO)
Splunk Real User Monitoring (RUM)
Splunk Synthetics is feeling a little left out here, but we cover that in other workshops
Subsections of PetClinic Kubernetes Workshop
Architecture
5 minutes
The Spring PetClinic Java application is a simple microservices application that consists of a frontend and backend services. The frontend service is a Spring Boot application that serves a web interface to interact with the backend services. The backend services are Spring Boot applications that serve RESTful API’s to interact with a MySQL database.
By the end of this workshop, you will have a better understanding of how to enable automatic discovery and configuration for your Java-based applications running in Kubernetes.
The diagram below details the architecture of the Spring PetClinic Java application running in Kubernetes with the Splunk OpenTelemetry Operator and automatic discovery and configuration enabled.
The instructor will provide you with the login information for the instance that we will be using during the workshop.
When you first log into your instance, you will be greeted by the Splunk Logo as shown below. If you have any issues connecting to your workshop instance then please reach out to your Instructor.
$ ssh -p 2222 splunk@<ip-address>

███████╗██████╗ ██╗     ██╗   ██╗███╗   ██╗██╗  ██╗    ██╗
██╔════╝██╔══██╗██║     ██║   ██║████╗  ██║██║ ██╔╝    ╚██╗
███████╗██████╔╝██║     ██║   ██║██╔██╗ ██║█████╔╝      ╚██╗
╚════██║██╔═══╝ ██║     ██║   ██║██║╚██╗██║██╔═██╗      ██╔╝
███████║██║     ███████╗╚██████╔╝██║ ╚████║██║  ██╗    ██╔╝
╚══════╝╚═╝     ╚══════╝ ╚═════╝ ╚═╝  ╚═══╝╚═╝  ╚═╝    ╚═╝
Last login: Mon Feb  5 11:04:54 2024 from [Redacted]
Waiting for cloud-init status...
Your instance is ready!
splunk@show-no-config-i-0d1b29d967cb2e6ff:~$
To ensure your instance is configured correctly, we need to confirm that the required environment variables for this workshop are set correctly. In your terminal run the following script and check that the environment variables are present and set with actual valid values:
Please make a note of the INSTANCE environment variable value as this will used later to filter data in Splunk Observability Cloud.
For this workshop, all of the above are required. If any have values missing, please contact your Instructor.
Delete any existing OpenTelemetry Collectors
If you have previously completed a Splunk Observability workshop using this EC2 instance, you
need to ensure that any existing installation of the Splunk OpenTelemetry Collector is
deleted. This can be achieved by running the following command:
helm delete splunk-otel-collector
Subsections of 2. Preparation
Deploy the Splunk OpenTelemetry Collector
To get Observability signals (metrics, traces and logs) into Splunk Observability Cloud the Splunk OpenTelemetry Collector needs to be deployed into the Kubernetes cluster.
For this workshop, we will be using the Splunk OpenTelemetry Collector Helm Chart. First we need to add the Helm chart repository to Helm and update to ensure the latest version:
Using ACCESS_TOKEN={REDACTED}
Using REALM=eu0
"splunk-otel-collector-chart" has been added to your repositories
Using ACCESS_TOKEN={REDACTED}
Using REALM=eu0
Hang tight while we grab the latest from your chart repositories...
...Successfully got an update from the "splunk-otel-collector-chart" chart repository
Update Complete. ⎈Happy Helming!⎈
Splunk Observability Cloud offers wizards in the UI to walk you through the setup of the OpenTelemetry Collector on Kubernetes, but in the interest of time, we will use the Helm install command below. Additional parameters are set to enable the operator and automatic discovery and configuration.
--set="operator.enabled=true" - this will install the Opentelemetry operator that will be used to handle automatic discovery and configuration.
--set="certmanager.enabled=true" - this will install the required certificate manager for the operator.
--set="splunkObservability.profilingEnabled=true" - this enables Code Profiling via the operator.
To install the collector run the following command, do NOT edit this:
LAST DEPLOYED: Fri Apr 19 09:39:54 2024
NAMESPACE: default
STATUS: deployed
REVISION: 1
NOTES:
Splunk OpenTelemetry Collector is installed and configured to send data to Splunk Platform endpoint "https://http-inputs-o11y-workshop-eu0.splunkcloud.com:443/services/collector/event".

Splunk OpenTelemetry Collector is installed and configured to send data to Splunk Observability realm eu0.

[INFO] You've enabled the operator's auto-instrumentation feature (operator.enabled=true)! The operator can automatically instrument Kubernetes hosted applications.
  - Status: Instrumentation language maturity varies. See `operator.instrumentation.spec` and documentation for utilized instrumentation details.
  - Splunk Support: We offer full support for Splunk distributions and best-effort support for native OpenTelemetry distributions of auto-instrumentation libraries.
Ensure the Pods are reported as Running before continuing (this typically takes around 30 seconds).
Ensure there are no errors reported by the Splunk OpenTelemetry Collector (press ctrl + c to exit) or use the installed awesomek9s terminal UI for bonus points!
2021-03-21T16:11:10.900Z        INFO    service/service.go:364  Starting receivers...
2021-03-21T16:11:10.900Z        INFO    builder/receivers_builder.go:70 Receiver is starting... {"component_kind": "receiver", "component_type": "prometheus", "component_name": "prometheus"}
2021-03-21T16:11:11.009Z        INFO    builder/receivers_builder.go:75 Receiver started.       {"component_kind": "receiver", "component_type": "prometheus", "component_name": "prometheus"}
2021-03-21T16:11:11.009Z        INFO    builder/receivers_builder.go:70 Receiver is starting... {"component_kind": "receiver", "component_type": "k8s_cluster", "component_name": "k8s_cluster"}
2021-03-21T16:11:11.009Z        INFO    k8sclusterreceiver@v0.21.0/watcher.go:195       Configured Kubernetes MetadataExporter  {"component_kind": "receiver", "component_type": "k8s_cluster", "component_name": "k8s_cluster", "exporter_name": "signalfx"}
2021-03-21T16:11:11.009Z        INFO    builder/receivers_builder.go:75 Receiver started.       {"component_kind": "receiver", "component_type": "k8s_cluster", "component_name": "k8s_cluster"}
2021-03-21T16:11:11.009Z        INFO    healthcheck/handler.go:128      Health Check state change       {"component_kind": "extension", "component_type": "health_check", "component_name": "health_check", "status": "ready"}
2021-03-21T16:11:11.009Z        INFO    service/service.go:267  Everything is ready. Begin running and processing data.
2021-03-21T16:11:11.009Z        INFO    k8sclusterreceiver@v0.21.0/receiver.go:59       Starting shared informers and wait for initial cache sync.      {"component_kind": "receiver", "component_type": "k8s_cluster", "component_name": "k8s_cluster"}
2021-03-21T16:11:11.281Z        INFO    k8sclusterreceiver@v0.21.0/receiver.go:75       Completed syncing shared informer caches.       {"component_kind": "receiver", "component_type": "k8s_cluster", "component_name": "k8s_cluster"}
Deleting a failed installation
If you make an error installing the OpenTelemetry Collector you can start over by deleting the
installation with the following command:
helm delete splunk-otel-collector
Deploy the PetClinic Application
The first deployment of the application will be using prebuilt containers to give the base scenario: a regular Java microservices-based application running in Kubernetes that we want to start observing. So let’s deploy the application:
deployment.apps/config-server created
service/config-server created
deployment.apps/discovery-server created
service/discovery-server created
deployment.apps/api-gateway created
service/api-gateway created
service/api-gateway-external created
deployment.apps/customers-service created
service/customers-service created
deployment.apps/vets-service created
service/vets-service created
deployment.apps/visits-service created
service/visits-service created
deployment.apps/admin-server created
service/admin-server created
service/petclinic-db created
deployment.apps/petclinic-db created
configmap/petclinic-db-initdb-config created
deployment.apps/petclinic-loadgen-deployment created
configmap/scriptfile created
At this point, we can verify the deployment by checking that the Pods are running. The containers need to be downloaded and started so this may take a couple of minutes.
Make sure the output of kubectl get pods matches the output as shown above. Ensure all the services are shown as Running (or use k9s to continuously monitor the status).
To test the application you need to obtain the public IP address of the instance you are running on. You can do this by running the following command:
curl http://ifconfig.me
You can validate if the application is running by visiting http://<IP_ADDRESS>:81 (replace <IP_ADDRESS> with the IP address you obtained above). You should see the PetClinic application running. The application is also running on ports 80 & 443 if you prefer to use those or port 81 is unreachable.
Make sure the application is working correctly by visiting the All Owners(1) and Veterinarians(2) tabs, you should get a list of names in each case.
Verify Kubernetes Cluster metrics
10 minutes
Once the installation has been completed, you can log in to Splunk Observability Cloud and verify that the metrics are flowing in from your Kubernetes cluster.
From the left-hand menu click on Infrastructure and select Kubernetes, then select the Kubernetes nodes pane. Once you are in the Kubernetes nodes view, change the Time filter from -4h to the last 15 minutes (-15m) to focus on the latest data.
Next, from the list of clusters, select the cluster name of your workshop instance (you can get the unique part from your cluster name by using the INSTANCE from the output from the shell script you ran earlier). (1)
You can now select your node by clicking on it name (1) in the node list.
Open the Hierarchy Map by clicking on the Hierarchy Map(1) link in the gray pane to show the graphical representation of your node.
You will now only have your cluster visible.
Scroll down the page to see the metrics coming in from your cluster. Locate the Node log events rate chart and click on a vertical bar to see the log entries coming in from your cluster.
Setting up automatic discovery and configuration for APM
10 minutes
In this section we will enable automatic discovery and configuration for the Java services running in Kubernetes. This means that the OpenTelemetry Collector will look for Pod annotations that indicate that the Java application should be instrumented with the Splunk OpenTelemetry Java agent. This will allow us to get traces, spans, and profiling data from the Java services running on the cluster.
automatic discovery and configuration
It is important to understand that automatic discovery and configuration is designed to get trace, span & profiling data out of your application, without requiring code changes or recompilation.
This is a great way to get started with APM, but it is not a replacement for manual instrumentation. Manual instrumentation allows you to add custom spans, tags, and logs to your application, which can provide more context and detail to your traces.
For Java applications the OpenTelemetry Collector will look for the annotation instrumentation.opentelemetry.io/inject-java.
The annotation can have the value set true or to the namespace/daemonset of the OpenTelemetry Collector e.g. default/splunk-otel-collector. This allows working across namespaces and what we will use in this workshop.
Using the deployment.yaml
If you want your Pods to send traces automatically, you can add the annotation to the deployment.yaml as shown below. This will add the instrumentation library during the initial deployment. To speed things up we have done that for the following Pods:
Subsections of 4. Automatic discovery and configuration
Patching the Deployment
To configure automatic discovery and configuration the deployments need to be patched to add the instrumentation annotation. Once patched, the OpenTelemetry Collector will inject the automatic discovery and configuration library and the Pods will be restarted in order to start sending traces and profiling data. First, confirm that the api-gateway does not have the splunk-otel-java image.
Next, enable the Java automatic discovery and configuration for all of the services by adding the annotation to the deployments. The following command will patch the all deployments. This will trigger the OpenTelemetry Operator to inject the splunk-otel-java image into the Pods:
kubectl get deployments -l app.kubernetes.io/part-of=spring-petclinic -o name | xargs -I % kubectl patch % -p "{\"spec\": {\"template\":{\"metadata\":{\"annotations\":{\"instrumentation.opentelemetry.io/inject-java\":\"default/splunk-otel-collector\"}}}}}"
deployment.apps/config-server patched (no change)
deployment.apps/admin-server patched (no change)
deployment.apps/customers-service patched
deployment.apps/visits-service patched
deployment.apps/discovery-server patched (no change)
deployment.apps/vets-service patched
deployment.apps/api-gateway patched
There will be no change for the config-server, discovery-server and admin-server as these have already been patched.
To check the container image(s) of the api-gateway pod again, run the following command:
A new image has been added to the api-gateway which will pull splunk-otel-java from ghcr.io (if you see two api-gateway containers, the original one is probably still terminating, so give it a few seconds).
Navigate back to the Kubernetes Navigator in Splunk Observability Cloud. After a couple of minutes you will see that the Pods are being restarted by the operator and the automatic discovery and configuration container will be added. This will look similar to the screenshot below:
Wait for the Pods to turn green in the Kubernetes Navigator, then go tho the next section.
Viewing the data in Splunk APM
Log in to Splunk Observability Cloud, from the left-hand menu click on APM to see the data generated by the traces from the newly instrumented services. Change the Environment filter (1) to the name of your workshop instance in the dropdown box (this will be <INSTANCE>-workshop where INSTANCE is the value from the shell script you ran earlier) and make sure it is the only one selected.
You will see the name (2) of the api-gateway service and metrics in the Latency and Request & Errors charts (you can ignore the Critical Alert, as it is caused by the sudden request increase generated by the load generator). You will also see the rest of the services appear.
Once you see the Customer service, Vets service and Visits services like show in the screenshot above, let’s click on the Service Map(3) pane to get ready for the next section.
APM Features
15 minutes
As we have seen in the previous section, once you enable automatic discovery and configuration on your services, traces are sent to Splunk Observability Cloud.
With these traces, Splunk will automatically generate Service Maps and RED Metrics. These are the first steps in understanding the behavior of your services and how they interact with each other.
In this next section, we are going to examine the traces themselves and what information they provide to help you understand the behavior of your services all without touching your code.
Subsections of 5. APM Features
APM Service Map
The above map shows all the interactions between all of the services. The map may still be in an interim state as it will take the Petclinic Microservice application a few minutes to start up and fully synchronize. Reducing the time filter to a custom time of 2 minutes will help. You can click on the Refresh button (1) on the top right of the screen. The initial startup-related errors (red dots) will eventually disappear.
Next, let’s examine the metrics that are available for each service that is instrumented and visit the request, error, and duration (RED) metrics Dashboard
For this exercise we are going to use a common scenario you would use if the service operation was showing high latency, or errors for example.
Select (click) on the Customer Service in the Dependency map (1), then make sure the customers-service is selected in the Services dropdown box (2). Next, select GET /Owners from the Operations dropdown (3)**.
This should give you the workflow with a filter on GET /owners(1) as shown below.
APM Trace
To pick a trace, select a line in the Service Requests & Errors chart (1), when the dot appears click to get a list of sample traces:
Once you have the list of sample traces, click on the blue (2) Trace ID Link (make sure it has the same three services mentioned in the Service Column.)
This brings us the the Trace selected in the Waterfall view:
Here we find several sections:
The actual Waterfall Pane (1), where you see the trace and all the instrumented functions visible as spans, with their duration representation and order/relationship showing.
The Trace Info Pane (2), by default, shows the selected Span information (highlighted with a box around the Span in the Waterfall Pane).
The Span Pane (3), here you can find all the Tags that have been sent in the selected Span, You can scroll down to see all of them.
The process Pane, with tags related to the process that created the Span (scroll down to see as it is not in the screenshot).
The Trace Properties at the top of the right-hand pane by default is collapsed as shown.
APM Span
While we examine our spans, let’s look at several features that you get out of the box without code modifications when using automatic discovery and configuration on top of tracing:
First, in the Waterfall Pane, make sure the customers-service:SELECT petclinic or similar span is selected as shown in the screenshot below:
The basic latency information is shown as a bar for the instrumented function or call, in our example, it took 17.8 Milliseconds.
Several similar Spans (1), are only visible if the span is repeated multiple times. In this case, there are 10 repeats in our example. (You can show/hide them all by clicking on the 10x and all spans will show in order)
Inferred Services: Calls made to external systems that are not instrumented, show up as a grey ‘inferred’ span. The Inferred Service or span in our case here is a call to the Mysql Database mysql:petclinic SELECT petclinic(2) as shown above our selected span.
Span Tags: In the Tag Pane, standard tags produced by the automatic discovery and configuration. In this case, the span is calling a Database, so it includes the db.statement tag (3). This tag will hold the DB query statement and is used by the Database call performed during this span. This will be used by the DB-Query Performance feature. We look at DB-Query Performance in the next section.
Always-on Profiling: IF the system is configured to and has captured Profiling data during a Span life cycle, it will show the number of Call Stacks captured in the Spans timeline (18 Call Stacks for the customer-service:GET /owners Span shown above). (4)
We will look at Profiling in the next section.
Service Centric View
Splunk APM provide Service Centric Views that provide engineers a deep understanding of service performance in one centralized view. Now, across every service, engineers can quickly identify errors or bottlenecks from a service’s underlying infrastructure, pinpoint performance degradations from new deployments, and visualize the health of every third party dependency.
To see this dashboard for the api-gateway,Click on APM from the right hand menu bar and go to the Dependency Map. Make sure you have the api-gateway service selected in the Service Map, then click on the *View Service button in the top of the right-hand pane. This will bring you to the Service Centric View dashboard:
This view, which is available for each of your instrumented services, offers an overview of Service metrics, Runtime metrics and Infrastructure metrics.
You can select the Back function of you browser to go back to the previous view.
Always-On Profiling & DB Query Performance
15 minutes
As we have seen in the previous chapter, you can trace your interactions between the various services using APM without touching your code, which will allow you to identify issues faster.
However, besides tracing automatic discovery and configuration offers additional features out of the box that can help you find issues even faster. In this section we are going to look at two of them:
Always-on Profiling and Java Metrics
Database Query Performance
If you want to dive deeper into Always-on Profiling or DB-Query performance, we have a separate Ninja Workshop called Debug Problems in Microservices that you can follow.
Subsections of 6. Advanced Features
Always-On Profiling & Metrics
When we installed the Splunk Distribution of the OpenTelemetry Collector using the Helm chart earlier, we configured it to enable AlwaysOn Profiling and Metrics. This means that the collector will automatically generate CPU and Memory profiles for the application and send them to Splunk Observability Cloud.
When you deploy the PetClinic application and set the annotation, the collector automatically detects the application and instruments it for traces and profiling. We can verify this by examining the startup logs of one of the Java containers we are instrumenting by running the following script:
The logs should show what flags were picked up by the Java automatic discovery and configuration:
. ~/workshop/petclinic/scripts/get_logs.sh
2024/02/15 09:42:00 Problem with dial: dial tcp 10.43.104.25:8761: connect: connection refused. Sleeping 1s
2024/02/15 09:42:01 Problem with dial: dial tcp 10.43.104.25:8761: connect: connection refused. Sleeping 1s
2024/02/15 09:42:02 Connected to tcp://discovery-server:8761
Picked up JAVA_TOOL_OPTIONS:  -javaagent:/otel-auto-instrumentation-java/javaagent.jar
Picked up _JAVA_OPTIONS: -Dspring.profiles.active=docker,mysql -Dsplunk.profiler.call.stack.interval=150
OpenJDK 64-Bit Server VM warning: Sharing is only supported for boot loader classes because bootstrap classpath has been appended
[otel.javaagent 2024-02-15 09:42:03:056 +0000] [main] INFO io.opentelemetry.javaagent.tooling.VersionLogger - opentelemetry-javaagent - version: splunk-1.30.1-otel-1.32.1
[otel.javaagent 2024-02-15 09:42:03:768 +0000] [main] INFO com.splunk.javaagent.shaded.io.micrometer.core.instrument.push.PushMeterRegistry - publishing metrics for SignalFxMeterRegistry every 30s
[otel.javaagent 2024-02-15 09:42:07:478 +0000] [main] INFO com.splunk.opentelemetry.profiler.ConfigurationLogger - -----------------------
[otel.javaagent 2024-02-15 09:42:07:478 +0000] [main] INFO com.splunk.opentelemetry.profiler.ConfigurationLogger - Profiler configuration:
[otel.javaagent 2024-02-15 09:42:07:480 +0000] [main] INFO com.splunk.opentelemetry.profiler.ConfigurationLogger -                  splunk.profiler.enabled : true
[otel.javaagent 2024-02-15 09:42:07:505 +0000] [main] INFO com.splunk.opentelemetry.profiler.ConfigurationLogger -                splunk.profiler.directory : /tmp
[otel.javaagent 2024-02-15 09:42:07:505 +0000] [main] INFO com.splunk.opentelemetry.profiler.ConfigurationLogger -       splunk.profiler.recording.duration : 20s
[otel.javaagent 2024-02-15 09:42:07:506 +0000] [main] INFO com.splunk.opentelemetry.profiler.ConfigurationLogger -               splunk.profiler.keep-files : false
[otel.javaagent 2024-02-15 09:42:07:510 +0000] [main] INFO com.splunk.opentelemetry.profiler.ConfigurationLogger -            splunk.profiler.logs-endpoint : http://10.13.2.38:4317
[otel.javaagent 2024-02-15 09:42:07:513 +0000] [main] INFO com.splunk.opentelemetry.profiler.ConfigurationLogger -              otel.exporter.otlp.endpoint : http://10.13.2.38:4317
[otel.javaagent 2024-02-15 09:42:07:513 +0000] [main] INFO com.splunk.opentelemetry.profiler.ConfigurationLogger -           splunk.profiler.memory.enabled : true
[otel.javaagent 2024-02-15 09:42:07:515 +0000] [main] INFO com.splunk.opentelemetry.profiler.ConfigurationLogger -             splunk.profiler.tlab.enabled : true
[otel.javaagent 2024-02-15 09:42:07:516 +0000] [main] INFO com.splunk.opentelemetry.profiler.ConfigurationLogger -        splunk.profiler.memory.event.rate : 150/s
[otel.javaagent 2024-02-15 09:42:07:516 +0000] [main] INFO com.splunk.opentelemetry.profiler.ConfigurationLogger -      splunk.profiler.call.stack.interval : PT0.15S
[otel.javaagent 2024-02-15 09:42:07:517 +0000] [main] INFO com.splunk.opentelemetry.profiler.ConfigurationLogger -  splunk.profiler.include.internal.stacks : false
[otel.javaagent 2024-02-15 09:42:07:517 +0000] [main] INFO com.splunk.opentelemetry.profiler.ConfigurationLogger -      splunk.profiler.tracing.stacks.only : false
[otel.javaagent 2024-02-15 09:42:07:517 +0000] [main] INFO com.splunk.opentelemetry.profiler.ConfigurationLogger - -----------------------
[otel.javaagent 2024-02-15 09:42:07:518 +0000] [main] INFO com.splunk.opentelemetry.profiler.JfrActivator - Profiler is active.
We are interested in the section written by the com.splunk.opentelemetry.profiler.ConfigurationLogger or the Profiling Configuration.
We can see the various settings you can control, some that are useful depending on your use case like the splunk.profiler.directory - The location where the agent writes the call stacks before sending them to Splunk. This may be different depending on how you configure your containers.
Another parameter you may want to change is splunk.profiler.call.stack.interval This is how often the system takes a CPU Stack trace. You may want to reduce this if you have short spans like we have in our application. (we kept the default as the spans in this demo application are extremely short, so Span may not always have a CPU Call Stack related to it.)
You can find how to set these parameters here. Below, is how you set a higher collection rate for call stack in your deployment.yaml, exactly how to pass any JAVA option to the Java application running in your container:
If you don’t see those lines as a result of the script, the startup may have taken too long and generated too many connection errors, try looking at the logs directly with kubectl or the k9s utility that is installed.
Always-On Profiling in the Trace Waterfall
Make sure you have your original (or similar) Trace & Span (1) selected in the APM Waterfall view and select Memory Stack Traces (2) from the right-hand pane:
The pane should show you the Memory Stack Trace Flame Graph (3), you can scroll down and/or make the pane for a better view by dragging the right side of the pane.
As AlwaysOn Profiling is constantly taking snapshots, or stack traces, of your application’s code and reading through thousands of stack traces is not practical, AlwaysOn Profiling aggregates and summarizes profiling data, providing a convenient way to explore Call Stacks in a view called the Flame Graph. It represents a summary of all stack traces captured from your application. You can use the Flame Graph to discover which lines of code might be causing performance issues and to confirm whether the changes you make to the code have the intended effect.
To dive deeper into the Always-on Profiling, select Span (3) in the Profiling Pane under Memory Stack Traces
This will bring you to the Always-on Profiling main screen, with the Memory view pre-selected:
Time filter will be set to the time frame of the span we selected (1)
Java Memory Metric Charts (2), Allow you to Monitor Heap Memory, Application Activity like Memory Allocation Rate and Garbage Collecting Metrics.
Ability to focus/see metrics and Stack Traces only related to the Span (3), This will filter out background activities running in the Java application if required.
Java Function calls identified. (4), allowing you to drill down into the Methods called from that function.
The Flame Graph (5), with the visualization of hierarchy based on the stack traces of the profiled service.
Ability to select the Service instance (6) in case the service spins up multiple version of it self.
For further investigation the UI let’s you grab the actual stack trace, by selecting a function and the relevant line from the flam chart, so you can use in your coding platform to go to the actual lines of code used at this point (depending of course on your preferred Coding platform)
Database Query Performance
With Database Query Performance, you can monitor the impact of your database queries on service availability directly in Splunk APM. This way, you can quickly identify long-running, un-optimized, or heavy queries and mitigate issues they might be causing, without having to instrument your databases.
To look at the performance of your database queries, make sure you are on the APM Service Map page either by going back in the browser or navigating to the APM section in the Menu bar, then click on the Service Map tile.
Select the inferred database service mysql:petclinic Inferred Database server in the Dependency map (1), then scroll the right-hand pane to find the Database Query Performance Pane (2).
If the service you have selected in the map is indeed an (inferred) database server, this pane will populate with the top 90% (P90) database calls based on duration. To dive deeper into the db-query performance function click somewhere on the word Database Query Performance at the top of the pane.
This will bring us to the DB-query Performance overview screen:
Database Query Normalization
By default, Splunk APM instrumentation sanitizes database queries to remove or mask sensible data, such as secrets or personally identifiable information (PII) from the db.statements. You can find how to turn off database query normalization here.
This screen will show us all the Database queries (1) done towards our database from your application, based on the Traces & Spans sent to the Splunk Observability Cloud. Note that you can compare them across a time block or sort them on Total Time, P90 Latency & Requests (2).
For each Database query in the list, we see the highest latency, the total number of calls during the time window and the number of requests per second (3). This allows you to identify places where you might optimize your queries.
You can select traces containing Database Calls via the two charts in the right-hand pane (5). Use the Tag Spotlight pane (6) to drill down what tags are related to the database calls, based on endpoints or tags.
If you need to see a detailed view of a query:
Click on the specific Query (1), this wil give you a detailed query Details pane (2), which you can use for more detailed investigations:
Log Observer
10 minutes
Up until this point, there have been no code changes, yet tracing, profiling and Database Query Performance data is being sent to Splunk Observability Cloud.
Next we will work with the Splunk Log Observer to the mix to obtain log data from the Spring PetClinic application.
The Splunk OpenTelemetry Collector automatically collects logs from the Spring PetClinic application and sends them to Splunk Observability Cloud using the OTLP exporter, annotating the log events with trace_id, span_id and trace flags.
The Splunk Log Observer is then used to view the logs and with the changes to the log format the platform can automatically correlate log information with services and traces.
In the bottom pane is where any related content will be reported. In the screenshot below you can see that APM has found a trace that is related to this log line (1):
By clicking (2) on Trace for 960432ac9f16b98be84618778905af50 we will be taken to the waterfall in APM for this specific trace, where this log line was generated:
Note that you now have a Related Content pane for Logs appear (1). Clicking on this will take you back to Log Observer and will display all the log lines that are part of this trace.
Real User Monitoring
10 minutes
To enable Real User Monitoring (RUM) instrumentation for an application, you need to add the Open Telemetry Javascript https://github.com/signalfx/splunk-otel-js-web snippet to the code base.
The Spring PetClinic application uses a single index HTML page, that is reused across all views of the application. This is the perfect location to insert the Splunk RUM instrumentation library as it will be loaded for all pages automatically.
The api-gateway service is already running the instrumentation and sending RUM traces to Splunk Observability Cloud and we will review the data in the next section.
If you want you can verify the snippet, you can view the page source in your browser by right-clicking on the page and selecting View Page Source.
<scriptsrc="/env.js"></script><scriptsrc="https://cdn.signalfx.com/o11y-gdi-rum/latest/splunk-otel-web.js"crossorigin="anonymous"></script><scriptsrc="https://cdn.signalfx.com/o11y-gdi-rum/latest/splunk-otel-web-session-recorder.js"crossorigin="anonymous"></script><script>varrealm=env.RUM_REALM;console.log('Realm:',realm);varauth=env.RUM_AUTH;varappName=env.RUM_APP_NAME;varenvironmentName=env.RUM_ENVIRONMENTif(realm&&auth){SplunkRum.init({realm:realm,rumAccessToken:auth,applicationName:appName,deploymentEnvironment:environmentName,version:'1.0.0',});SplunkSessionRecorder.init({app:appName,realm:realm,rumAccessToken:auth});constProvider=SplunkRum.provider;vartracer=Provider.getTracer('appModuleLoader');}else{// Realm or auth is empty, provide default values or skip initialization
console.log("Realm or auth is empty. Skipping Splunk Rum initialization.");}</script><!-- Section added for RUM -->
Subsections of 8. Real User Monitoring
Select the RUM view for the Petclinic App
Lets start a quick high level tour into RUM by clicking RUM in the left-hand menu. Then change the Environment filter (1) to the name of your workshop instance from the dropdown box, it will be <INSTANCE>-workshop(1) (where INSTANCE is the value from the shell script you ran earlier). Make sure it is the only one selected.
Then change the App(2) dropdown box to the name of your app, it will be <INSTANCE>-store
Once you have selected your Environment and App, you will see an overview page showing the RUM status of your App (if your Summary Dashboard is just a single row of numbers, you are looking at the condensed view. You can expand it by clicking on the > (1) in front of the Application name). If any JavaScript error occurred they will show up as shown below:
To continue, click on the blue link (with your workshop name) to get to the details page, this will bring up a new dashboard view breaking down the interactions by UX Metrics, Front-end Health, Back-end Health and Custom Events and comparing them to historic metrics (1 hour by default).
Normally you have only one line inside the first chart, Click on the link that relates to your Petclinic shop,
http://198.19.249.202:81 in our example:
This will bring us to the Tag Spotlight page.
RUM trace Waterfall view & linking to APM
In the TAG Spotlight view, you are presented with all the tags associated with the RUM data. Tags are key-value pairs that are used to identify the data. In this case, the tags are automatically generated by the OpenTelemetry instrumentation. The tags are used to filter the data and to create the charts and tables. The Tag Spotlight view allows you detect trends in behavior and to drill down into a user session.
Click on User Sessions (1), this will show you the list of user session that occurred during the time window.
We want to look at one of the session , so click on Duration(2) to sort on duration, and make sure you click on the link of one of the longer ones (3):
RUM trace Waterfall view & linking to APM
We are now looking at the RUM Trace waterfall, this will tell you what happened during the session on the user device as they visited the page of our petclinic application.
If you scroll down the waterfall find click on the #!/owners/details segment on the right (1), you see a list of action that occurred during the handling of the Vets request. Note, that the HTTP request have a blue APM link before the return code. Pick one, and click on the APM link. This will show you the APM info for this Ser vice call to our Microservices in Kubernetes.
Note , that there give you the information what happened during action in the Microservices, and if you want to drill down to verify what happened with the request, click on the Trace ID url.
This will show you the trace related to your request from RUM:
You can see that the entry point into your service now has a RUM (1) related content link added, allowing you to return back to your RUM session after you validated what happened in your Microservices.
Workshop Wrap-up 🎁
Congratulations, you have completed the Get the Most Out of Your Existing Kubernetes Java Applications Using Automatic Discovery and Configuration With OpenTelemetry workshop.
Today, you have learnt how easy it is to add Tracing, Code Profiling and Database Query Performance to your existing Java application in Kubernetes.
You immediately improved the observability of the application and infrastructure with out touching a line of code or configuration using Automatic Discovery and Configuration.
You also learnt that with simple configuration changes you can add even more observability (logging and RUM) to the application in order to provide end-to-end observability.
Monitoring Horizontal Pod Autoscaling in Kubernetes
45 minutesAuthor
Robert Castley
This workshop will equip you with a basic understanding of monitoring Kubernetes using the Splunk OpenTelemetry Collector. During the workshop, you will deploy PHP/Apache and a load generator.
You will learn about OpenTelemetry Receivers, Kubernetes Namespaces, ReplicaSets, Kubernetes Horizontal Pod AutoScaling and how to monitor all this using the Splunk Observability Cloud. The main learnings from the workshop will be a better understanding of the Kubernetes Navigator (and Dashboards) in Splunk Observability Cloud as well as seeing Kubernetes metrics, events and Detectors.
For this workshop, Splunk has prepared an Ubuntu Linux instance in AWS/EC2 all pre-configured for you.
To get access to the instance that you will be using in the workshop, please visit the URL provided by the workshop leader.
Subsections of Horizontal Pod Autoscaling
Deploying the OpenTelemetry Collector in Kubernetes
1. Connect to EC2 instance
You will be able to connect to the workshop instance by using SSH from your Mac, Linux or Windows device. Open the link to the sheet provided by your instructor. This sheet contains the IP addresses and the password for the workshop instances.
Info
Your workshop instance has been pre-configured with the correct Access Token and Realm for this workshop. There is no need for you to configure these.
2. Install Splunk OTel using Helm
Install the OpenTelemetry Collector using the Splunk Helm chart. First, add the Splunk Helm chart repository and update:
Using ACCESS_TOKEN=<REDACTED>
Using REALM=eu0
"splunk-otel-collector-chart" has been added to your repositories
Using ACCESS_TOKEN=<REDACTED>
Using REALM=eu0
Hang tight while we grab the latest from your chart repositories...
...Successfully got an update from the "splunk-otel-collector-chart" chart repository
Update Complete. ⎈Happy Helming!⎈
Install the OpenTelemetry Collector Helm with the following commands, do NOT edit this:
You can monitor the progress of the deployment by running kubectl get pods which should typically report that the new pods are up and running after about 30 seconds.
Ensure the status is reported as Running before continuing.
kubectl get pods
NAME                                                          READY   STATUS    RESTARTS   AGE
splunk-otel-collector-agent-pvstb                             2/2     Running   0          19s
splunk-otel-collector-k8s-cluster-receiver-6c454894f8-mqs8n   1/1     Running   0          19s
Use the label set by the helm install to tail logs (You will need to press ctrl + c to exit).
If you make an error installing the Splunk OpenTelemetry Collector you can start over by deleting the installation using:
helm delete splunk-otel-collector
Tour of the Kubernetes Navigator
1. Cluster vs Workload View
The Kubernetes Navigator offers you two separate use cases to view your Kubernetes data.
The K8s workloads are focusing on providing information in regards to workloads a.k.a. your deployments.
The K8s nodes are focusing on providing insight into the performance of clusters, nodes, pods and containers.
You will initially select either view depending on your need (you can switch between the view on the fly if required). The most common one we will use in this workshop is the workload view and we will focus on that specifically.
1.1 Finding your K8s Cluster Name
Your first task is to identify and find your cluster. The cluster will be named as determined by the preconfigured environment variable INSTANCE. To confirm the cluster name enter the following command in your terminal:
echo$INSTANCE-k3s-cluster
Please make a note of your cluster name as you will need this later in the workshop for filtering.
2. Workloads & Workload Details Pane
Go to the Infrastructure page in the Observability UI and select Kubernetes, this will offer you a set of Kubernetes services, one of them being the Kubernetes workloads pane. The pane will show a tiny graph giving you a bird’s eye view of the load being handled across all workloads. Click on the Kubernetes workloads pane and you will be taken to the workload view.
Initially, you will see all the workloads for all clusters that are reported into your Observability Cloud Org. If an alert has fired for any of the workloads, it will be highlighted on the top right in the image below.
Now, let’s find your cluster by filtering on Cluster in the filter toolbar.
Note
You can enter a partial name into the search box, such as emea-ws-7*, to quickly find your Cluster.
Also, it’s a very good idea to switch the default time from the default -4h back to the last 15 minutes (-15m).
You will now just see data just for your own cluster.
Workshop Question
How many workloads are running & how many namespaces are in your Cluster?
2.1 Using the Navigator Selection Chart
By default, the Kubernetes Workloads table filters by # Pods Failed grouped by k8s.namespace.name. Go ahead and expand the default namespace to see the workloads in the namespace.
Now, let’s change the list view to a heatmap view by selecting Map icon (next to the Table icon). Changing this option will result in the following visualization (or similar):
In this view, you will note that each workload is now a colored square. These squares will change color according to the Color by option you select. The colors give a visual indication of health and/or usage. You can check the meaning by hovering over the legend exclamation icon bottom right of the heatmaps.
Another valuable option in this screen is Find outliers which provides historical analytics of your clusters based on what is selected in the Color by dropdown.
Now, let’s select the Network transferred (bytes) from the Color by drop-down box, then click on the Find outliers and change the Scope in the dialog to Per k8s.namespace.name and Deviation from Median as below:
The Find Outliers view is very useful when you need to view a selection of your workloads (or any service depending on the Navigator used) and quickly need to figure out if something has changed.
It will give you fast insight into items (workloads in our case) that are performing differently (both increased or decreased) which helps to make it easier to spot problems.
2.2 The Deployment Overview pane
The Deployment Overview pane gives you a quick insight into the status of your deployments. You can see at once if the pods of your deployments are Pending, Running, Succeeded, Failed or in an Unknown state.
Running: Pod is deployed and in a running state
Pending: Waiting to be deployed
Succeeded: Pod has been deployed and completed its job and is finished
Failed: Containers in the pod have run and returned some kind of error
Unknown: Kubernetes isn’t reporting any of the known states. (This may be during the starting or stopping of pods, for example).
You can expand the Workload name by hovering your mouse on it, in case the name is longer than the chart allows.
To filter to a specific workload, you can click on three dots … next to the workload name in the k8s.workload.name column and choose Filter from the dropdown box:
This will add the selected workload to your filters. It would then list a single workload in the default namespace:
From the Heatmap above find the splunk-otel-collector-k8s-cluster-receiver in the default namespace and click on the square to see more information about the workload:
Workshop Question
What are the CPU request & CPU limit units for the otel-collector?
At this point, you can drill into the information of the pods, but that is outside the scope of this workshop.
3. Navigator Sidebar
Later in the workshop, you will deploy an Apache server into your cluster which will display an icon in the Navigator Sidebar.
In navigators for Kubernetes, you can track dependent services and containers in the navigator sidebar. To get the most out of the navigator sidebar you configure the services you want to track by configuring an extra dimension called service.name. For this workshop, we have already configured the extraDimensions in the collector configuration for monitoring Apache e.g.
extraDimensions:service.name:php-apache
The Navigator Sidebar will expand and a link to the discovered service will be added as seen in the image below:
This will allow for easy switching between Navigators. The same applies to your Apache server instance, it will have a Navigator Sidebar allowing you to quickly jump back to the Kubernetes Navigator.
Deploying PHP/Apache
1. Namespaces in Kubernetes
Most of our customers will make use of some kind of private or public cloud service to run Kubernetes. They often choose to have only a few large Kubernetes clusters as it is easier to manage centrally.
Namespaces are a way to organize these large Kubernetes clusters into virtual sub-clusters. This can be helpful when different teams or projects share a Kubernetes cluster as this will give them the easy ability to just see and work with their resources.
Any number of namespaces are supported within a cluster, each logically separated from others but with the ability to communicate with each other. Components are only visible when selecting a namespace or when adding the --all-namespaces flag to kubectl instead of allowing you to view just the components relevant to your project by selecting your namespace.
Most customers will want to install the applications into a separate namespace. This workshop will follow that best practice.
2. DNS and Services in Kubernetes
The Domain Name System (DNS) is a mechanism for linking various sorts of information with easy-to-remember names, such as IP addresses. Using a DNS system to translate request names into IP addresses makes it easy for end-users to reach their target domain name effortlessly.
Most Kubernetes clusters include an internal DNS service configured by default to offer a lightweight approach for service discovery. Even when Pods and Services are created, deleted, or shifted between nodes, built-in service discovery simplifies applications to identify and communicate with services on the Kubernetes clusters.
In short, the DNS system for Kubernetes will create a DNS entry for each Pod and Service. In general, a Pod has the following DNS resolution:
pod-name.my-namespace.pod.cluster-domain.example
For example, if a Pod in the default namespace has the Pod name my_pod, and the domain name for your cluster is cluster.local, then the Pod has a DNS name:
my_pod.default.pod.cluster.local
Any Pods exposed by a Service have the following DNS resolution available:
The above file contains an observation rule for Apache using the OTel receiver_creator. This receiver can instantiate other receivers at runtime based on whether observed endpoints match a configured rule.
The configured rules will be evaluated for each endpoint discovered. If the rule evaluates to true, then the receiver for that rule will be started as configured against the matched endpoint.
In the file above we tell the OpenTelemetry agent to look for Pods that match the name apache and have port 80 open. Once found, the agent will configure an Apache receiver to read Apache metrics from the configured URL. Note, the K8s DNS-based URL in the above YAML for the service.
To use the Apache configuration, you can upgrade the existing Splunk OpenTelemetry Collector Helm chart to use the otel-apache.yaml file with the following command:
The REVISION number of the deployment has changed, which is a helpful way to keep track of your changes.
Release "splunk-otel-collector" has been upgraded. Happy Helming!
NAME: splunk-otel-collector
LAST DEPLOYED: Mon Nov  4 14:56:25 2024
NAMESPACE: default
STATUS: deployed
REVISION: 2
TEST SUITE: None
NOTES:
Splunk OpenTelemetry Collector is installed and configured to send data to Splunk Platform endpoint "https://http-inputs-workshop.splunkcloud.com:443/services/collector/event".

Splunk OpenTelemetry Collector is installed and configured to send data to Splunk Observability realm eu0.
5. Kubernetes ConfigMaps
A ConfigMap is an object in Kubernetes consisting of key-value pairs that can be injected into your application. With a ConfigMap, you can separate configuration from your Pods.
Using ConfigMap, you can prevent hardcoding configuration data. ConfigMaps are useful for storing and sharing non-sensitive, unencrypted configuration information.
The OpenTelemetry collector/agent uses ConfigMaps to store the configuration of the agent and the K8s Cluster receiver. You can/will always verify the current configuration of an agent after a change by running the following commands:
kubectl get cm
Workshop Question
How many ConfigMaps are used by the collector?
When you have a list of ConfigMaps from the namespace, select the one for the otel-agent and view it with the following command:
kubectl get cm splunk-otel-collector-otel-agent -o yaml
NOTE
The option -o yaml will output the content of the ConfigMap in a readable YAML format.
Workshop Question
Is the configuration from otel-apache.yaml visible in the ConfigMap for the collector agent?
6. Review PHP/Apache deployment YAML
Inspect the YAML file ~/workshop/k3s/php-apache.yaml and validate the contents using the following command:
cat ~/workshop/k3s/php-apache.yaml
This file contains the configuration for the PHP/Apache deployment and will create a new StatefulSet with a single replica of the PHP/Apache image.
A stateless application does not care which network it is using, and it does not need permanent storage. Examples of stateless apps may include web servers such as Apache, Nginx, or Tomcat.
What metrics for your Apache instance are being reported in the Apache Navigator?
Tip: Use the Navigator Sidebar and click on the service name.
Workshop Question
Using Log Observer what is the issue with the PHP/Apache deployment?
Tip: Adjust your filters to use: object = php-apache-svc and k8s.cluster.name = <your_cluster>.
Fix PHP/Apache Issue
1. Kubernetes Resources
Especially in Production Kubernetes Clusters, CPU and Memory are considered precious resources. Cluster Operators will normally require you to specify the amount of CPU and Memory your Pod or Service will require in the deployment, so they can have the Cluster automatically manage on which Node(s) your solution will be placed.
You do this by placing a Resource section in the deployment of your application/Pod
Example:
resources:limits:# Maximum amount of CPU & memory for peek usecpu:"8"# Maximum of 8 cores of CPU allowed at for peek usememory:"8Mi"# Maximum allowed 8Mb of memoryrequests:# Request are the expected amount of CPU & memory for normal usecpu:"6"# Requesting 4 cores of a CPUmemory:"4Mi"# Requesting 4Mb of memory
If your application or Pod will go over the limits set in your deployment, Kubernetes will kill and restart your Pod to protect the other applications on the Cluster.
Another scenario that you will run into is when there is not enough Memory or CPU on a Node. In that case, the Cluster will try to reschedule your Pod(s) on a different Node with more space.
If that fails, or if there is not enough space when you deploy your application, the Cluster will put your workload/deployment in schedule mode until there is enough room on any of the available Nodes to deploy the Pods according to their limits.
2. Fix PHP/Apache Deployment
Workshop Question
Before we start, let’s check the current status of the PHP/Apache deployment. Under Alerts & Detectors which detector has fired? Where else can you find this information?
To fix the PHP/Apache StatefulSet, edit ~/workshop/k3s/php-apache.yaml using the following commands to reduce the CPU resources:
vim ~/workshop/k3s/php-apache.yaml
Find the resources section and reduce the CPU limits to 1 and the CPU requests to 0.5:
Save the changes you have made. (Hint: Use Esc followed by :wq! to save your changes).
Now, we must delete the existing StatefulSet and re-create it. StatefulSets are immutable, so we must delete the existing one and re-create it with the new changes.
You can validate the changes have been applied by running the following command:
kubectl describe statefulset php-apache -n apache
Validate the Pod is now running in Splunk Observability Cloud.
Workshop Question
Is the Apache Web Servers dashboard showing any data now?
Tip: Don’t forget to use filters and time frames to narrow down your data.
Monitor the Apache web servers Navigator dashboard for a few minutes.
Workshop Question
What is happening with the # Hosts reporting chart?
4. Fix the memory issue
If you navigate back to the Apache dashboard, you will notice that metrics are no longer coming in. We have another resource issue and this time we are Out of Memory. Let’s edit the stateful set and increase the memory to what is shown in the image below:
kubectl edit will open the contents in the vi editor, use Esc followed by :wq! to save your changes.
Because StatefulSets are immutable, we must delete the existing Pod and let the StatefulSet re-create it with the new changes.
kubectl delete pod php-apache-0 -n apache
Validate the changes have been applied by running the following command:
kubectl describe statefulset php-apache -n apache
Deploy Load Generator
Now let’s apply some load against the php-apache pod. To do this, you will need to start a different Pod to act as a client. The container within the client Pod runs in an infinite loop, sending HTTP GETs to the php-apache service.
1. Review loadgen YAML
Inspect the YAML file ~/workshop/k3s/loadgen.yaml and validate the contents using the following command:
cat ~/workshop/k3s/loadgen.yaml
This file contains the configuration for the load generator and will create a new ReplicaSet with two replicas of the load generator image.
Once you have deployed the load generator, you can see the Pods running in the loadgen namespace. Use previous similar commands to check the status of the Pods from the command line.
Workshop Question
Which metrics in the Apache Navigator have now significantly increased?
4. Scale the load generator
A ReplicaSet is a process that runs multiple instances of a Pod and keeps the specified number of Pods constant. Its purpose is to maintain the specified number of Pod instances running in a cluster at any given time to prevent users from losing access to their application when a Pod fails or is inaccessible.
ReplicaSet helps bring up a new instance of a Pod when the existing one fails, scale it up when the running instances are not up to the specified number, and scale down or delete Pods if another instance with the same label is created. A ReplicaSet ensures that a specified number of Pod replicas are running continuously and helps with load-balancing in case of an increase in resource usage.
Let’s scale our ReplicaSet to 4 replicas using the following command:
Validate the replicas are running from both the command line and Splunk Observability Cloud:
kubectl get replicaset loadgen -n loadgen
Workshop Question
What impact can you see in the Apache Navigator?
Let the load generator run for around 2-3 minutes and keep observing the metrics in the Kubernetes Navigator and the Apache Navigator.
Setup Horizontal Pod Autoscaling (HPA)
In Kubernetes, a HorizontalPodAutoscaler automatically updates a workload resource (such as a Deployment or StatefulSet), to automatically scale the workload to match demand.
Horizontal scaling means that the response to increased load is to deploy more Pods. This is different from vertical scaling, which for Kubernetes would mean assigning more resources (for example: memory or CPU) to the Pods that are already running for the workload.
If the load decreases, and the number of Pods is above the configured minimum, the HorizontalPodAutoscaler instructs the workload resource (the Deployment, StatefulSet, or other similar resource) to scale back down.
1. Setup HPA
Inspect the ~/workshop/k3s/hpa.yaml file and validate the contents using the following command:
cat ~/workshop/k3s/hpa.yaml
This file contains the configuration for the Horizontal Pod Autoscaler and will create a new HPA for the php-apache deployment.
Once deployed, php-apache will autoscale when either the average CPU usage goes above 50% or the average memory usage for the deployment goes above 75%, with a minimum of 1 pod and a maximum of 4 pods.
kubectl apply -f ~/workshop/k3s/hpa.yaml
2. Validate HPA
kubectl get hpa -n apache
Go to the Workloads or Node Detail tab in Kubernetes and check the HPA deployment.
Workshop Question
How many additional php-apache-x pods have been created?
Workshop Question
Which metrics in the Apache Navigator have significantly increased again?
3. Increase the HPA replica count
Increase the maxReplicas to 8
kubectl edit hpa php-apache -n apache
Save the changes you have made. (Hint: Use Esc followed by :wq! to save your changes).
Workshop Questions
How many pods are now running?
How many are pending?
Why are they pending?
Congratulations! You have completed the workshop.
Making Your Observability Cloud Native With OpenTelemetry
1 hourAuthor
Robert Castley
Abstract
Organizations getting started with OpenTelemetry may begin by sending data directly to an observability backend. While this works well for initial testing, using the OpenTelemetry collector as part of your observability architecture provides numerous benefits and is recommended for any production deployment.
In this workshop, we will be focusing on using the OpenTelemetry collector and starting with the fundamentals of configuring the receivers, processors, and exporters ready to use with Splunk Observability Cloud. The journey will take attendees from novices to being able to start adding custom components to help solve for their business observability needs for their distributed platform.
Ninja Sections
Throughout the workshop there will be expandable Ninja Sections, these will be more hands on and go into further technical detail that you can explore within the workshop or in your own time.
Please note that the content in these sections may go out of date due to the frequent development being made to the OpenTelemetry project. Links will be provided in the event details are out of sync, please let us know if you spot something that needs updating.
Ninja: Test Me!
By completing this workshop you will officially be an OpenTelemetry Collector Ninja!
Target Audience
This interactive workshop is for developers and system administrators who are interested in learning more about architecture and deployment of the OpenTelemetry Collector.
Prerequisites
Attendees should have a basic understanding of data collection
Command line and vim/vi experience.
A instance/host/VM running Ubuntu 20.04 LTS or 22.04 LTS.
Minimum requirements are an AWS/EC2 t2.micro (1 CPU, 1GB RAM, 8GB Storage)
Learning Objectives
By the end of this talk, attendees will be able to:
Understand the components of OpenTelemetry
Use receivers, processors, and exporters to collect and analyze data
Identify the benefits of using OpenTelemetry
Build a custom component to solve their business needs
Download the OpenTelemetry Collector Contrib distribution
The first step in installing the Open Telemetry Collector is downloading it. For our lab, we will use the wget command to download the .deb package from the OpenTelemetry Github repository.
Selecting previously unselected package otelcol-contrib.
(Reading database ... 89232 files and directories currently installed.)
Preparing to unpack otelcol-contrib_0.111.0_linux_amd64.deb ...
Unpacking otelcol-contrib (0.111.0) ...
Setting up otelcol-contrib (0.111.0) ...
Created symlink /etc/systemd/system/multi-user.target.wants/otelcol-contrib.service → /lib/systemd/system/otelcol-contrib.service.
Subsections of 1. Installation
Installing OpenTelemetry Collector Contrib
Confirm the Collector is running
The collector should now be running. We will verify this as root using systemctl command. To exit the status just press q.
sudo systemctl status otelcol-contrib
● otelcol-contrib.service - OpenTelemetry Collector Contrib
     Loaded: loaded (/lib/systemd/system/otelcol-contrib.service; enabled; vendor preset: enabled)
     Active: active (running) since Mon 2024-10-07 10:27:49 BST; 52s ago
   Main PID: 17113 (otelcol-contrib)
      Tasks: 13 (limit: 19238)
     Memory: 34.8M
        CPU: 155ms
     CGroup: /system.slice/otelcol-contrib.service
             └─17113 /usr/bin/otelcol-contrib --config=/etc/otelcol-contrib/config.yaml

Oct 07 10:28:36 petclinic-rum-testing otelcol-contrib[17113]: Descriptor:
Oct 07 10:28:36 petclinic-rum-testing otelcol-contrib[17113]:      -> Name: up
Oct 07 10:28:36 petclinic-rum-testing otelcol-contrib[17113]:      -> Description: The scraping was successful
Oct 07 10:28:36 petclinic-rum-testing otelcol-contrib[17113]:      -> Unit:
Oct 07 10:28:36 petclinic-rum-testing otelcol-contrib[17113]:      -> DataType: Gauge
Oct 07 10:28:36 petclinic-rum-testing otelcol-contrib[17113]: NumberDataPoints #0
Oct 07 10:28:36 petclinic-rum-testing otelcol-contrib[17113]: StartTimestamp: 1970-01-01 00:00:00 +0000 UTC
Oct 07 10:28:36 petclinic-rum-testing otelcol-contrib[17113]: Timestamp: 2024-10-07 09:28:36.942 +0000 UTC
Oct 07 10:28:36 petclinic-rum-testing otelcol-contrib[17113]: Value: 1.000000
Oct 07 10:28:36 petclinic-rum-testing otelcol-contrib[17113]:         {"kind": "exporter", "data_type": "metrics", "name": "debug"}
Because we will be making multiple configuration file changes, setting environment variables and restarting the collector, we need to stop the collector service and disable it from starting on boot.
An alternative approach would be to use the golang tool chain to build the binary locally by doing:
go install go.opentelemetry.io/collector/cmd/builder@v0.80.0
mv $(go env GOPATH)/bin/builder /usr/bin/ocb
(Optional) Docker
Why build your own collector?
The default distribution of the collector (core and contrib) either contains too much or too little in what they have to offer.
It is also not advised to run the contrib collector in your production environments due to the amount of components installed which more than likely are not needed by your deployment.
Benefits of building your own collector?
When creating your own collector binaries, (commonly referred to as distribution), means you build what you need.
The benefits of this are:
Smaller sized binaries
Can use existing go scanners for vulnerabilities
Include internal components that can tie in with your organization
Considerations for building your collector?
Now, this would not be a 🥷 Ninja zone if it didn’t come with some drawbacks:
Go experience is recommended if not required
No Splunk support
Responsibility for distribution and lifecycle management
It is important to note that the project is working towards stability but it does not mean changes made will not break your workflow. The team at Splunk provides increased support and a higher level of stability so they can provide a curated experience helping you with your deployment needs.
The Ninja Zone
Once you have all the required tools installed to get started, you will need to create a new file named otelcol-builder.yaml and we will follow this directory structure:
.
└── otelcol-builder.yaml
Once we have the file created, we need to add a list of components for it to install with some additional metadata.
For this example, we are going to create a builder manifest that will install only the components we need for the introduction config:
OpenTelemetry is configured through YAML files. These files have default configurations that we can modify to meet our needs. Let’s look at the default configuration that is supplied:
# To limit exposure to denial of service attacks, change the host in endpoints below from 0.0.0.0 to a specific network interface.# See https://github.com/open-telemetry/opentelemetry-collector/blob/main/docs/security-best-practices.md#safeguards-against-denial-of-service-attacksextensions:health_check:pprof:endpoint:0.0.0.0:1777zpages:endpoint:0.0.0.0:55679receivers:otlp:protocols:grpc:endpoint:0.0.0.0:4317http:endpoint:0.0.0.0:4318opencensus:endpoint:0.0.0.0:55678# Collect own metricsprometheus:config:scrape_configs:- job_name:'otel-collector'scrape_interval:10sstatic_configs:- targets:['0.0.0.0:8888']jaeger:protocols:grpc:endpoint:0.0.0.0:14250thrift_binary:endpoint:0.0.0.0:6832thrift_compact:endpoint:0.0.0.0:6831thrift_http:endpoint:0.0.0.0:14268zipkin:endpoint:0.0.0.0:9411processors:batch:exporters:debug:verbosity:detailedservice:pipelines:traces:receivers:[otlp, opencensus, jaeger, zipkin]processors:[batch]exporters:[debug]metrics:receivers:[otlp, opencensus, prometheus]processors:[batch]exporters:[debug]logs:receivers:[otlp]processors:[batch]exporters:[debug]extensions:[health_check, pprof, zpages]
Congratulations! You have successfully downloaded and installed the OpenTelemetry Collector. You are well on your way to becoming an OTel Ninja. But first let’s walk through configuration files and different distributions of the OpenTelemetry Collector.
Note
Splunk does provide its own, fully supported, distribution of the OpenTelemetry Collector. This distribution is available to install from the Splunk GitHub Repository or via a wizard in Splunk Observability Cloud that will build out a simple installation script to copy and paste. This distribution includes many additional features and enhancements that are not available in the OpenTelemetry Collector Contrib distribution.
The Splunk Distribution of the OpenTelemetry Collector is production-tested; it is in use by the majority of customers in their production environments.
Customers that use our distribution can receive direct help from official Splunk support within SLAs.
Customers can use or migrate to the Splunk Distribution of the OpenTelemetry Collector without worrying about future breaking changes to its core configuration experience for metrics and traces collection (OpenTelemetry logs collection configuration is in beta). There may be breaking changes to the Collector’s metrics.
We will now walk through each section of the configuration file and modify it to send host metrics to Splunk Observability Cloud.
OpenTelemetry Collector Extensions
Now that we have the OpenTelemetry Collector installed, let’s take a look at extensions for the OpenTelemetry Collector. Extensions are optional and available primarily for tasks that do not involve processing telemetry data. Examples of extensions include health monitoring, service discovery, and data forwarding.
Extensions are configured in the same config.yaml file that we referenced in the installation step. Let’s edit the config.yaml file and configure the extensions. Note that the pprof and zpages extensions are already configured in the default config.yaml file. For the purpose of this workshop, we will only be updating the health_check extension to expose the port on all network interfaces on which we can access the health of the collector.
This extension enables an HTTP URL that can be probed to check the status of the OpenTelemetry Collector. This extension can be used as a liveness and/or readiness probe on Kubernetes. To learn more about the curl command, check out the curl man page.
Open a new terminal session and SSH into your instance to run the following command:
Performance Profiler extension enables the golang net/http/pprof endpoint. This is typically used by developers to collect performance profiles and investigate issues with the service. We will not be covering this in this workshop.
OpenTelemetry Collector Extensions
zPages
zPages are an in-process alternative to external exporters. When included, they collect and aggregate tracing and metrics information in the background; this data is served on web pages when requested. zPages are an extremely useful diagnostic feature to ensure the collector is running as expected.
ServiceZ gives an overview of the collector services and quick access to the pipelinez, extensionz, and featurez zPages. The page also provides build and runtime information.
PipelineZ provides insights on the running pipelines running in the collector. You can find information on type, if data is mutated, and you can also see information on the receivers, processors and exporters that are used for each pipeline.
Ninja: Improve data durability with storage extension
For this, we will need to validate that our distribution has the file_storage extension installed. This can be done by running the command otelcol-contrib components which should show results like:
# ... truncated for clarityextensions:- file_storage
This extension provides exporters the ability to queue data to disk in the event that exporter is unable to send data to the configured endpoint.
In order to configure the extension, you will need to update your config to include the information below. First, be sure to create a /tmp/otel-data directory and give it read/write permissions:
extensions:...file_storage:directory:/tmp/otel-datatimeout:10scompaction:directory:/tmp/otel-dataon_start:trueon_rebound:truerebound_needed_threshold_mib:5rebound_trigger_threshold_mib:3# ... truncated for clarityservice:extensions:[health_check, pprof, zpages, file_storage]
Why queue data to disk?
This allows the collector to weather network interruptions (and even collector restarts) to ensure data is sent to the upstream provider.
Considerations for queuing data to disk?
There is a potential that this could impact data throughput performance due to disk performance.
# See https://github.com/open-telemetry/opentelemetry-collector/blob/main/docs/security-best-practices.md#safeguards-against-denial-of-service-attacksextensions:health_check:endpoint:0.0.0.0:13133pprof:endpoint:0.0.0.0:1777zpages:endpoint:0.0.0.0:55679receivers:otlp:protocols:grpc:endpoint:0.0.0.0:4317http:endpoint:0.0.0.0:4318opencensus:endpoint:0.0.0.0:55678# Collect own metricsprometheus:config:scrape_configs:- job_name:'otel-collector'scrape_interval:10sstatic_configs:- targets:['0.0.0.0:8888']jaeger:protocols:grpc:endpoint:0.0.0.0:14250thrift_binary:endpoint:0.0.0.0:6832thrift_compact:endpoint:0.0.0.0:6831thrift_http:endpoint:0.0.0.0:14268zipkin:endpoint:0.0.0.0:9411processors:batch:exporters:debug:verbosity:detailedservice:pipelines:traces:receivers:[otlp, opencensus, jaeger, zipkin]processors:[batch]exporters:[debug]metrics:receivers:[otlp, opencensus, prometheus]processors:[batch]exporters:[debug]logs:receivers:[otlp]processors:[batch]exporters:[debug]extensions:[health_check, pprof, zpages]
Now that we have reviewed extensions, let’s dive into the data pipeline portion of the workshop. A pipeline defines a path the data follows in the Collector starting from reception, moving to further processing or modification, and finally exiting the Collector via exporters.
The data pipeline in the OpenTelemetry Collector is made up of receivers, processors, and exporters. We will first start with receivers.
OpenTelemetry Collector Receivers
Welcome to the receiver portion of the workshop! This is the starting point of the data pipeline of the OpenTelemetry Collector. Let’s dive in.
A receiver, which can be push or pull based, is how data gets into the Collector. Receivers may support one or more data sources. Generally, a receiver accepts data in a specified format, translates it into the internal format and passes it to processors and exporters defined in the applicable pipelines.
The Host Metrics Receiver generates metrics about the host system scraped from various sources. This is intended to be used when the collector is deployed as an agent which is what we will be doing in this workshop.
Let’s update the /etc/otel-contrib/config.yaml file and configure the hostmetrics receiver. Insert the following YAML under the receivers section, taking care to indent by two spaces.
sudo vi /etc/otelcol-contrib/config.yaml
receivers:hostmetrics:collection_interval:10sscrapers:# CPU utilization metricscpu:# Disk I/O metricsdisk:# File System utilization metricsfilesystem:# Memory utilization metricsmemory:# Network interface I/O metrics & TCP connection metricsnetwork:# CPU load metricsload:# Paging/Swap space utilization and I/O metricspaging:# Process count metricsprocesses:# Per process CPU, Memory and Disk I/O metrics. Disabled by default.# process:
OpenTelemetry Collector Receivers
Prometheus Receiver
You will also notice another receiver called prometheus. Prometheus is an open-source toolkit used by the OpenTelemetry Collector. This receiver is used to scrape metrics from the OpenTelemetry Collector itself. These metrics can then be used to monitor the health of the collector.
Let’s modify the prometheus receiver to clearly show that it is for collecting metrics from the collector itself. By changing the name of the receiver from prometheus to prometheus/internal, it is now much clearer as to what that receiver is doing. Update the configuration file to look like this:
The following screenshot shows an example dashboard of some of the metrics the Prometheus internal receiver collects from the OpenTelemetry Collector. Here, we can see accepted and sent spans, metrics and log records.
Note
The following screenshot is an out-of-the-box (OOTB) dashboard from Splunk Observability Cloud that allows you to easily monitor your Splunk OpenTelemetry Collector install base.
OpenTelemetry Collector Receivers
Other Receivers
You will notice in the default configuration there are other receivers: otlp, opencensus, jaeger and zipkin. These are used to receive telemetry data from other sources. We will not be covering these receivers in this workshop and they can be left as they are.
Ninja: Create receivers dynamically
To help observe short lived tasks like docker containers, kubernetes pods, or ssh sessions, we can use the receiver creator with observer extensions to create a new receiver as these services start up.
What do we need?
In order to start using the receiver creator and its associated observer extensions, they will need to be part of your collector build manifest.
Some short lived tasks may require additional configuration such as username, and password.
These values can be referenced via environment variables,
or use a scheme expand syntax such as ${file:./path/to/database/password}.
Please adhere to your organisation’s secret practices when taking this route.
The Ninja Zone
There are only two things needed for this ninja zone:
Make sure you have added receiver creater and observer extensions to the builder manifest.
Create the config that can be used to match against discovered endpoints.
To create the templated configurations, you can do the following:
receiver_creator:watch_observers:[host_observer]receivers:redis:rule:type == "port" && port == 6379config:password:${env:HOST_REDIS_PASSWORD}
# To limit exposure to denial of service attacks, change the host in endpoints below from 0.0.0.0 to a specific network interface.# See https://github.com/open-telemetry/opentelemetry-collector/blob/main/docs/security-best-practices.md#safeguards-against-denial-of-service-attacksextensions:health_check:endpoint:0.0.0.0:13133pprof:endpoint:0.0.0.0:1777zpages:endpoint:0.0.0.0:55679receivers:hostmetrics:collection_interval:10sscrapers:# CPU utilization metricscpu:# Disk I/O metricsdisk:# File System utilization metricsfilesystem:# Memory utilization metricsmemory:# Network interface I/O metrics & TCP connection metricsnetwork:# CPU load metricsload:# Paging/Swap space utilization and I/O metricspaging:# Process count metricsprocesses:# Per process CPU, Memory and Disk I/O metrics. Disabled by default.# process:otlp:protocols:grpc:endpoint:0.0.0.0:4317http:endpoint:0.0.0.0:4318opencensus:endpoint:0.0.0.0:55678# Collect own metricsprometheus/internal:config:scrape_configs:- job_name:'otel-collector'scrape_interval:10sstatic_configs:- targets:['0.0.0.0:8888']jaeger:protocols:grpc:endpoint:0.0.0.0:14250thrift_binary:endpoint:0.0.0.0:6832thrift_compact:endpoint:0.0.0.0:6831thrift_http:endpoint:0.0.0.0:14268zipkin:endpoint:0.0.0.0:9411processors:batch:exporters:debug:verbosity:detailedservice:pipelines:traces:receivers:[otlp, opencensus, jaeger, zipkin]processors:[batch]exporters:[debug]metrics:receivers:[otlp, opencensus, prometheus]processors:[batch]exporters:[debug]logs:receivers:[otlp]processors:[batch]exporters:[debug]extensions:[health_check, pprof, zpages]
Now that we have reviewed how data gets into the OpenTelemetry Collector through receivers, let’s now take a look at how the Collector processes the received data.
Warning
As the /etc/otelcol-contrib/config.yaml is not complete, please do not attempt to restart the collector at this point.
OpenTelemetry Collector Processors
Processors are run on data between being received and being exported. Processors are optional though some are recommended. There are a large number of processors included in the OpenTelemetry contrib Collector.
By default, only the batch processor is enabled. This processor is used to batch up data before it is exported. This is useful for reducing the number of network calls made to exporters. For this workshop, we will inherit the following defaults which are hard-coded into the Collector:
send_batch_size (default = 8192): Number of spans, metric data points, or log records after which a batch will be sent regardless of the timeout. send_batch_size acts as a trigger and does not affect the size of the batch. If you need to enforce batch size limits sent to the next component in the pipeline see send_batch_max_size.
timeout (default = 200ms): Time duration after which a batch will be sent regardless of size. If set to zero, send_batch_size is ignored as data will be sent immediately, subject to only send_batch_max_size.
send_batch_max_size (default = 0): The upper limit of the batch size. 0 means no upper limit on the batch size. This property ensures that larger batches are split into smaller units. It must be greater than or equal to send_batch_size.
The resourcedetection processor can be used to detect resource information from the host and append or override the resource value in telemetry data with this information.
By default, the hostname is set to the FQDN if possible, otherwise, the hostname provided by the OS is used as a fallback. This logic can be changed from using using the hostname_sources configuration option. To avoid getting the FQDN and use the hostname provided by the OS, we will set the hostname_sources to os.
If the workshop instance is running on an AWS/EC2 instance we can gather the following tags from the EC2 metadata API (this is not available on other platforms).
cloud.provider ("aws")
cloud.platform ("aws_ec2")
cloud.account.id
cloud.region
cloud.availability_zone
host.id
host.image.id
host.name
host.type
We will create another processor to append these tags to our metrics.
The attributes processor modifies attributes of a span, log, or metric. This processor also supports the ability to filter and match input data to determine if they should be included or excluded for specified actions.
It takes a list of actions that are performed in the order specified in the config. The supported actions are:
insert: Inserts a new attribute in input data where the key does not already exist.
update: Updates an attribute in input data where the key does exist.
upsert: Performs insert or update. Inserts a new attribute in input data where the key does not already exist and updates an attribute in input data where the key does exist.
delete: Deletes an attribute from the input data.
hash: Hashes (SHA1) an existing attribute value.
extract: Extracts values using a regular expression rule from the input key to target keys specified in the rule. If a target key already exists, it will be overridden.
We are going to create an attributes processor to insert a new attribute to all our host metrics called participant.name with a value of your name e.g. marge_simpson.
Warning
Ensure you replace INSERT_YOUR_NAME_HERE with your name and also ensure you do not use spaces in your name.
Later on in the workshop, we will use this attribute to filter our metrics in Splunk Observability Cloud.
One of the most recent additions to the collector was the notion of a connector, which allows you to join the output of one pipeline to the input of another pipeline.
An example of how this is beneficial is that some services emit metrics based on the amount of datapoints being exported, the number of logs containing an error status,
or the amount of data being sent from one deployment environment. The count connector helps address this for you out of the box.
Why a connector instead of a processor?
A processor is limited in what additional data it can produce considering it has to pass on the data it has processed making it hard to expose additional information. Connectors do not have to emit the data they receive which means they provide an opportunity to create the insights we are after.
For example, a connector could be made to count the number of logs, metrics, and traces that do not have the deployment environment attribute.
A very simple example with the output of being able to break down data usage by deployment environment.
Considerations with connectors
A connector only accepts data exported from one pipeline and receiver by another pipeline, this means you may have to consider how you construct your collector config to take advantage of it.
# To limit exposure to denial of service attacks, change the host in endpoints below from 0.0.0.0 to a specific network interface.# See https://github.com/open-telemetry/opentelemetry-collector/blob/main/docs/security-best-practices.md#safeguards-against-denial-of-service-attacksextensions:health_check:endpoint:0.0.0.0:13133pprof:endpoint:0.0.0.0:1777zpages:endpoint:0.0.0.0:55679receivers:hostmetrics:collection_interval:10sscrapers:# CPU utilization metricscpu:# Disk I/O metricsdisk:# File System utilization metricsfilesystem:# Memory utilization metricsmemory:# Network interface I/O metrics & TCP connection metricsnetwork:# CPU load metricsload:# Paging/Swap space utilization and I/O metricspaging:# Process count metricsprocesses:# Per process CPU, Memory and Disk I/O metrics. Disabled by default.# process:otlp:protocols:grpc:endpoint:0.0.0.0:4317http:endpoint:0.0.0.0:4318opencensus:endpoint:0.0.0.0:55678# Collect own metricsprometheus/internal:config:scrape_configs:- job_name:'otel-collector'scrape_interval:10sstatic_configs:- targets:['0.0.0.0:8888']jaeger:protocols:grpc:endpoint:0.0.0.0:14250thrift_binary:endpoint:0.0.0.0:6832thrift_compact:endpoint:0.0.0.0:6831thrift_http:endpoint:0.0.0.0:14268zipkin:endpoint:0.0.0.0:9411processors:batch:resourcedetection/system:detectors:[system]system:hostname_sources:[os]resourcedetection/ec2:detectors:[ec2]attributes/conf:actions:- key:participant.nameaction:insertvalue:"INSERT_YOUR_NAME_HERE"exporters:debug:verbosity:detailedservice:pipelines:traces:receivers:[otlp, opencensus, jaeger, zipkin]processors:[batch]exporters:[debug]metrics:receivers:[otlp, opencensus, prometheus]processors:[batch]exporters:[debug]logs:receivers:[otlp]processors:[batch]exporters:[debug]extensions:[health_check, pprof, zpages]
OpenTelemetry Collector Exporters
An exporter, which can be push or pull-based, is how you send data to one or more backends/destinations. Exporters may support one or more data sources.
For this workshop, we will be using the otlphttp exporter. The OpenTelemetry Protocol (OTLP) is a vendor-neutral, standardised protocol for transmitting telemetry data. The OTLP exporter sends data to a server that implements the OTLP protocol. The OTLP exporter supports both gRPC and HTTP/JSON protocols.
To send metrics over HTTP to Splunk Observability Cloud, we will need to configure the otlphttp exporter.
Let’s edit our /etc/otelcol-contrib/config.yaml file and configure the otlphttp exporter. Insert the following YAML under the exporters section, taking care to indent by two spaces e.g.
We will also change the verbosity of the logging exporter to prevent the disk from filling up. The default of detailed is very noisy.
Next, we need to define the metrics_endpoint and configure the target URL.
Note
If you are an attendee at a Splunk-hosted workshop, the instance you are using has already been configured with a Realm environment variable. We will reference that environment variable in our configuration file. Otherwise, you will need to create a new environment variable and set the Realm e.g.
exportREALM="us1"
The URL to use is https://ingest.${env:REALM}.signalfx.com/v2/datapoint/otlp. (Splunk has Realms in key geographical locations around the world for data residency).
The otlphttp exporter can also be configured to send traces and logs by defining a target URL for traces_endpoint and logs_endpoint respectively. Configuring these is outside the scope of this workshop.
By default, gzip compression is enabled for all endpoints. This can be disabled by setting compression: none in the exporter configuration. We will leave compression enabled for this workshop and accept the default as this is the most efficient way to send data.
To send metrics to Splunk Observability Cloud, we need to use an Access Token. This can be done by creating a new token in the Splunk Observability Cloud UI. For more information on how to create a token, see Create a token. The token needs to be of type INGEST.
Note
If you are an attendee at a Splunk-hosted workshop, the instance you are using has already been configured with an Access Token (which has been set as an environment variable). We will reference that environment variable in our configuration file. Otherwise, you will need to create a new token and set it as an environment variable e.g.
exportACCESS_TOKEN=<replace-with-your-token>
The token is defined in the configuration file by inserting X-SF-TOKEN: ${env:ACCESS_TOKEN} under a headers: section:
# To limit exposure to denial of service attacks, change the host in endpoints below from 0.0.0.0 to a specific network interface.# See https://github.com/open-telemetry/opentelemetry-collector/blob/main/docs/security-best-practices.md#safeguards-against-denial-of-service-attacksextensions:health_check:endpoint:0.0.0.0:13133pprof:endpoint:0.0.0.0:1777zpages:endpoint:0.0.0.0:55679receivers:hostmetrics:collection_interval:10sscrapers:# CPU utilization metricscpu:# Disk I/O metricsdisk:# File System utilization metricsfilesystem:# Memory utilization metricsmemory:# Network interface I/O metrics & TCP connection metricsnetwork:# CPU load metricsload:# Paging/Swap space utilization and I/O metricspaging:# Process count metricsprocesses:# Per process CPU, Memory and Disk I/O metrics. Disabled by default.# process:otlp:protocols:grpc:endpoint:0.0.0.0:4317http:endpoint:0.0.0.0:4318opencensus:endpoint:0.0.0.0:55678# Collect own metricsprometheus/internal:config:scrape_configs:- job_name:'otel-collector'scrape_interval:10sstatic_configs:- targets:['0.0.0.0:8888']jaeger:protocols:grpc:endpoint:0.0.0.0:14250thrift_binary:endpoint:0.0.0.0:6832thrift_compact:endpoint:0.0.0.0:6831thrift_http:endpoint:0.0.0.0:14268zipkin:endpoint:0.0.0.0:9411processors:batch:resourcedetection/system:detectors:[system]system:hostname_sources:[os]resourcedetection/ec2:detectors:[ec2]attributes/conf:actions:- key:participant.nameaction:insertvalue:"INSERT_YOUR_NAME_HERE"exporters:debug:verbosity:normalotlphttp/splunk:metrics_endpoint:https://ingest.${env:REALM}.signalfx.com/v2/datapoint/otlpheaders:X-SF-Token:${env:ACCESS_TOKEN}service:pipelines:traces:receivers:[otlp, opencensus, jaeger, zipkin]processors:[batch]exporters:[debug]metrics:receivers:[otlp, opencensus, prometheus]processors:[batch]exporters:[debug]logs:receivers:[otlp]processors:[batch]exporters:[debug]extensions:[health_check, pprof, zpages]
Of course, you can easily configure the metrics_endpoint to point to any other solution that supports the OTLP protocol.
Next, we need to enable the receivers, processors and exporters we have just configured in the service section of the config.yaml.
OpenTelemetry Collector Service
The Service section is used to configure what components are enabled in the Collector based on the configuration found in the receivers, processors, exporters, and extensions sections.
Info
If a component is configured, but not defined within the Service section then it is not enabled.
The service section consists of three sub-sections:
extensions
pipelines
telemetry
In the default configuration, the extension section has been configured to enable health_check, pprof and zpages, which we configured in the Extensions module earlier.
service:extensions:[health_check, pprof, zpages]
So lets configure our Metric Pipeline!
Subsections of 6. Service
OpenTelemetry Collector Service
Hostmetrics Receiver
If you recall from the Receivers portion of the workshop, we defined the Host Metrics Receiver to generate metrics about the host system, which are scraped from various sources. To enable the receiver, we must include the hostmetrics receiver in the metrics pipeline.
In the metrics pipeline, add hostmetrics to the metrics receivers section.
Earlier in the workshop, we also renamed the prometheus receiver to reflect that is was collecting metrics internal to the collector, renaming it to prometheus/internal.
We now need to enable the prometheus/internal receiver under the metrics pipeline. Update the receivers section to include prometheus/internal under the metrics pipeline:
We also added resourcedetection/system and resourcedetection/ec2 processors so that the collector can capture the instance hostname and AWS/EC2 metadata. We now need to enable these two processors under the metrics pipeline.
Update the processors section to include resourcedetection/system and resourcedetection/ec2 under the metrics pipeline:
Also in the Processors section of this workshop, we added the attributes/conf processor so that the collector will insert a new attribute called participant.name to all the metrics. We now need to enable this under the metrics pipeline.
Update the processors section to include attributes/conf under the metrics pipeline:
In the Exporters section of the workshop, we configured the otlphttp exporter to send metrics to Splunk Observability Cloud. We now need to enable this under the metrics pipeline.
Update the exporters section to include otlphttp/splunk under the metrics pipeline:
The collector captures internal signals about its behavior this also includes additional signals from running components.
The reason for this is that components that make decisions about the flow of data need a way to surface that information
as metrics or traces.
Why monitor the collector?
This is somewhat of a chicken and egg problem of, “Who is watching the watcher?”, but it is important that we can surface this information. Another interesting part of the collector’s history is that it existed before the Go metrics’ SDK was considered stable so the collector exposes a Prometheus endpoint to provide this functionality for the time being.
Considerations
Monitoring the internal usage of each running collector in your organization can contribute a significant amount of new Metric Time Series (MTS). The Splunk distribution has curated these metrics for you and would be able to help forecast the expected increases.
The Ninja Zone
To expose the internal observability of the collector, some additional settings can be adjusted:
service:telemetry:logs:level:<info|warn|error>development:<true|false>encoding:<console|json>disable_caller:<true|false>disable_stacktrace:<true|false>output_paths:[<stdout|stderr>, paths...]error_output_paths:[<stdout|stderr>, paths...]initial_fields:key:valuemetrics:level:<none|basic|normal|detailed># Address binds the promethues endpoint to scrapeaddress:<hostname:port>
# To limit exposure to denial of service attacks, change the host in endpoints below from 0.0.0.0 to a specific network interface.# See https://github.com/open-telemetry/opentelemetry-collector/blob/main/docs/security-best-practices.md#safeguards-against-denial-of-service-attacksextensions:health_check:endpoint:0.0.0.0:13133pprof:endpoint:0.0.0.0:1777zpages:endpoint:0.0.0.0:55679receivers:hostmetrics:collection_interval:10sscrapers:# CPU utilization metricscpu:# Disk I/O metricsdisk:# File System utilization metricsfilesystem:# Memory utilization metricsmemory:# Network interface I/O metrics & TCP connection metricsnetwork:# CPU load metricsload:# Paging/Swap space utilization and I/O metricspaging:# Process count metricsprocesses:# Per process CPU, Memory and Disk I/O metrics. Disabled by default.# process:otlp:protocols:grpc:endpoint:0.0.0.0:4317http:endpoint:0.0.0.0:4318opencensus:endpoint:0.0.0.0:55678# Collect own metricsprometheus/internal:config:scrape_configs:- job_name:'otel-collector'scrape_interval:10sstatic_configs:- targets:['0.0.0.0:8888']jaeger:protocols:grpc:endpoint:0.0.0.0:14250thrift_binary:endpoint:0.0.0.0:6832thrift_compact:endpoint:0.0.0.0:6831thrift_http:endpoint:0.0.0.0:14268zipkin:endpoint:0.0.0.0:9411processors:batch:resourcedetection/system:detectors:[system]system:hostname_sources:[os]resourcedetection/ec2:detectors:[ec2]attributes/conf:actions:- key:participant.nameaction:insertvalue:"INSERT_YOUR_NAME_HERE"exporters:debug:verbosity:normalotlphttp/splunk:metrics_endpoint:https://ingest.${env:REALM}.signalfx.com/v2/datapoint/otlpheaders:X-SF-Token:${env:ACCESS_TOKEN}service:pipelines:traces:receivers:[otlp, opencensus, jaeger, zipkin]processors:[batch]exporters:[debug]metrics:receivers:[hostmetrics, otlp, opencensus, prometheus/internal]processors:[batch, resourcedetection/system, resourcedetection/ec2, attributes/conf]exporters:[debug, otlphttp/splunk]logs:receivers:[otlp]processors:[batch]exporters:[debug]extensions:[health_check, pprof, zpages]
Tip
It is recommended that you validate your configuration file before restarting the collector. You can do this by pasting the contents of your config.yaml file into otelbin.io.
ScreenshotOTelBin
Now that we have a working configuration, let’s start the collector and then check to see what zPages is reporting.
Now that we have configured the OpenTelemetry Collector to send metrics to Splunk Observability Cloud, let’s take a look at the data in Splunk Observability Cloud. If you have not received an invite to Splunk Observability Cloud, your instructor will provide you with login credentials.
Before that, let’s make things a little more interesting and run a stress test on the instance. This in turn will light up the dashboards.
Once you are logged into Splunk Observability Cloud, using the left-hand navigation, navigate to Dashboards from the main menu. This will take you to the Teams view. At the top of this view click on All Dashboards :
In the search box, search for OTel Contrib:
Info
If the dashboard does not exist, then your instructor will be able to quickly add it. If you are not attending a Splunk hosted version of this workshop then the Dashboard Group to import can be found at the bottom of this page.
Click on the OTel Contrib Dashboard dashboard to open it, next click in the Participant Name box, at the top of the dashboard, and select the name you configured for participant.name in the config.yaml in the drop-down list or start typing the name to search for it:
You can now see the host metrics for the host upon which you configured the OpenTelemetry Collector.
Building a component for the Open Telemetry Collector requires three key parts:
The Configuration - What values are exposed to the user to configure
The Factory - Make the component using the provided values
The Business Logic - What the component needs to do
For this, we will use the example of building a component that works with Jenkins so that we can track important DevOps metrics of our project(s).
The metrics we are looking to measure are:
Lead time for changes - “How long it takes for a commit to get into production”
Change failure rate - “The percentage of deployments causing a failure in production”
Deployment frequency - “How often a [team] successfully releases to production”
Mean time to recover - “How long does it take for a [team] to recover from a failure in production”
These indicators were identified Google’s DevOps Research and Assesment (DORA)[^1] team to help
show performance of a software development team. The reason for choosing Jenkins CI is that we remain in the same Open Source Software ecosystem which we can serve as the example for the vendor managed CI tools to adopt in future.
Instrument Vs Component
There is something to consider when improving level of Observability within your organisation
since there are some trade offs that get made.
Pros
Cons
(Auto) Instrumented
Does not require an external API to be monitored in order to observe the system.
Changing instrumentation requires changes to the project.
Gives system owners/developers to make changes in their observability.
Requires additional runtime dependancies.
Understands system context and can corrolate captured data with Exemplars.
Can impact performance of the system.
Component
- Changes to data names or semantics can be rolled out independently of the system’s release cycle.
Breaking API changes require a coordinated release between system and collector.
Updating/extending data collected is a seemless user facing change.
Captured data semantics can unexpectedly break that does not align with a new system release.
Does not require the supporting teams to have a deep understanding of observability practice.
Strictly external / exposed information can be surfaced from the system.
Subsections of 8. Develop
OpenTelemetry Collector Development
Project Setup Ninja
Note
The time to finish this section of the workshop can vary depending on experience.
A complete solution can be found here in case you’re stuck or want to follow
along with the instructor.
To get started developing the new Jenkins CI receiver, we first need to set up a Golang project.
The steps to create your new Golang project is:
Create a new directory named ${HOME}/go/src/jenkinscireceiver and change into it
The actual directory name or location is not strict, you can choose your own development directory to make it in.
Initialize the golang module by going go mod init splunk.conf/workshop/example/jenkinscireceiver
This will create a file named go.mod which is used to track our direct and indirect dependencies
Eventually, there will be a go.sum which is the checksum value of the dependencies being imported.
Check-inReview your go.mod
module splunk.conf/workshop/example/jenkinscireceiver

go 1.20
OpenTelemetry Collector Development
Building The Configuration
The configuration portion of the component is how the user is able to have their inputs over the component,
so the values that is used for the configuration need to be:
Intuitive for users to understand what that field controls
Be explicit in what is required and what is optional
The bad configuration highlights how doing the opposite of the recommendations of configuration practices impacts the usability
of the component. It doesn’t make it clear what field values should be, it includes features that can be pushed to existing processors,
and the field naming is not consistent with other components that exist in the collector.
The good configuration keeps the required values simple, reuses field names from other components, and ensures the component focuses on
just the interaction between Jenkins and the collector.
The code tab shows how much is required to be added by us and what is already provided for us by shared libraries within the collector.
These will be explained in more detail once we get to the business logic. The configuration should start off small and will change
once the business logic has started to include additional features that is needed.
Write the code
In order to implement the code needed for the configuration, we are going to create a new file named config.go with the following content:
packagejenkinscireceiverimport("go.opentelemetry.io/collector/config/confighttp""go.opentelemetry.io/collector/receiver/scraperhelper""splunk.conf/workshop/example/jenkinscireceiver/internal/metadata")typeConfigstruct{// HTTPClientSettings contains all the values
// that are commonly shared across all HTTP interactions
// performed by the collector.
confighttp.HTTPClientSettings`mapstructure:",squash"`// ScraperControllerSettings will allow us to schedule
// how often to check for updates to builds.
scraperhelper.ScraperControllerSettings`mapstructure:",squash"`// MetricsBuilderConfig contains all the metrics
// that can be configured.
metadata.MetricsBuilderConfig`mapstructure:",squash"`}
OpenTelemetry Collector Development
Component Review
To recap the type of component we will need to capture metrics from Jenkins:
The business use case an extension helps solves for are:
Having shared functionality that requires runtime configuration
Indirectly helps with observing the runtime of the collector
This is commonly referred to pull vs push based data collection, and you read more about the details in the Receiver Overview.
The business use case a processor solves for is:
Adding or removing data, fields, or values
Observing and making decisions on the data
Buffering, queueing, and reordering
The thing to keep in mind is the data type flowing through a processor needs to forward
the same data type to its downstream components. Read through Processor Overview for the details.
The business use case an exporter solves for:
Send the data to a tool, service, or storage
The OpenTelemetry collector does not want to be “backend”, an all-in-one observability suite, but rather
keep to the principles that founded OpenTelemetry to begin with; A vendor agnostic Observability for all.
To help revisit the details, please read through Exporter Overview.
This is a component type that was missed in the workshop since it is a relatively new addition to the collector, but the best way to think about a connector is that it is like a processor that allows it to be used across different telemetry types and pipelines. Meaning that a connector can accept data as logs, and output metrics, or accept metrics from one pipeline and provide metrics on the data it has observed.
The business case that a connector solves for:
Converting from different telemetry types
logs to metrics
traces to metrics
metrics to logs
Observing incoming data and producing its own data
Accepting metrics and generating analytical metrics of the data.
There was a brief overview within the Ninja section as part of the Processor Overview,
and be sure what the project for updates for new connector components.
From the component overviews, it is clear that developing a pull-based receiver for Jenkins.
OpenTelemetry Collector Development
Designing The Metrics
To help define and export the metrics captured by our receiver, we will be using, mdatagen, a tool developed for the collector that turns YAML defined metrics into code.
---# Type defines the name to reference the component# in the configuration filetype:jenkins# Status defines the component type and the stability levelstatus:class:receiverstability:development:[metrics]# Attributes are the expected fields reported# with the exported values.attributes:job.name:description:The name of the associated Jenkins jobtype:stringjob.status:description:Shows if the job had passed, or failedtype:stringenum:- failed- success- unknown# Metrics defines all the pontentially exported values from this receiver. metrics:jenkins.jobs.count:enabled:truedescription:Provides a count of the total number of configured jobsunit:"{Count}"gauge:value_type:intjenkins.job.duration:enabled:truedescription:Show the duration of the jobunit:"s"gauge:value_type:intattributes:- job.name- job.statusjenkins.job.commit_delta:enabled:truedescription:The calculation difference of the time job was finished minus commit timestampunit:"s"gauge:value_type:intattributes:- job.name- job.status
// To generate the additional code needed to capture metrics,
// the following command to be run from the shell:
// go generate -x ./...
//go:generate go run github.com/open-telemetry/opentelemetry-collector-contrib/cmd/mdatagen@v0.80.0 metadata.yaml
packagejenkinscireceiver// There is no code defined within this file.
Create these files within the project folder before continuing onto the next section.
Building The Factory
The Factory is a software design pattern that effectively allows for an object, in this case a jenkinscireceiver, to be created dynamically with the provided configuration. To use a more real-world example, it would be going to a phone store, asking for a phone
that matches your exact description, and then providing it to you.
Run the following command go generate -x ./... , it will create a new folder, jenkinscireceiver/internal/metadata, that contains all code required to export the defined metrics. The required code is:
packagejenkinscireceiverimport("errors""go.opentelemetry.io/collector/component""go.opentelemetry.io/collector/config/confighttp""go.opentelemetry.io/collector/receiver""go.opentelemetry.io/collector/receiver/scraperhelper""splunk.conf/workshop/example/jenkinscireceiver/internal/metadata")funcNewFactory()receiver.Factory{returnreceiver.NewFactory(metadata.Type,newDefaultConfig,receiver.WithMetrics(newMetricsReceiver,metadata.MetricsStability),)}funcnewMetricsReceiver(_context.Context,setreceiver.CreateSettings,cfgcomponent.Config,consumerconsumer.Metrics)(receiver.Metrics,error){// Convert the configuration into the expected type
conf,ok:=cfg.(*Config)if!ok{returnnil,errors.New("can not convert config")}sc,err:=newScraper(conf,set)iferr!=nil{returnnil,err}returnscraperhelper.NewScraperControllerReceiver(&conf.ScraperControllerSettings,set,consumer,scraperhelper.AddScraper(sc),)}
packagejenkinscireceiverimport("go.opentelemetry.io/collector/config/confighttp""go.opentelemetry.io/collector/receiver/scraperhelper""splunk.conf/workshop/example/jenkinscireceiver/internal/metadata")typeConfigstruct{// HTTPClientSettings contains all the values
// that are commonly shared across all HTTP interactions
// performed by the collector.
confighttp.HTTPClientSettings`mapstructure:",squash"`// ScraperControllerSettings will allow us to schedule
// how often to check for updates to builds.
scraperhelper.ScraperControllerSettings`mapstructure:",squash"`// MetricsBuilderConfig contains all the metrics
// that can be configured.
metadata.MetricsBuilderConfig`mapstructure:",squash"`}funcnewDefaultConfig()component.Config{return&Config{ScraperControllerSettings:scraperhelper.NewDefaultScraperControllerSettings(metadata.Type),HTTPClientSettings:confighttp.NewDefaultHTTPClientSettings(),MetricsBuilderConfig:metadata.DefaultMetricsBuilderConfig(),}}
packagejenkinscireceivertypescraperstruct{}funcnewScraper(cfg*Config,setreceiver.CreateSettings)(scraperhelper.Scraper,error){// Create a our scraper with our values
s:=scraper{// To be filled in later
}returnscraperhelper.NewScraper(metadata.Type,s.scrape)}func(scraper)scrape(ctxcontext.Context)(pmetric.Metrics,error){// To be filled in
returnpmetrics.NewMetrics(),nil}
---dist:name:otelcoldescription:"Conf workshop collector"output_path:./distversion:v0.0.0-experimentalextensions:- gomod:github.com/open-telemetry/opentelemetry-collector-contrib/extension/basicauthextension v0.80.0- gomod:github.com/open-telemetry/opentelemetry-collector-contrib/extension/healthcheckextension v0.80.0receivers:- gomod:go.opentelemetry.io/collector/receiver/otlpreceiver v0.80.0- gomod:github.com/open-telemetry/opentelemetry-collector-contrib/receiver/jaegerreceiver v0.80.0- gomod:github.com/open-telemetry/opentelemetry-collector-contrib/receiver/prometheusreceiver v0.80.0- gomod:splunk.conf/workshop/example/jenkinscireceiver v0.0.0path:./jenkinscireceiverprocessors:- gomod:go.opentelemetry.io/collector/processor/batchprocessor v0.80.0exporters:- gomod:go.opentelemetry.io/collector/exporter/loggingexporter v0.80.0- gomod:go.opentelemetry.io/collector/exporter/otlpexporter v0.80.0- gomod:go.opentelemetry.io/collector/exporter/otlphttpexporter v0.80.0# This replace is a go directive that allows for redefine# where to fetch the code to use since the default would be from a remote project.replaces:- splunk.conf/workshop/example/jenkinscireceiver => ./jenkinscireceiver
Once you have written these files into the project with the expected contents run, go mod tidy, which will fetch all the remote dependencies and update go.mod and generate the go.sum files.
OpenTelemetry Collector Development
Building The Business Logic
At this point, we have a custom component that currently does nothing so we need to add in the required
logic to capture this data from Jenkins.
From this point, the steps that we need to take are:
Create a client that connect to Jenkins
Capture all the configured jobs
Report the status of the last build for the configured job
Calculate the time difference between commit timestamp and job completion.
The changes will be made to scraper.go.
To be able to connect to the Jenkins server, we will be using the package,
“github.com/yosida95/golang-jenkins”,
which provides the functionality required to read data from the jenkins server.
Then we are going to utilise some of the helper functions from the,
“go.opentelemetry.io/collector/receiver/scraperhelper” ,
library to create a start function so that we can connect to the Jenkins server once component has finished starting.
packagejenkinscireceiverimport("context"jenkins"github.com/yosida95/golang-jenkins""go.opentelemetry.io/collector/component""go.opentelemetry.io/collector/pdata/pmetric""go.opentelemetry.io/collector/receiver""go.opentelemetry.io/collector/receiver/scraperhelper""splunk.conf/workshop/example/jenkinscireceiver/internal/metadata")typescraperstruct{mb*metadata.MetricsBuilderclient*jenkins.Jenkins}funcnewScraper(cfg*Config,setreceiver.CreateSettings)(scraperhelper.Scraper,error){s:=&scraper{mb:metadata.NewMetricsBuilder(cfg.MetricsBuilderConfig,set),}returnscraperhelper.NewScraper(metadata.Type,s.scrape,scraperhelper.WithStart(func(ctxcontext.Context,hcomponent.Host)error{client,err:=cfg.ToClient(h,set.TelemetrySettings)iferr!=nil{returnerr}// The collector provides a means of injecting authentication
// on our behalf, so this will ignore the libraries approach
// and use the configured http client with authentication.
s.client=jenkins.NewJenkins(nil,cfg.Endpoint)s.client.SetHTTPClient(client)returnnil}),)}func(sscraper)scrape(ctxcontext.Context)(pmetric.Metrics,error){// To be filled in
returnpmetric.NewMetrics(),nil}
This finishes all the setup code that is required in order to initialise a Jenkins receiver.
From this point on, we will be focuses on the scrape method that has been waiting to be filled in.
This method will be run on each interval that is configured within the configuration (by default, every minute).
The reason we want to capture the number of jobs configured so we can see the growth of our Jenkins server,
and measure of many projects have onboarded. To do this we will call the jenkins client to list all jobs,
and if it reports an error, return that with no metrics, otherwise, emit the data from the metric builder.
func(sscraper)scrape(ctxcontext.Context)(pmetric.Metrics,error){jobs,err:=s.client.GetJobs()iferr!=nil{returnpmetric.Metrics{},err}// Recording the timestamp to ensure
// all captured data points within this scrape have the same value.
now:=pcommon.NewTimestampFromTime(time.Now())// Casting to an int64 to match the expected type
s.mb.RecordJenkinsJobsCountDataPoint(now,int64(len(jobs)))// To be filled in
returns.mb.Emit(),nil}
In the last step, we were able to capture all jobs ands report the number of jobs
there was. Within this step, we are going to examine each job and use the report values
to capture metrics.
func(sscraper)scrape(ctxcontext.Context)(pmetric.Metrics,error){jobs,err:=s.client.GetJobs()iferr!=nil{returnpmetric.Metrics{},err}// Recording the timestamp to ensure
// all captured data points within this scrape have the same value.
now:=pcommon.NewTimestampFromTime(time.Now())// Casting to an int64 to match the expected type
s.mb.RecordJenkinsJobsCountDataPoint(now,int64(len(jobs)))for_,job:=rangejobs{// Ensure we have valid results to start off with
var(build=job.LastCompletedBuildstatus=metadata.AttributeJobStatusUnknown)// This will check the result of the job, however,
// since the only defined attributes are
// `success`, `failure`, and `unknown`.
// it is assume that anything did not finish
// with a success or failure to be an unknown status.
switchbuild.Result{case"aborted","not_built","unstable":status=metadata.AttributeJobStatusUnknowncase"success":status=metadata.AttributeJobStatusSuccesscase"failure":status=metadata.AttributeJobStatusFailed}s.mb.RecordJenkinsJobDurationDataPoint(now,int64(job.LastCompletedBuild.Duration),job.Name,status,)}returns.mb.Emit(),nil}
The final step is to calculate how long it took from
commit to job completion to help infer our DORA metrics.
func(sscraper)scrape(ctxcontext.Context)(pmetric.Metrics,error){jobs,err:=s.client.GetJobs()iferr!=nil{returnpmetric.Metrics{},err}// Recording the timestamp to ensure
// all captured data points within this scrape have the same value.
now:=pcommon.NewTimestampFromTime(time.Now())// Casting to an int64 to match the expected type
s.mb.RecordJenkinsJobsCountDataPoint(now,int64(len(jobs)))for_,job:=rangejobs{// Ensure we have valid results to start off with
var(build=job.LastCompletedBuildstatus=metadata.AttributeJobStatusUnknown)// Previous step here
// Ensure that the `ChangeSet` has values
// set so there is a valid value for us to reference
iflen(build.ChangeSet.Items)==0{continue}// Making the assumption that the first changeset
// item is the most recent change.
change:=build.ChangeSet.Items[0]// Record the difference from the build time
// compared against the change timestamp.
s.mb.RecordJenkinsJobCommitDeltaDataPoint(now,int64(build.Timestamp-change.Timestamp),job.Name,status,)}returns.mb.Emit(),nil}
Once all of these steps have been completed, you now have built a custom Jenkins CI receiver!
Whats next?
There are more than likely features that would be desired from component that you can think of, like:
Can I include the branch name that the job used?
Can I include the project name for the job?
How I calculate the collective job durations for project?
How do I validate the changes work?
Please take this time to play around, break it, change things around, or even try to capture logs from the builds.
Splunk Synthetic Scripting
45 minutesAuthor
Robert Castley
Proactively monitor the performance of your web app before problems affect your users. With Splunk Synthetic Monitoring, technical and business teams create detailed tests to proactively monitor the speed and reliability of websites, web apps, and resources over time, at any stage in the development cycle.
Splunk Synthetic Monitoring offers the most comprehensive and in-depth capabilities for uptime and web performance optimization as part of the only complete observability suite, Splunk Observability Cloud.
Easily set up monitoring for APIs, service endpoints and end-user experience. With Splunk Synthetic Monitoring, go beyond basic uptime and performance monitoring and focus on proactively finding and fixing issues, optimizing web performance, and ensuring customers get the best user experience.
With Splunk Synthetic Monitoring you can:
Detect and resolve issues fast across critical user flows, business transactions and API endpoints
Prevent web performance issues from affecting customers with an intelligent web optimization engine
And improve the performance of all page resources and third-party dependencies
Subsections of Splunk Synthetic Scripting
1. Real Browser Test
Introduction
This workshop walks you through using the Chrome DevTools Recorder to create a synthetic transaction against a Splunk demonstration instance.
The exported JSON from the Chrome DevTools Recorder will then be used to create a Splunk Synthetic Monitoring Real Browser Test.
In addition, you will also get to learn other Splunk Synthetic Monitoring checks like API Test and Uptime Test.
Pre-requisites
Google Chrome Browser installed
Access to Splunk Observability Cloud
Subsections of 1. Real Browser Test
1.1 Recording a test
Open the starting URL
Open the starting URL for the workshop in Chrome. Click on the appropriate link below to open the site in a new tab.
Note
The starting URL for the workshop is different for EMEA and AMER/APAC. Please use the correct URL for your region.
Next, open the Developer Tools (in the new tab that was opened above) by pressing Ctrl + Shift + I on Windows or Cmd + Option + I on a Mac, then select Recorder from the top-level menu or the More tools flyout menu.
Note
Site elements might change depending on viewport width. Before recording, set your browser window to the correct width for the test you want to create (Desktop, Tablet, or Mobile). Change the DevTools “dock side” to pop out as a separate window if it helps.
Create a new recording
With the Recorder panel open in the DevTools window. Click on the Create a new recording button to start.
For the Recording Name use your initials to prefix the name of the recording e.g. <your initials> - Online Boutique. Click on Start Recording to start recording your actions.
Now that we are recording, complete the following actions on the site:
Click on Vintage Camera Lens
Click on Add to Cart
Click on Place Order
Click on End recording in the Recorder panel.
Exporting the recording
Click on the Export button:
Select JSON as the format, then click on Save
Congratulations! You have successfully created a recording using the Chrome DevTools Recorder. Next, we will use this recording to create a Real Browser Test in Splunk Synthetic Monitoring.
Click here to view the JSON file
{"title":"RWC - Online Boutique","steps":[{"type":"setViewport","width":1430,"height":1016,"deviceScaleFactor":1,"isMobile":false,"hasTouch":false,"isLandscape":false},{"type":"navigate","url":"https://online-boutique-eu.splunko11y.com/","assertedEvents":[{"type":"navigation","url":"https://online-boutique-eu.splunko11y.com/","title":"Online Boutique"}]},{"type":"click","target":"main","selectors":[["div:nth-of-type(2) > div:nth-of-type(2) a > div"],["xpath//html/body/main/div/div/div[2]/div[2]/div/a/div"],["pierce/div:nth-of-type(2) > div:nth-of-type(2) a > div"]],"offsetY":170,"offsetX":180,"assertedEvents":[{"type":"navigation","url":"https://online-boutique-eu.splunko11y.com/product/66VCHSJNUP","title":""}]},{"type":"click","target":"main","selectors":[["aria/ADD TO CART"],["button"],["xpath//html/body/main/div[1]/div/div[2]/div/form/div/button"],["pierce/button"],["text/Add to Cart"]],"offsetY":35.0078125,"offsetX":46.4140625,"assertedEvents":[{"type":"navigation","url":"https://online-boutique-eu.splunko11y.com/cart","title":""}]},{"type":"click","target":"main","selectors":[["aria/PLACE ORDER"],["div > div > div.py-3 button"],["xpath//html/body/main/div/div/div[4]/div/form/div[4]/button"],["pierce/div > div > div.py-3 button"],["text/Place order"]],"offsetY":29.8125,"offsetX":66.8203125,"assertedEvents":[{"type":"navigation","url":"https://online-boutique-eu.splunko11y.com/cart/checkout","title":""}]}]}
1.2 Create Real Browser Test
In Splunk Observability Cloud, navigate to Synthetics and click on Add new test.
From the dropdown select Browser test.
You will then be presented with the Browser test content configuration page.
1.3 Import JSON
To begin configuring our test, we need to import the JSON that we exported from the Chrome DevTools Recorder. To enable the Import button, we must first give our test a name e.g. <your initials> - Online Boutique.
Once the Import button is enabled, click on it and either drop the JSON file that you exported from the Chrome DevTools Recorder or upload the file.
Once the JSON file has been uploaded, click on Continue to edit steps
Before we make any edits to the test, let’s first configure the settings, click on < Return to test
1.4 Settings
The simple settings allow you to configure the basics of the test:
Name: The name of the test (e.g. RWC - Online Boutique).
Details:
Locations: The locations where the test will run from.
Device: Emulate different devices and connection speeds. Also, the viewport will be adjusted to match the chosen device.
Frequency: How often the test will run.
Round-robin: If multiple locations are selected, the test will run from one location at a time, rather than all locations at once.
Active: Set the test to active or inactive.
![Return to Test]For this workshop, we will configure the locations that we wish to monitor from. Click in the Locations field and you will be presented with a list of global locations (over 50 in total).
Select the following locations:
AWS - N. Virginia
AWS - London
AWS - Melbourne
Once complete, scroll down and click on Click on Submit to save the test.
The test will now be scheduled to run every 5 minutes from the 3 locations that we have selected. This does take a few minutes for the schedule to be created.
So whilst we wait for the test to be scheduled, click on Edit test so we can go through the Advanced settings.
1.5 Advanced Settings
Click on Advanced, these settings are optional and can be used to further configure the test.
Note
In the case of this workshop, we will not be using any of these settings as this is for informational purposes only.
Security:
TLS/SSL validation: When activated, this feature is used to enforce the validation of expired, invalid hostname, or untrusted issuer on SSL/TLS certificates.
Authentication: Add credentials to authenticate with sites that require additional security protocols, for example from within a corporate network. By using concealed global variables in the Authentication field, you create an additional layer of security for your credentials and simplify the ability to share credentials across checks.
Custom Content:
Custom headers: Specify custom headers to send with each request. For example, you can add a header in your request to filter out requests from analytics on the back end by sending a specific header in the requests. You can also use custom headers to set cookies.
Cookies: Set cookies in the browser before the test starts. For example, to prevent a popup modal from randomly appearing and interfering with your test, you can set cookies. Any cookies that are set will apply to the domain of the starting URL of the check. Splunk Synthetics Monitoring uses the public suffix list to determine the domain.
Host overrides: Add host override rules to reroute requests from one host to another. For example, you can create a host override to test an existing production site against page resources loaded from a development site or a specific CDN edge node.
Next, we will edit the test steps to provide more meaningful names for each step.
1.6 Edit test steps
To edit the steps click on the + Edit steps or synthetic transactions button. From here, we are going to give meaningful names to each step.
For each of the four steps, we are going to give them a meaningful name.
Step 1 replace the text Go to URL with HomePage - Online Boutique
Step 2 enter the text Select Vintage Camera Lens.
Step 3 enter Add to Cart.
Step 4 enter Place Order.
Click < Return to test to return to the test configuration page and click Save to save the test.
You will be returned to the test dashboard where you will see test results start to appear.
Congratulations! You have successfully created a Real Browser Test in Splunk Synthetic Monitoring. Next, we will look into a test result in more detail.
1.7 View test results
In the Scatterplot from the previous step, click on one of the dots to drill into the test run data. Preferably, select the most recent test run (farthest to the right).
API Test
The API Test provides a flexible way to check the functionality and performance of API endpoints. The shift toward API-first development has magnified the necessity to monitor the back-end services that provide your core front-end functionality.
Whether you’re interested in testing the multi-step API interactions or you want to gain visibility into the performance of your endpoints, the API Test can help you accomplish your goals.
Subsections of 2. API Test
Global Variables
Global Variables
View the global variable that we’ll use to perform our API test. Click on Global Variables under the cog. The global variable named env.encoded_auth will be the one that we’ll use to build the spotify API transaction.
Create new API test
Create a new API test
Create a new API test by clicking on the Add new test button and select API test from the dropdown. Name the test using your initials followed by Spotify API e.g. RWC - Spotify API
Authentication Request
Add Authentication Request
Click on + Add requests and enter the request step name e.g. Authenticate with Spotify API.
Expand the Request section, from the drop-down change the request method to POST and enter the following URL:
https://accounts.spotify.com/api/token
In the Payload body section enter the following:
grant_type=client_credentials
Next, add two request headers with the following key/value pairings:
CONTENT-TYPE: application/x-www-form-urlencoded
AUTHORIZATION: Basic {{env.encoded_auth}}
Expand the Validation section and add the following extraction:
Extract from Response bodyJSON$.access_tokenasaccess_token.
This will parse the JSON payload that is received from the Spotify API, extract the access token and store it as a custom variable.
Search Request
Add Search Request
Click on + Add Request to add the next step. Name the step Search for Tracks named “Up around the bend”.
Expand the Request section and change the request method to GET and enter the following URL:
This workshop will equip you to build a distributed trace for a small serverless application that runs on AWS Lambda, producing and consuming a message via AWS Kinesis.
First, we will see how OpenTelemetry’s auto-instrumentation captures traces and exports them to your target of choice.
Then, we will see how we can enable context propagation with manual instrumentation.
For this workshop Splunk has prepared an Ubuntu Linux instance in AWS/EC2 all pre-configured for you. To get access to that instance, please visit the URL provided by the workshop leader.
Subsections of Lambda Tracing
Setup
Prerequisites
Observability Workshop Instance
The Observability Workshop is most often completed on a Splunk-issued and preconfigured EC2 instance running Ubuntu.
Your workshop instructor will provide you with the credentials to your assigned workshop instance.
Your instance should have the following environment variables already set:
ACCESS_TOKEN
REALM
These are the Splunk Observability Cloud Access Token and Realm for your workshop.
They will be used by the OpenTelemetry Collector to forward your data to the correct Splunk Observability Cloud organization.
Note
Alternatively, you can deploy a local observability workshop instance using Multipass.
AWS Command Line Interface (awscli)
The AWS Command Line Interface, or awscli, is an API used to interact with AWS resources. In this workshop, it is used by certain scripts to interact with the resource you’ll deploy.
Your Splunk-issued workshop instance should already have the awscli installed.
Check if the aws command is installed on your instance with the following command:
which aws
The expected output would be /usr/local/bin/aws
If the aws command is not installed on your instance, run the following command:
sudo apt install awscli
Terraform
Terraform is an Infrastructure as Code (IaC) platform, used to deploy, manage and destroy resource by defining them in configuration files. Terraform employs HCL to define those resources, and supports multiple providers for various platforms and technologies.
We will be using Terraform at the command line in this workshop to deploy the following resources:
AWS API Gateway
Lambda Functions
Kinesis Stream
CloudWatch Log Groups
S3 Bucket
and other supporting resources
Your Splunk-issued workshop instance should already have terraform installed.
Check if the terraform command is installed on your instance:
which terraform
The expected output would be /usr/local/bin/terraform
If the terraform command is not installed on your instance, follow Terraform’s recommended installation commands listed below:
The Workshop Directory o11y-lambda-workshop is a repository that contains all the configuration files and scripts to complete both the auto-instrumentation and manual instrumentation of the example Lambda-based application we will be using today.
Confirm you have the workshop directory in your home directory:
cd&& ls
The expected output would include o11y-lambda-workshop
If the o11y-lambda-workshop directory is not in your home directory, clone it with the following command:
The AWS CLI requires that you have credentials to be able to access and manage resources deployed by their services. Both Terraform and the Python scripts in this workshop require these variables to perform their tasks.
Configure the awscli with the access key ID, secret access key and region for this workshop:
aws configure
This command should provide a prompt similar to the one below:
AWS Access Key ID [None]: XXXXXXXXXXXXXXXX
AWS Secret Acces Key [None]: XXXXXXXXXXXXXXXXXXXXXXXXXXXXXXXXXXX
Default region name [None]: us-east-1
Default outoput format [None]:
If the awscli is not configured on your instance, run the following command and provide the values your instructor would provide you with.
aws configure
Terraform
Terraform supports the passing of variables to ensure sensitive or dynamic data is not hard-coded in your .tf configuration files, as well as to make those values reusable throughout your resource definitions.
In our workshop, Terraform requires variables necessary for deploying the Lambda functions with the right values for the OpenTelemetry Lambda layer; For the ingest values for Splunk Observability Cloud; And to make your environment and resources unique and immediatley recognizable.
Terraform variables are defined in the following manner:
Define the variables in your main.tf file or a variables.tf
Set the values for those variables in either of the following ways:
setting environment variables at the host level, with the same variable names as in their definition, and with TF_VAR_ as a prefix
setting the values for your variables in a terraform.tfvars file
passing the values as arguments when running terraform apply
We will be using a combination of variables.tf and terraform.tfvars files to set our variables in this workshop.
Using either vi or nano, open the terraform.tfvars file in either the auto or manual directory
vi ~/o11y-lambda-workshop/auto/terraform.tfvars
Set the variables with their values. Replace the CHANGEME placeholders with those provided by your instructor.
Ensure you change only the placeholders, leaving the quotes and brackets intact, where applicable.
The prefix is a unique identifier you can choose for yourself, to make your resources distinct from other participants’ resources. We suggest using a short form of your name, for example.
Also, please only lowercase letters for the prefix. Certain resouces in AWS, such as S3, would through an error if you use uppercase letters.
Save your file and exit the editor.
Finally, copy the terraform.tfvars file you just edited to the other directory.
We do this as we will be using the same values for both the autoinstrumentation and manual instrumentation protions of the workshop
File Permissions
While all other files are fine as they are, the send_message.py script in both the auto and manual will have to be executed as part of our workshop. As a result, it needs to have the appropriate permissions to run as expected. Follow these instructions to set them.
First, ensure you are in the o11y-lambda-workshop directory:
cd ~/o11y-lambda-workshop
Next, run the following command to set executable permissions on the send_message.py script:
Now that we’ve squared off the prerequisites, we can get started with the workshop!
Auto-Instrumentation
The first part of our workshop will demonstrate how auto-instrumentation with OpenTelemetry allows the OpenTelemetry Collector to auto-detect what language your function is written in, and start capturing traces for those functions.
The Auto-Instrumentation Workshop Directory & Contents
First, let us take a look at the o11y-lambda-workshop/auto directory, and some of its files. This is where all the content for the auto-instrumentation portion of our workshop resides.
The auto Directory
Run the following command to get into the o11y-lambda-workshop/auto directory:
cd ~/o11y-lambda-workshop/auto
Inspect the contents of this directory:
ls
The output should include the following files and directories:
By using these environment variables, we are configuring our auto-instrumentation in a few ways:
We are setting environment variables to inform the OpenTelemetry collector of which Splunk Observability Cloud organization we would like to have our data exported to.
We are also setting variables that help OpenTelemetry identify our function/service, as well as the environment/application it is a part of.
OTEL_SERVICE_NAME="producer-lambda"# consumer-lambda in the case of the consumer functionOTEL_RESOURCE_ATTRIBUTES="deployment.environment=${var.prefix}-lambda-shop"
We are setting an environment variable that lets OpenTelemetry know what wrappers it needs to apply to our function’s handler so as to capture trace data automatically, based on our code language.
These values are sourced from the environment variables we set in the Prerequisites section, as well as resources that will be deployed as a part of this Terraform configuration file.
You should also see an argument for setting the Splunk OpenTelemetry Lambda layer on each function
layers= var.otel_lambda_layer
The OpenTelemetry Lambda layer is a package that contains the libraries and dependencies necessary to collector, process and export telemetry data for Lambda functions at the moment of invocation.
While there is a general OTel Lambda layer that has all the libraries and dependencies for all OpenTelemetry-supported languages, there are also language-specific Lambda layers, to help make your function even more lightweight.
You can see the relevant Splunk OpenTelemetry Lambda layer ARNs (Amazon Resource Name) and latest versions for each AWS region HERE
The producer.mjs file
Next, let’s take a look at the producer-lambda function code:
Run the following command to view the contents of the producer.mjs file:
This NodeJS module contains the code for the producer function.
Essentially, this function receives a message, and puts that message as a record to the targeted Kinesis Stream
Deploying the Lambda Functions & Generating Trace Data
Now that we are familiar with the contents of our auto directory, we can deploy the resources for our workshop, and generate some trace data from our Lambda functions.
Initialize Terraform in the auto directory
In order to deploy the resources defined in the main.tf file, you first need to make sure that Terraform is initialized in the same folder as that file.
Ensure you are in the auto directory:
pwd
The expected output would be ~/o11y-lambda-workshop/auto
If you are not in the auto directory, run the following command:
cd ~/o11y-lambda-workshop/auto
Run the following command to initialize Terraform in this directory
terraform init
This command will create a number of elements in the same folder:
.terraform.lock.hcl file: to record the providers it will use to provide resources
.terraform directory: to store the provider configurations
In addition to the above files, when terraform is run using the apply subcommand, the terraform.tfstate file will be created to track the state of your deployed resources.
These enable Terraform to manage the creation, state and destruction of resources, as defined within the main.tf file of the auto directory
Deploy the Lambda functions and other AWS resources
Once we’ve initialized Terraform in this directory, we can go ahead and deploy our resources.
First, run the terraform plan command to ensure that Terraform will be able to create your resources without encountering any issues.
terraform plan
This will result in a plan to deploy resources and output some data, which you can review to ensure everything will work as intended.
Do note that a number of the values shown in the plan will be known post-creation, or are masked for security purposes.
Next, run the terraform apply command to deploy the Lambda functions and other supporting resources from the main.tf file:
terraform apply
Respond yes when you see the Enter a value: prompt
Terraform outputs are defined in the outputs.tf file.
These outputs will be used programmatically in other parts of our workshop, as well.
Send some traffic to the producer-lambda URL (base_url)
To start getting some traces from our deployed Lambda functions, we would need to generate some traffic. We will send a message to our producer-lambda function’s endpoint, which should be put as a record into our Kinesis Stream, and then pulled from the Stream by the consumer-lambda function.
Ensure you are in the auto directory:
pwd
The expected output would be ~/o11y-lambda-workshop/auto
If you are not in the auto directory, run the following command
cd ~/o11y-lambda-workshop/auto
The send_message.py script is a Python script that will take input at the command line, add it to a JSON dictionary, and send it to your producer-lambda function’s endpoint repeatedly, as part of a while loop.
Run the send_message.py script as a background process
You should see an output similar to the following if your message is successful
[1]79829user@host manual % appending output to nohup.out
The two most import bits of information here are:
The process ID on the first line (79829 in the case of my example), and
The appending output to nohup.out message
The nohup command ensures the script will not hang up when sent to the background. It also captures the curl output from our command in a nohup.out file in the same folder as the one you’re currently in.
The & tells our shell process to run this process in the background, thus freeing our shell to run other commands.
Next, check the contents of the response.logs file, to ensure your output confirms your requests to your producer-lambda endpoint are successful:
cat response.logs
You should see the following output among the lines printed to your screen if your message is successful:
{"message": "Message placed in the Event Stream: {prefix}-lambda_stream"}
If unsuccessful, you will see:
{"message": "Internal server error"}
Important
If this occurs, ask one of the workshop facilitators for assistance.
View the Lambda Function Logs
Next, let’s take a look at the logs for our Lambda functions.
To view your producer-lambda logs, check the producer.logs file:
cat producer.logs
To view your consumer-lambda logs, check the consumer.logs file:
cat consumer.logs
Examine the logs carefully.
Workshop Question
Do you see OpenTelemetry being loaded? Look out for the lines with splunk-extension-wrapper
Consider running head -n 50 producer.logs or head -n 50 consumer.logs to see the splunk-extension-wrapper being loaded.
Splunk APM, Lambda Functions & Traces
The Lambda functions should be generating a sizeable amount of trace data, which we would need to take a look at. Through the combination of environment variables and the OpenTelemetry Lambda layer configured in the resource definition for our Lambda functions, we should now be ready to view our functions and traces in Splunk APM.
View your Environment name in the Splunk APM Overview
Let’s start by making sure that Splunk APM is aware of our Environment from the trace data it is receiving. This is the deployment.name we set as part of the OTEL_RESOURCE_ATTRIBUTES variable we set on our Lambda function definitions in main.tf. It was also one of the outputs from the terraform apply command we ran earlier.
In Splunk Observability Cloud:
Click on the APM Button from the Main Menu on the left. This will take you to the Splunk APM Overview.
Select your APM Environment from the Environment: dropdown.
Your APM environment should be in the PREFIX-lambda-shop format, where the PREFIX is obtained from the environment variable you set in the Prerequisites section
Note
It may take a few minutes for your traces to appear in Splunk APM. Try hitting refresh on your browser until you find your environment name in the list of environments.
View your Environment’s Service Map
Once you’ve selected your Environment name from the Environment drop down, you can take a look at the Service Map for your Lambda functions.
Click the Service Map Button on the right side of the APM Overview page. This will take you to your Service Map view.
You should be able to see the producer-lambda function and the call it is making to the Kinesis Stream to put your record.
Workshop Question
What about your consumer-lambda function?
Explore the Traces from your Lambda Functions
Click the Traces button to view the Trace Analyzer.
On this page, we can see the traces that have been ingested from the OpenTelemetry Lambda layer of your producer-lambda function.
Select a trace from the list to examine by clicking on its hyperlinked Trace ID.
We can see that the producer-lambda function is putting a record into the Kinesis Stream. But the action of the consumer-lambda function is missing!
This is because the trace context is not being propagated. Trace context propagation is not supported out-of-the-box by Kinesis service at the time of this workshop. Our distributed trace stops at the Kinesis service, and because its context isn’t automatically propagated through the stream, we can’t see any further.
Not yet, at least…
Let’s see how we work around this in the next section of this workshop. But before that, let’s clean up after ourselves!
Clean Up
The resources we deployed as part of this auto-instrumenation exercise need to be cleaned. Likewise, the script that was generating traffice against our producer-lambda endpoint needs to be stopped, if it’s still running. Follow the below steps to clean up.
Kill the send_message
If the send_message.py script is still running, stop it with the follwing commands:
fg
This brings your background process to the foreground.
Next you can hit [CONTROL-C] to kill the process.
Destroy all AWS resources
Terraform is great at managing the state of our resources individually, and as a deployment. It can even update deployed resources with any changes to their definitions. But to start afresh, we will destroy the resources and redeploy them as part of the manual instrumentation portion of this workshop.
Please follow these steps to destroy your resources:
Ensure you are in the auto directory:
pwd
The expected output would be ~/o11y-lambda-workshop/auto
If you are not in the auto directory, run the following command:
cd ~/o11y-lambda-workshop/auto
Destroy the Lambda functions and other AWS resources you deployed earlier:
terraform destroy
respond yes when you see the Enter a value: prompt
This will result in the resources being destroyed, leaving you with a clean environment
This process will leave you with the files and directories created as a result of our activity. Do not worry about those.
Manual Instrumentation
The second part of our workshop will focus on demonstrating how manual instrumentation with OpenTelemetry empowers us to enhance telemetry collection. More specifically, in our case, it will enable us to propagate trace context data from the producer-lambda function to the consumer-lambda function, thus enabling us to see the relationship between the two functions, even across Kinesis Stream, which currently does not support automatic context propagation.
The Manual Instrumentation Workshop Directory & Contents
Once again, we will first start by taking a look at our operating directory, and some of its files. This time, it will be o11y-lambda-workshop/manual directory. This is where all the content for the manual instrumentation portion of our workshop resides.
The manual directory
Run the following command to get into the o11y-lambda-workshop/manual directory:
cd ~/o11y-lambda-workshop/manual
Inspect the contents of this directory with the ls command:
ls
The output should include the following files and directories:
Here also, there are a few differences of note. Let’s take a closer look
cat handler/consumer.mjs
In this file, we are importing the following @opentelemetry/api objects:
propagation
trace
ROOT_CONTEXT
We use these to extract the trace context that was propagated from the producer function
Then to add new span attributes based on our name and superpower to the extracted trace context
Propagating the Trace Context from the Producer Function
The below code executes the following steps inside the producer function:
Get the tracer for this trace
Initialize a context carrier object
Inject the context of the active span into the carrier object
Modify the record we are about to pu on our Kinesis stream to include the carrier that will carry the active span’s context to the consumer
...import{context,propagation,trace,}from"@opentelemetry/api";...consttracer=trace.getTracer('lambda-app');...returntracer.startActiveSpan('put-record',async(span)=>{letcarrier={};propagation.inject(context.active(),carrier);consteventBody=Buffer.from(event.body,'base64').toString();constdata="{\"tracecontext\": "+JSON.stringify(carrier)+", \"record\": "+eventBody+"}";console.log(`Record with Trace Context added:
${data}`);try{awaitkinesis.send(newPutRecordCommand({StreamName:streamName,PartitionKey:"1234",Data:data,}),message=`Message placed in the Event Stream: ${streamName}`)...span.end();
Extracting Trace Context in the Consumer Function
The below code executes the following steps inside the consumer function:
Extract the context that we obtained from producer-lambda into a carrier object.
Extract the tracer from current context.
Start a new span with the tracer within the extracted context.
Bonus: Add extra attributes to your span, including custom ones with the values from your message!
Deploying Lambda Functions & Generating Trace Data
Now that we know how to apply manual instrumentation to the functions and services we wish to capture trace data for, let’s go about deploying our Lambda functions again, and generating traffic against our producer-lambda endpoint.
Initialize Terraform in the manual directory
Seeing as we’re in a new directory, we will need to initialize Terraform here once again.
Ensure you are in the manual directory:
pwd
The expected output would be ~/o11y-lambda-workshop/manual
If you are not in the manual directory, run the following command:
cd ~/o11y-lambda-workshop/manual
Run the following command to initialize Terraform in this directory
terraform init
Deploy the Lambda functions and other AWS resources
Let’s go ahead and deploy those resources again as well!
Run the terraform plan command, ensuring there are no issues.
terraform plan
Follow up with the terraform apply command to deploy the Lambda functions and other supporting resources from the main.tf file:
terraform apply
Respond yes when you see the Enter a value: prompt
As you can tell, aside from the first portion of the base_url and the log gropu ARNs, the output should be largely the same as when you ran the auto-instrumentation portion of this workshop up to this same point.
Send some traffic to the producer-lambda endpoint (base_url)
Once more, we will send our name and superpower as a message to our endpoint. This will then be added to a record in our Kinesis Stream, along with our trace context.
Ensure you are in the manual directory:
pwd
The expected output would be ~/o11y-lambda-workshop/manual
If you are not in the manual directory, run the following command:
cd ~/o11y-lambda-workshop/manual
Run the send_message.py script as a background process:
Next, check the contents of the response.logs file for successful calls to ourproducer-lambda endpoint:
cat response.logs
You should see the following output among the lines printed to your screen if your message is successful:
{"message": "Message placed in the Event Stream: hostname-eventStream"}
If unsuccessful, you will see:
{"message": "Internal server error"}
Important
If this occurs, ask one of the workshop facilitators for assistance.
View the Lambda Function Logs
Let’s see what our logs look like now.
Check the producer.logs file:
cat producer.logs
And the consumer.logs file:
cat consumer.logs
Examine the logs carefully.
Workshop Question
Do you notice the difference?
Copy the Trace ID from the consumer-lambda logs
This time around, we can see that the consumer-lambda log group is logging our message as a record together with the tracecontext that we propagated.
To copy the Trace ID:
Take a look at one of the Kinesis Message logs. Within it, there is a data dictionary
Take a closer look at data to see the nested tracecontext dictionary
Within the tracecontext dictionary, there is a traceparent key-value pair
The traceparent key-value pair holds the Trace ID we seek
There are 4 groups of values, separated by -. The Trace ID is the 2nd group of characters
Copy the Trace ID, and save it. We will need it for a later step in this workshop
Splunk APM, Lambda Functions and Traces, Again!
In order to see the result of our context propagation outside of the logs, we’ll once again consult the Splunk APM UI.
View your Lambda Functions in the Splunk APM Service Map
Let’s take a look at the Service Map for our environment in APM once again.
In Splunk Observability Cloud:
Click on the APM Button in the Main Menu.
Select your APM Environment from the Environment: dropdown.
Click the Service Map Button on the right side of the APM Overview page. This will take you to your Service Map view.
Note
Reminder: It may take a few minutes for your traces to appear in Splunk APM. Try hitting refresh on your browser until you find your environment name in the list of environments.
Workshop Question
Notice the difference?
You should be able to see the producer-lambda and consumer-lambda functions linked by the propagated context this time!
Explore a Lambda Trace by Trace ID
Next, we will take another look at a trace related to our Environment.
Paste the Trace ID you copied from the consumer function’s logs into the View Trace ID search box under Traces and click Go
Note
The Trace ID was a part of the trace context that we propagated.
You can read up on two of the most common propagation standards:
The Splunk Distribution of Opentelemetry JS, which supports our NodeJS functions, defaults to the W3C standard
Workshop Question
Bonus Question: What happens if we mix and match the W3C and B3 headers?
Click on the consumer-lambda span.
Workshop Question
Can you find the attributes from your message?
Clean Up
We are finally at the end of our workshop. Kindly clean up after yourself!
Kill the send_message
If the send_message.py script is still running, stop it with the follwing commands:
fg
This brings your background process to the foreground.
Next you can hit [CONTROL-C] to kill the process.
Destroy all AWS resources
Terraform is great at managing the state of our resources individually, and as a deployment. It can even update deployed resources with any changes to their definitions. But to start afresh, we will destroy the resources and redeploy them as part of the manual instrumentation portion of this workshop.
Please follow these steps to destroy your resources:
Ensure you are in the manual directory:
pwd
The expected output would be ~/o11y-lambda-workshop/manual
If you are not in the manual directory, run the following command:
cd ~/o11y-lambda-workshop/manual
Destroy the Lambda functions and other AWS resources you deployed earlier:
terraform destroy
respond yes when you see the Enter a value: prompt
This will result in the resources being destroyed, leaving you with a clean environment
Conclusion
Congratulations on finishing the Lambda Tracing Workshop! You have seen how we can complement auto-instrumentation with manual steps to have the producer-lambda function’s context be sent to the consumer-lambda function via a record in a Kinesis stream. This allowed us to build the expected Distributed Trace, and to contextualize the relationship between both functions in Splunk APM.
You can now build out a trace manually by linking two different functions together. This comes in handy when your auto-instrumentation, or 3rd-party systems, do not support context propagation out of the box, or when you wish to add custom attributes to a trace for more relevant trace analaysis.
Hands-On OpenTelemetry, Docker, and K8s
2 minutesAuthor
Derek Mitchell
In this workshop, you’ll get hands-on experience with the following:
Practice deploying the collector and instrumenting a .NET application with the Splunk distribution of OpenTelemetry .NET in Linux and Kubernetes environments.
Practice “dockerizing” a .NET application, running it in Docker, and then adding Splunk OpenTelemetry instrumentation.
Practice deploying the Splunk distro of the collector in a K8s environment using Helm. Then customize the collector config and troubleshoot an issue.
The workshop uses a simple .NET application to illustrate these concepts. Let’s get started!
Tip
The easiest way to navigate through this workshop is by using:
the left/right arrows (< | >) on the top right of this page
the left (◀️) and right (▶️) cursor keys on your keyboard
Subsections of Hands-On OpenTelemetry, Docker, and K8s
Connect to EC2 Instance
5 minutes
Connect to your EC2 Instance
We’ve prepared an Ubuntu Linux instance in AWS/EC2 for each attendee.
Using the IP address and password provided by your instructor, connect to your EC2 instance
using one of the methods below:
Mac OS / Linux
ssh splunk@IP address
Windows 10+
Use the OpenSSH client
Earlier versions of Windows
Use Putty
Deploy the OpenTelemetry Collector
10 minutes
Uninstall the OpenTelemetry Collector
Our EC2 instance may already have an older version the Splunk Distribution of the OpenTelemetry Collector
installed. Before proceeding further, let’s uninstall it using the following command:
curl -sSL https://dl.signalfx.com/splunk-otel-collector.sh > /tmp/splunk-otel-collector.sh;sudo sh /tmp/splunk-otel-collector.sh --uninstall
Reading package lists... Done
Building dependency tree... Done
Reading state information... Done
The following packages will be REMOVED:
splunk-otel-collector*
0 upgraded, 0 newly installed, 1 to remove and 167 not upgraded.
After this operation, 766 MB disk space will be freed.
(Reading database ... 157441 files and directories currently installed.)Removing splunk-otel-collector (0.92.0) ...
(Reading database ... 147373 files and directories currently installed.)Purging configuration files for splunk-otel-collector (0.92.0) ...
Scanning processes...
Scanning candidates...
Scanning linux images...
Running kernel seems to be up-to-date.
Restarting services...
systemctl restart fail2ban.service falcon-sensor.service
Service restarts being deferred:
systemctl restart networkd-dispatcher.service
systemctl restart unattended-upgrades.service
No containers need to be restarted.
No user sessions are running outdated binaries.
No VM guests are running outdated hypervisor (qemu) binaries on this host.
Successfully removed the splunk-otel-collector package
Deploy the OpenTelemetry Collector
Let’s deploy the latest version of the Splunk Distribution of the OpenTelemetry Collector on our Linux EC2 instance.
We can do this by downloading the collector binary using curl, and then running it with specific arguments that tell the collector which realm to report data into, which access
token to use, and which deployment environment to report into.
A deployment environment in Splunk Observability Cloud is a distinct deployment of your system
or application that allows you to set up configurations that don’t overlap with configurations
in other deployments of the same application.
Dec 20 00:13:14 derek-1 systemd[1]: Started Splunk OpenTelemetry Collector.
Dec 20 00:13:14 derek-1 otelcol[14465]: 2024/12/20 00:13:14 settings.go:483: Set config to /etc/otel/collector/agent_config.yaml
Dec 20 00:13:14 derek-1 otelcol[14465]: 2024/12/20 00:13:14 settings.go:539: Set memory limit to 460 MiB
Dec 20 00:13:14 derek-1 otelcol[14465]: 2024/12/20 00:13:14 settings.go:524: Set soft memory limit set to 460 MiB
Dec 20 00:13:14 derek-1 otelcol[14465]: 2024/12/20 00:13:14 settings.go:373: Set garbage collection target percentage (GOGC) to 400Dec 20 00:13:14 derek-1 otelcol[14465]: 2024/12/20 00:13:14 settings.go:414: set"SPLUNK_LISTEN_INTERFACE" to "127.0.0.1"etc.
Collector Configuration
Where do we find the configuration that is used by this collector?
It’s available in the /etc/otel/collector directory. Since we installed the
collector in agent mode, the collector configuration can be found in the
agent_config.yaml file.
Deploy a .NET Application
10 minutes
Prerequisites
Before deploying the application, we’ll need to install the .NET 8 SDK on our instance.
Hit:1 http://us-west-1.ec2.archive.ubuntu.com/ubuntu jammy InRelease
Hit:2 http://us-west-1.ec2.archive.ubuntu.com/ubuntu jammy-updates InRelease
Hit:3 http://us-west-1.ec2.archive.ubuntu.com/ubuntu jammy-backports InRelease
Hit:4 http://security.ubuntu.com/ubuntu jammy-security InRelease
Ign:5 https://splunk.jfrog.io/splunk/otel-collector-deb release InRelease
Hit:6 https://splunk.jfrog.io/splunk/otel-collector-deb release Release
Reading package lists... Done
Reading package lists... Done
Building dependency tree... Done
Reading state information... Done
The following additional packages will be installed:
  aspnetcore-runtime-8.0 aspnetcore-targeting-pack-8.0 dotnet-apphost-pack-8.0 dotnet-host-8.0 dotnet-hostfxr-8.0 dotnet-runtime-8.0 dotnet-targeting-pack-8.0 dotnet-templates-8.0 liblttng-ust-common1
  liblttng-ust-ctl5 liblttng-ust1 netstandard-targeting-pack-2.1-8.0
The following NEW packages will be installed:
  aspnetcore-runtime-8.0 aspnetcore-targeting-pack-8.0 dotnet-apphost-pack-8.0 dotnet-host-8.0 dotnet-hostfxr-8.0 dotnet-runtime-8.0 dotnet-sdk-8.0 dotnet-targeting-pack-8.0 dotnet-templates-8.0
  liblttng-ust-common1 liblttng-ust-ctl5 liblttng-ust1 netstandard-targeting-pack-2.1-8.0
0 upgraded, 13 newly installed, 0 to remove and 0 not upgraded.
Need to get 138 MB of archives.
After this operation, 495 MB of additional disk space will be used.
etc.
We can build the application using the following command:
dotnet build
MSBuild version 17.8.5+b5265ef37 for .NET
Determining projects to restore...
All projects are up-to-date for restore.
helloworld -> /home/splunk/workshop/docker-k8s-otel/helloworld/bin/Debug/net8.0/helloworld.dll
Build succeeded.
0 Warning(s)0 Error(s)Time Elapsed 00:00:02.04
If that’s successful, we can run it as follows:
dotnet run
Building...
info: Microsoft.Hosting.Lifetime[14]
      Now listening on: http://localhost:8080
info: Microsoft.Hosting.Lifetime[0]
      Application started. Press Ctrl+C to shut down.
info: Microsoft.Hosting.Lifetime[0]
      Hosting environment: Development
info: Microsoft.Hosting.Lifetime[0]
      Content root path: /home/splunk/workshop/docker-k8s-otel/helloworld
Once it’s running, open a second SSH terminal to your Ubuntu instance and access the application using curl:
curl http://localhost:8080/hello
Hello, World!
You can also pass in your name:
curl http://localhost:8080/hello/Tom
Hello, Tom!
Press Ctrl + C to quit your Helloworld app before moving to the next step.
Next Steps
What are the three methods that we can use to instrument our application with OpenTelemetry?
How can we see what traces are being exported by the .NET application from our Linux instance?
Click here to see the answer
There are two ways we can do this:
We could add OTEL_TRACES_EXPORTER=otlp,console at the start of the dotnet run command, which ensures that traces are both written to collector via OTLP as well as the console.
OTEL_TRACES_EXPORTER=otlp,console dotnet run
Alternatively, we could add the debug exporter to the collector configuration, and add it to the traces pipeline, which ensures the traces are written to the collector logs.
View your application in Splunk Observability Cloud
Now that the setup is complete, let’s confirm that traces are sent to Splunk Observability Cloud. Note that when the application is deployed for the first time, it may take a few minutes for the data to appear.
Navigate to APM, then use the Environment dropdown to select your environment (i.e. otel-instancename).
If everything was deployed correctly, you should see helloworld displayed in the list of services:
Click on Service Map on the right-hand side to view the service map.
Next, click on Traces on the right-hand side to see the traces captured for this application.
An individual trace should look like the following:
Press Ctrl + C to quit your Helloworld app before moving to the next step.
Dockerize the Application
15 minutes
Later on in this workshop, we’re going to deploy our .NET application into a Kubernetes cluster.
But how do we do that?
The first step is to create a Docker image for our application. This is known as
“dockerizing” and application, and the process begins with the creation of a Dockerfile.
But first, let’s define some key terms.
Key Terms
What is Docker?
“Docker provides the ability to package and run an application in a loosely isolated environment
called a container. The isolation and security lets you run many containers simultaneously on
a given host. Containers are lightweight and contain everything needed to run the application,
so you don’t need to rely on what’s installed on the host.”
“Containers are isolated processes for each of your app’s components. Each component
…runs in its own isolated environment,
completely isolated from everything else on your machine.”
“A container image is a standardized package that includes all of the files, binaries,
libraries, and configurations to run a container.”
Dockerfile
“A Dockerfile is a text-based document that’s used to create a container image. It provides
instructions to the image builder on the commands to run, files to copy, startup command, and more.”
Create a Dockerfile
Let’s create a file named Dockerfile in the /home/splunk/workshop/docker-k8s-otel/helloworld directory.
cd /home/splunk/workshop/docker-k8s-otel/helloworld
You can use vi or nano to create the file. We will show an example using vi:
vi Dockerfile
Copy and paste the following content into the newly opened file:
Press ‘i’ to enter into insert mode in vi before pasting the text below.
FROM mcr.microsoft.com/dotnet/aspnet:8.0 AS baseUSER appWORKDIR /appEXPOSE 8080FROM mcr.microsoft.com/dotnet/sdk:8.0 AS buildARGBUILD_CONFIGURATION=Release
WORKDIR /srcCOPY["helloworld.csproj", "helloworld/"]RUN dotnet restore "./helloworld/./helloworld.csproj"WORKDIR "/src/helloworld"COPY . .RUN dotnet build "./helloworld.csproj" -c $BUILD_CONFIGURATION -o /app/buildFROM build AS publishARGBUILD_CONFIGURATION=Release
RUN dotnet publish "./helloworld.csproj" -c $BUILD_CONFIGURATION -o /app/publish /p:UseAppHost=falseFROM base AS finalWORKDIR /appCOPY --from=publish /app/publish .ENTRYPOINT["dotnet","helloworld.dll"]
To save your changes in vi, press the esc key to enter command mode, then type :wq! followed by pressing the enter/return key.
What does all this mean? Let’s break it down.
Walking through the Dockerfile
We’ve used a multi-stage Dockerfile for this example, which separates the Docker image creation process into the following stages:
Base
Build
Publish
Final
While a multi-stage approach is more complex, it allows us to create a
lighter-weight runtime image for deployment. We’ll explain the purpose of
each of these stages below.
The Base Stage
The base stage defines the user that will
be running the app, the working directory, and exposes
the port that will be used to access the app.
It’s based off of Microsoft’s mcr.microsoft.com/dotnet/aspnet:8.0 image:
FROM mcr.microsoft.com/dotnet/aspnet:8.0 AS baseUSER appWORKDIR /appEXPOSE 8080
Note that the mcr.microsoft.com/dotnet/aspnet:8.0 image includes the .NET runtime only,
rather than the SDK, so is relatively lightweight. It’s based off of the Debian 12 Linux
distribution. You can find more information about the ASP.NET Core Runtime Docker images
in GitHub.
The Build Stage
The next stage of the Dockerfile is the build stage. For this stage, the
mcr.microsoft.com/dotnet/sdk:8.0 image is used, which is also based off of
Debian 12 but includes the full .NET SDK rather than just the runtime.
This stage copies the .csproj file to the build image, and then uses dotnet restore to
download any dependencies used by the application.
It then copies the application code to the build image and
uses dotnet build to build the project and its dependencies into a
set of .dll binaries:
FROM mcr.microsoft.com/dotnet/sdk:8.0 AS buildARGBUILD_CONFIGURATION=Release
WORKDIR /srcCOPY["helloworld.csproj", "helloworld/"]RUN dotnet restore "./helloworld/./helloworld.csproj"WORKDIR "/src/helloworld"COPY . .RUN dotnet build "./helloworld.csproj" -c $BUILD_CONFIGURATION -o /app/build
The Publish Stage
The third stage is publish, which is based on build stage image rather than a Microsoft image. In this stage, dotnet publish is used to
package the application and its dependencies for deployment:
FROM build AS publishARGBUILD_CONFIGURATION=Release
RUN dotnet publish "./helloworld.csproj" -c $BUILD_CONFIGURATION -o /app/publish /p:UseAppHost=false
The Final Stage
The fourth stage is our final stage, which is based on the base
stage image (which is lighter-weight than the build and publish stages). It copies the output from the publish stage image and
defines the entry point for our application:
FROM base AS finalWORKDIR /appCOPY --from=publish /app/publish .ENTRYPOINT["dotnet","helloworld.dll"]
Build a Docker Image
Now that we have the Dockerfile, we can use it to build a Docker image containing
our application:
docker build -t helloworld:1.0 .
DEPRECATED: The legacy builder is deprecated and will be removed in a future release.
Install the buildx component to build images with BuildKit:
https://docs.docker.com/go/buildx/
Sending build context to Docker daemon 281.1kB
Step 1/19 : FROM mcr.microsoft.com/dotnet/aspnet:8.0 AS base
8.0: Pulling from dotnet/aspnet
af302e5c37e9: Pull complete91ab5e0aabf0: Pull complete1c1e4530721e: Pull complete1f39ca6dcc3a: Pull completeea20083aa801: Pull complete64c242a4f561: Pull completeDigest: sha256:587c1dd115e4d6707ff656d30ace5da9f49cec48e627a40bbe5d5b249adc3549
Status: Downloaded newer image for mcr.microsoft.com/dotnet/aspnet:8.0
---> 0ee5d7ddbc3b
Step 2/19 : USER app
etc,
This tells Docker to build an image using a tag of helloworld:1.0 using the Dockerfile in the current directory.
We can confirm it was created successfully with the following command:
docker images
REPOSITORY   TAG       IMAGE ID       CREATED          SIZE
helloworld   1.0       db19077b9445   20 seconds ago   217MB
Test the Docker Image
Before proceeding, ensure the application we started before is no longer running on your instance.
We can run our application using the Docker image as follows:
Note: we’ve included the --network=host parameter to ensure our Docker container
is able to access resources on our instance, which is important later on when we need
our application to send data to the collector running on localhost.
Let’s ensure that our Docker container is running:
docker ps
$ docker ps
CONTAINER ID IMAGE COMMAND CREATED STATUS PORTS NAMES
5f5b9cd56ac5 helloworld:1.0 "dotnet helloworld.d…"2 mins ago Up 2 mins helloworld
We can access our application as before:
curl http://localhost:8080/hello/Docker
Hello, Docker!
Congratulations, if you’ve made it this far, you’ve successfully Dockerized a .NET application.
Add Instrumentation to Dockerfile
10 minutes
Now that we’ve successfully Dockerized our application, let’s add in OpenTelemetry instrumentation.
This is similar to the steps we took when instrumenting the application running on Linux, but there
are some key differences to be aware of.
Update the Dockerfile
Let’s update the Dockerfile in the /home/splunk/workshop/docker-k8s-otel/helloworld directory.
After the .NET application is built in the Dockerfile, we want to:
Add dependencies needed to download and execute splunk-otel-dotnet-install.sh
Download the Splunk OTel .NET installer
Install the distribution
We can add the following to the build stage of the Dockerfile. Let’s open the Dockerfile in vi:
vi /home/splunk/workshop/docker-k8s-otel/helloworld/Dockerfile
Press the i key to enter edit mode in vi
Paste the lines marked with ‘NEW CODE’ into your Dockerfile in the build stage section:
# CODE ALREADY IN YOUR DOCKERFILE:FROM mcr.microsoft.com/dotnet/sdk:8.0 AS buildARGBUILD_CONFIGURATION=Release
WORKDIR /srcCOPY["helloworld.csproj", "helloworld/"]RUN dotnet restore "./helloworld/./helloworld.csproj"WORKDIR "/src/helloworld"COPY . .RUN dotnet build "./helloworld.csproj" -c $BUILD_CONFIGURATION -o /app/build# NEW CODE: add dependencies for splunk-otel-dotnet-install.shRUN apt-get update &&\
apt-get install -y unzip# NEW CODE: download Splunk OTel .NET installerRUN curl -sSfL https://github.com/signalfx/splunk-otel-dotnet/releases/latest/download/splunk-otel-dotnet-install.sh -O# NEW CODE: install the distributionRUN sh ./splunk-otel-dotnet-install.sh
Next, we’ll update the final stage of the Dockerfile with the following changes:
Copy the /root/.splunk-otel-dotnet/ from the build image to the final image
Copy the entrypoint.sh file as well
Set the OTEL_SERVICE_NAME and OTEL_RESOURCE_ATTRIBUTES environment variables
Set the ENTRYPOINT to entrypoint.sh
It’s easiest to simply replace the entire final stage with the following:
IMPORTANT replace $INSTANCE in your Dockerfile with your instance name,
which can be determined by running echo $INSTANCE.
# CODE ALREADY IN YOUR DOCKERFILEFROM base AS final# NEW CODE: Copy instrumentation file treeWORKDIR "//home/app/.splunk-otel-dotnet"COPY --from=build /root/.splunk-otel-dotnet/ .# CODE ALREADY IN YOUR DOCKERFILEWORKDIR /appCOPY --from=publish /app/publish .# NEW CODE: copy the entrypoint.sh scriptCOPY entrypoint.sh .# NEW CODE: set OpenTelemetry environment variablesENVOTEL_SERVICE_NAME=helloworld
ENVOTEL_RESOURCE_ATTRIBUTES='deployment.environment=otel-$INSTANCE'# NEW CODE: replace the prior ENTRYPOINT command with the following two lines ENTRYPOINT["sh","entrypoint.sh"]CMD["dotnet","helloworld.dll"]
To save your changes in vi, press the esc key to enter command mode, then type :wq! followed by pressing the enter/return key.
After all of these changes, the Dockerfile should look like the following:
IMPORTANT if you’re going to copy and paste this content into your own Dockerfile,
replace $INSTANCE in your Dockerfile with your instance name,
which can be determined by running echo $INSTANCE.
FROM mcr.microsoft.com/dotnet/aspnet:8.0 AS baseUSER appWORKDIR /appEXPOSE 8080FROM mcr.microsoft.com/dotnet/sdk:8.0 AS buildARGBUILD_CONFIGURATION=Release
WORKDIR /srcCOPY["helloworld.csproj", "helloworld/"]RUN dotnet restore "./helloworld/./helloworld.csproj"WORKDIR "/src/helloworld"COPY . .RUN dotnet build "./helloworld.csproj" -c $BUILD_CONFIGURATION -o /app/build# NEW CODE: add dependencies for splunk-otel-dotnet-install.shRUN apt-get update &&\
apt-get install -y unzip# NEW CODE: download Splunk OTel .NET installerRUN curl -sSfL https://github.com/signalfx/splunk-otel-dotnet/releases/latest/download/splunk-otel-dotnet-install.sh -O# NEW CODE: install the distributionRUN sh ./splunk-otel-dotnet-install.shFROM build AS publishARGBUILD_CONFIGURATION=Release
RUN dotnet publish "./helloworld.csproj" -c $BUILD_CONFIGURATION -o /app/publish /p:UseAppHost=falseFROM base AS final# NEW CODE: Copy instrumentation file treeWORKDIR "//home/app/.splunk-otel-dotnet"COPY --from=build /root/.splunk-otel-dotnet/ .WORKDIR /appCOPY --from=publish /app/publish .# NEW CODE: copy the entrypoint.sh scriptCOPY entrypoint.sh .# NEW CODE: set OpenTelemetry environment variablesENVOTEL_SERVICE_NAME=helloworld
ENVOTEL_RESOURCE_ATTRIBUTES='deployment.environment=otel-$INSTANCE'# NEW CODE: replace the prior ENTRYPOINT command with the following two lines ENTRYPOINT["sh","entrypoint.sh"]CMD["dotnet","helloworld.dll"]
Create the entrypoint.sh file
We also need to create a file named entrypoint.sh in the /home/splunk/workshop/docker-k8s-otel/helloworld folder
with the following content:
vi /home/splunk/workshop/docker-k8s-otel/helloworld/entrypoint.sh
Then paste the following code into the newly created file:
#!/bin/sh
# Read in the file of environment settings. /$HOME/.splunk-otel-dotnet/instrument.sh
# Then run the CMDexec"$@"
To save your changes in vi, press the esc key to enter command mode, then type :wq! followed by pressing the enter/return key.
The entrypoint.sh script is required for sourcing environment variables from the instrument.sh script,
which is included with the instrumentation. This ensures the correct setup of environment variables
for each platform.
You may be wondering, why can’t we just include the following command in the Dockerfile to do this,
like we did when activating OpenTelemetry .NET instrumentation on our Linux host?
RUN . $HOME/.splunk-otel-dotnet/instrument.sh
The problem with this approach is that each Dockerfile RUN step runs a new container and a new shell.
If you try to set an environment variable in one shell, it will not be visible later on.
This problem is resolved by using an entry point script, as we’ve done here.
Refer to this Stack Overflow post
for further details on this issue.
Build the Docker Image
Let’s build a new Docker image that includes the OpenTelemetry .NET instrumentation:
docker build -t helloworld:1.1 .
Note: we’ve used a different version (1.1) to distinguish the image from our earlier version.
To clean up the older versions, run the following command to get the container id:
docker ps -a
Then run the following command to delete the container:
docker rm <old container id> --force
Now we can get the container image id:
docker images | grep 1.0
Finally, we can run the following command to delete the old image:
IMPORTANT once these files are copied, open /home/splunk/workshop/docker-k8s-otel/helloworld/Dockerfile with an editor and replace $INSTANCE in your Dockerfile with your instance name,
which can be determined by running echo $INSTANCE.
Introduction to Part 2 of the Workshop
In the next part of the workshop, we want to run the application in Kubernetes,
so we’ll need to deploy the Splunk distribution of the OpenTelemetry Collector
in our Kubernetes cluster.
Let’s define some key terms first.
Key Terms
What is Kubernetes?
“Kubernetes is a portable, extensible, open source platform for managing containerized
workloads and services, that facilitates both declarative configuration and automation.”
NAME: splunk-otel-collector
LAST DEPLOYED: Fri Dec 20 01:01:43 2024NAMESPACE: default
STATUS: deployed
REVISION: 1TEST SUITE: None
NOTES:
Splunk OpenTelemetry Collector is installed and configured to send data to Splunk Observability realm us1.
Confirm the Collector is Running
We can confirm whether the collector is running with the following command:
kubectl get pods
NAME                                                         READY   STATUS    RESTARTS   AGE
splunk-otel-collector-agent-8xvk8                            1/1     Running   0          49s
splunk-otel-collector-k8s-cluster-receiver-d54857c89-tx7qr   1/1     Running   0          49s
Confirm your K8s Cluster is in O11y Cloud
In Splunk Observability Cloud, navigate to Infrastructure -> Kubernetes -> Kubernetes Clusters,
and then search for your cluster name (which is $INSTANCE-cluster):
Deploy Application to K8s
15 minutes
Update the Dockerfile
With Kubernetes, environment variables are typically managed in the .yaml manifest files rather
than baking them into the Docker image. So let’s remove the following two environment variables from the Dockerfile:
vi /home/splunk/workshop/docker-k8s-otel/helloworld/Dockerfile
Then remove the following two environment variables:
To save your changes in vi, press the esc key to enter command mode, then type :wq! followed by pressing the enter/return key.
Build a new Docker Image
Let’s build a new Docker image that excludes the environment variables:
cd /home/splunk/workshop/docker-k8s-otel/helloworld

docker build -t helloworld:1.2 .
Note: we’ve used a different version (1.2) to distinguish the image from our earlier version.
To clean up the older versions, run the following command to get the container id:
docker ps -a
Then run the following command to delete the container:
docker rm <old container id> --force
Now we can get the container image id:
docker images | grep 1.1
Finally, we can run the following command to delete the old image:
docker image rm <old image id>
Import the Docker Image to Kubernetes
Normally we’d push our Docker image to a repository such as Docker Hub.
But for this session, we’ll use a workaround to import it to k3s directly.
cd /home/splunk
# Export the image from dockerdocker save --output helloworld.tar helloworld:1.2
# Import the image into k3ssudo k3s ctr images import helloworld.tar
Deploy the .NET Application
Hint: To enter edit mode in vi, press the ‘i’ key. To save changes, press the esc key to enter command mode, then type :wq! followed by pressing the enter/return key.
To deploy our .NET application to K8s, let’s create a file named deployment.yaml in /home/splunk:
The deployment.yaml file is a kubernetes config file that is used to define a deployment resource. This file is the cornerstone of managing applications in Kubernetes! The deployment config defines the deployment’s desired state and Kubernetes then ensures the actual state matches it. This allows application pods to self-heal and also allows for easy updates or roll backs to applications.
Then, create a second file in the same directory named service.yaml:
A Service in Kubernetes is an abstraction layer, working like a middleman, giving you a fixed IP address or DNS name to access your Pods, which stays the same, even if Pods are added, removed, or replaced over time.
We can then use these manifest files to deploy our application:
# create the deploymentkubectl apply -f deployment.yaml
# create the servicekubectl apply -f service.yaml
deployment.apps/helloworld created
service/helloworld created
Test the Application
To access our application, we need to first get the IP address:
kubectl describe svc helloworld | grep IP:
IP: 10.43.102.103
Then we can access the application by using the Cluster IP that was returned
from the previous command. For example:
curl http://10.43.102.103:8080/hello/Kubernetes
Configure OpenTelemetry
The .NET OpenTelemetry instrumentation was already baked into the Docker image. But we need to set a few
environment variables to tell it where to send the data.
Add the following to deployment.yaml file you created earlier:
IMPORTANT replace $INSTANCE in the YAML below with your instance name,
which can be determined by running echo $INSTANCE.
After a minute or so, you should see traces flowing in the o11y cloud. But, if you want to see your trace sooner, we have …
A Challenge For You
If you are a developer and just want to quickly grab the trace id or see console feedback, what environment variable could you add to the deployment.yaml file?
Click here to see the answer
If you recall in our challenge from Section 4, Instrument a .NET Application with OpenTelemetry, we showed you a trick to write traces to the console using the OTEL_TRACES_EXPORTER environment variable. We can add this variable to our deployment.yaml, redeploy our application, and tail the logs from our helloworld app so that we can grab the trace id to then find the trace in Splunk Observability Cloud. (In the next section of our workshop, we will also walk through using the debug exporter, which is how you would typically debug your application in a K8s environment.)
First, open the deployment.yaml file in vi:
vi deployment.yaml
Then, add the OTEL_TRACES_EXPORTER environment variable:
env:- name:PORTvalue:"8080"- name:NODE_IPvalueFrom:fieldRef:fieldPath:status.hostIP- name:OTEL_EXPORTER_OTLP_ENDPOINTvalue:"http://$(NODE_IP):4318"- name:OTEL_SERVICE_NAMEvalue:"helloworld"- name:OTEL_RESOURCE_ATTRIBUTES value:"deployment.environment=YOURINSTANCE"# NEW VALUE HERE:- name:OTEL_TRACES_EXPORTERvalue:"otlp,console"
Then, in your other terminal window, generate a trace with your curl command. You will see the trace id in the console in which you are tailing the logs. Copy the Activity.TraceId: value and paste it into the Trace search field in APM.
Customize the OpenTelemetry Collector Configuration
20 minutes
We deployed the Splunk Distribution of the OpenTelemetry Collector in our K8s cluster
using the default configuration. In this section, we’ll walk through several examples
showing how to customize the collector config.
Get the Collector Configuration
Before we customize the collector config, how do we determine what the current configuration
looks like?
In a Kubernetes environment, the collector configuration is stored using a Config Map.
We can see which config maps exist in our cluster with the following command:
kubectl get cm -l app=splunk-otel-collector
NAME                                                 DATA   AGE
splunk-otel-collector-otel-k8s-cluster-receiver   1      3h37m
splunk-otel-collector-otel-agent                  1      3h37m
Why are there two config maps?
We can then view the config map of the collector agent as follows:
kubectl describe cm splunk-otel-collector-otel-agent
Name: splunk-otel-collector-otel-agent
Namespace: default
Labels: app=splunk-otel-collector
app.kubernetes.io/instance=splunk-otel-collector
app.kubernetes.io/managed-by=Helm
app.kubernetes.io/name=splunk-otel-collector
app.kubernetes.io/version=0.113.0
chart=splunk-otel-collector-0.113.0
helm.sh/chart=splunk-otel-collector-0.113.0
heritage=Helm
release=splunk-otel-collector
Annotations: meta.helm.sh/release-name: splunk-otel-collector
meta.helm.sh/release-namespace: default
Data====relay:
----
exporters:
otlphttp:
headers:
X-SF-Token: ${SPLUNK_OBSERVABILITY_ACCESS_TOKEN} metrics_endpoint: https://ingest.us1.signalfx.com/v2/datapoint/otlp
traces_endpoint: https://ingest.us1.signalfx.com/v2/trace/otlp
(followed by the rest of the collector config in yaml format)
How to Update the Collector Configuration in K8s
In our earlier example running the collector on a Linux instance,
the collector configuration was available in the /etc/otel/collector/agent_config.yaml file. If we
needed to make changes to the collector config in that case, we’d simply edit this file,
save the changes, and then restart the collector.
In K8s, things work a bit differently. Instead of modifying the agent_config.yaml directly, we’ll
instead customize the collector configuration by making changes to the values.yaml file used to deploy
the helm chart.
The values.yaml file in GitHub
describes the customization options that are available to us.
Let’s look at an example.
Add Infrastructure Events Monitoring
For our first example, let’s enable infrastructure events monitoring for our K8s cluster.
This will allow us to see Kubernetes events as part of the Events Feed section in charts.
The cluster receiver will be configured with a Smart Agent receiver using the kubernetes-events
monitor to send custom events. See Collect Kubernetes events
for further details.
This is done by adding the following line to the values.yaml file:
Hint: steps to open and save in vi are in previous steps.
Release "splunk-otel-collector" has been upgraded. Happy Helming!
NAME: splunk-otel-collector
LAST DEPLOYED: Fri Dec 20 01:17:03 2024NAMESPACE: default
STATUS: deployed
REVISION: 2TEST SUITE: None
NOTES:
Splunk OpenTelemetry Collector is installed and configured to send data to Splunk Observability realm us1.
We can then view the config map and ensure the changes were applied:
kubectl describe cm splunk-otel-collector-otel-k8s-cluster-receiver
Ensure smartagent/kubernetes-events is included in the agent config now:
  smartagent/kubernetes-events:
    alwaysClusterReporter: true
    type: kubernetes-events
    whitelistedEvents:
    - involvedObjectKind: Pod
      reason: Created
    - involvedObjectKind: Pod
      reason: Unhealthy
    - involvedObjectKind: Pod
      reason: Failed
    - involvedObjectKind: Job
      reason: FailedCreate
Note that we specified the cluster receiver config map since that’s
where these particular changes get applied.
Add the Debug Exporter
Suppose we want to see the traces and logs that are sent to the collector, so we can
inspect them before sending them to Splunk. We can use the debug exporter for this purpose, which
can be helpful for troubleshooting OpenTelemetry-related issues.
Let’s add the debug exporter to the bottom of the values.yaml file as follows:
Release "splunk-otel-collector" has been upgraded. Happy Helming!
NAME: splunk-otel-collector
LAST DEPLOYED: Fri Dec 20 01:32:03 2024NAMESPACE: default
STATUS: deployed
REVISION: 3TEST SUITE: None
NOTES:
Splunk OpenTelemetry Collector is installed and configured to send data to Splunk Observability realm us1.
Exercise the application a few times using curl, then tail the agent collector logs with the
following command:
kubectl logs -l component=otel-collector-agent -f
You should see traces written to the agent collector logs such as the following:
If you return to Splunk Observability Cloud though, you’ll notice that traces and logs are
no longer being sent there by the application.
Why do you think that is? We’ll explore it in the next section.
Troubleshoot OpenTelemetry Collector Issues
20 minutes
In the previous section, we added the debug exporter to the collector configuration,
and made it part of the pipeline for traces and logs. We see the debug output
written to the agent collector logs as expected.
However, traces are no longer sent to o11y cloud. Let’s figure out why and fix it.
Review the Collector Config
Whenever a change to the collector config is made via a values.yaml file, it’s helpful
to review the actual configuration applied to the collector by looking at the config map:
kubectl describe cm splunk-otel-collector-otel-agent
Let’s review the pipelines for logs and traces in the agent collector config. They should look
like this:
Do you see the problem? Only the debug exporter is included in the traces and logs pipelines.
The otlphttp and signalfx exporters that were present in the traces pipeline configuration previously are gone.
This is why we no longer see traces in o11y cloud. And for the logs pipeline, the splunk_hec/platform_logs
exporter has been removed.
How did we know what specific exporters were included before? To find out,
we could have reverted our earlier customizations and then checked the config
map to see what was in the traces pipeline originally. Alternatively, we can refer
to the examples in the GitHub repo for splunk-otel-collector-chart
which shows us what default agent config is used by the Helm chart.
How did these exporters get removed?
Let’s review the customizations we added to the values.yaml file:
When we applied the values.yaml file to the collector using helm upgrade, the
custom configuration got merged with the previous collector configuration.
When this happens, the sections of the yaml configuration that contain lists,
such as the list of exporters in the pipeline section, get replaced with what we
included in the values.yaml file (which was only the debug exporter).
Let’s Fix the Issue
So when customizing an existing pipeline, we need to fully redefine that part of the configuration.
Our values.yaml file should thus be updated as follows:
The Splunk Distribution of OpenTelemetry .NET automatically exports logs enriched with tracing context
from applications that use Microsoft.Extensions.Logging for logging (which our sample app does).
Application logs are enriched with tracing metadata and then exported to a local instance of
the OpenTelemetry Collector in OTLP format.
Let’s take a closer look at the logs that were captured by the debug exporter to see if that’s happening. To tail the collector logs, we can use the following command:
kubectl logs -l component=otel-collector-agent -f
Once we’re tailing the logs, we can use curl to generate some more traffic. Then we should see
something like the following:
In this example, we can see that the Trace ID and Span ID were automatically written to the log output
by the OpenTelemetry .NET instrumentation. This allows us to correlate logs with traces in
Splunk Observability Cloud.
You might remember though that if we deploy the OpenTelemetry collector in a K8s cluster using Helm,
and we include the log collection option, then the OpenTelemetry collector will use the File Log receiver
to automatically capture any container logs.
This would result in duplicate logs being captured for our application. For example, in the following screenshot we
can see two log entries for each request made to our service:
How do we avoid this?
Avoiding Duplicate Logs in K8s
To avoid capturing duplicate logs, we have one of two options:
We can set the OTEL_LOGS_EXPORTER environment variable to none, to tell the Splunk Distribution of OpenTelemetry .NET to avoid exporting logs to the collector using OTLP.
We can manage log ingestion using annotations.
Option 1
Setting the OTEL_LOGS_EXPORTER environment variable to none is straightforward. However, the Trace ID and Span ID are not written to the stdout logs generated by the application,
which would prevent us from correlating logs with traces.
To resolve this, we could define a custom logger, such as the example defined in /home/splunk/workshop/docker-k8s-otel/helloworld/SplunkTelemetryConfigurator.cs.
We could include this in our application by updating the Program.cs file as follows:
Option 2 requires updating the deployment manifest for the application
to include an annotation. In our case, we would edit the deployment.yaml file to add the
splunk.com/exclude annotation as follows:
To run this workshop on your own in the future, refer back to these instructions and use the Splunk4Rookies - Observability
workshop template in Splunk Show to provision an EC2 instance.
Solving Problems with O11y Cloud
2 minutesAuthor
Derek Mitchell
In this workshop, you’ll get hands-on experience with the following:
Deploy the OpenTelemetry Collector and customize the collector config
Deploy an application and instrument it with OpenTelemetry
See how tags are captured using an OpenTelemetry SDK
Create a Troubleshooting MetricSet
Troubleshoot a problem and determine root cause using Tag Spotlight
Let’s get started!
Tip
The easiest way to navigate through this workshop is by using:
the left/right arrows (< | >) on the top right of this page
the left (◀️) and right (▶️) cursor keys on your keyboard
Subsections of Solving Problems with O11y Cloud
Connect to EC2 Instance
5 minutes
Connect to your EC2 Instance
We’ve prepared an Ubuntu Linux instance in AWS/EC2 for each attendee.
Using the IP address and password provided by your instructor, connect to your EC2 instance
using one of the methods below:
Mac OS / Linux
ssh splunk@IP address
Windows 10+
Use the OpenSSH client
Earlier versions of Windows
Use Putty
Editing Files
We’ll use vi to edit files during the workshop. Here’s a quick primer.
To open a file for editing:
vi <filename>
To edit the file, click i to switch to Insert mode and begin entering text as normal. Use Esc to return to Command mode.
To save your changes without exiting the editor, enter Esc to return to command mode then enter :w.
To exit the editor without saving changes, enter Esc to return to command mode then enter :q!.
To save your changes and exist the editor, enter Esc to return to command mode then enter :wq.
If you’d prefer using another editor, you can use nano instead:
nano <filename>
Deploy the OpenTelemetry Collector and Customize Config
15 minutes
The first step to “getting data in” is to deploy an OpenTelemetry collector,
which receives and processes telemetry data in our environment before exporting it to Splunk
Observability Cloud.
We’ll be using Kubernetes for this workshop, and will deploy the collector in our K8s cluster using Helm.
What is Helm?
Helm is a package manager for Kubernetes which provides the following benefits:
Manage Complexity
deal with a single values.yaml file rather than dozens of manifest files
Easy Updates
in-place upgrades
Rollback support
Just use helm rollback to roll back to an older version of a release
Install the Collector using Helm
Let’s change into the correct directory and run a script to install the collector:
cd /home/splunk/workshop/tagging
./1-deploy-otel-collector.sh
"splunk-otel-collector-chart" has been added to your repositories
Hang tight while we grab the latest from your chart repositories...
...Successfully got an update from the "splunk-otel-collector-chart" chart repository
Update Complete. ⎈Happy Helming!⎈
NAME: splunk-otel-collector
LAST DEPLOYED: Mon Dec 23 18:47:38 2024NAMESPACE: default
STATUS: deployed
REVISION: 1NOTES:
Splunk OpenTelemetry Collector is installed and configured to send data to Splunk Observability realm us1.
Note that the script may take a minute or so to run.
How did this script install the collector? It first ensured that the environment variables set in the ~./profile file are read:
Important: there’s no need to run the following commands, as they were already run
by the 1-deploy-otel-collector.sh script.
source ~/.profile
It then installed the splunk-otel-collector-chart Helm chart and ensured it’s up-to-date:
Note that the helm install command references a values.yaml file, which is used
to customize the collector configuration. We’ll explore this is more detail below.
Confirm the Collector is Running
We can confirm whether the collector is running with the following command:
In Splunk Observability Cloud, navigate to Infrastructure -> Kubernetes -> Kubernetes Clusters,
and then search for your Cluster Name (which is $INSTANCE-k3s-cluster):
Get the Collector Configuration
Before we customize the collector config, how do we determine what the current configuration
looks like?
In a Kubernetes environment, the collector configuration is stored using a Config Map.
We can see which config maps exist in our cluster with the following command:
kubectl get cm -l app=splunk-otel-collector
NAME                                                 DATA   AGE
splunk-otel-collector-otel-k8s-cluster-receiver   1      3h37m
splunk-otel-collector-otel-agent                  1      3h37m
We can then view the config map of the collector agent as follows:
kubectl describe cm splunk-otel-collector-otel-agent
Name: splunk-otel-collector-otel-agent
Namespace: default
Labels: app=splunk-otel-collector
app.kubernetes.io/instance=splunk-otel-collector
app.kubernetes.io/managed-by=Helm
app.kubernetes.io/name=splunk-otel-collector
app.kubernetes.io/version=0.113.0
chart=splunk-otel-collector-0.113.0
helm.sh/chart=splunk-otel-collector-0.113.0
heritage=Helm
release=splunk-otel-collector
Annotations: meta.helm.sh/release-name: splunk-otel-collector
meta.helm.sh/release-namespace: default
Data====relay:
----
exporters:
otlphttp:
headers:
X-SF-Token: ${SPLUNK_OBSERVABILITY_ACCESS_TOKEN} metrics_endpoint: https://ingest.us1.signalfx.com/v2/datapoint/otlp
traces_endpoint: https://ingest.us1.signalfx.com/v2/trace/otlp
(followed by the rest of the collector config in yaml format)
How to Update the Collector Configuration in K8s
We can customize the collector configuration in K8s using the values.yaml file.
See this file
for a comprehensive list of customization options that are available in the values.yaml file.
Let’s look at an example.
Add the Debug Exporter
Suppose we want to see the traces that are sent to the collector. We can use the debug exporter for this purpose, which can be helpful for troubleshooting OpenTelemetry-related issues.
You can use vi or nano to edit the values.yaml file. We will show an example using vi:
vi /home/splunk/workshop/tagging/otel/values.yaml
Add the debug exporter by copying and pasting the following text
to the bottom of the values.yaml file:
Press ‘i’ to enter into insert mode in vi before adding the text below.
# NEW CONTENTexporters:debug:verbosity:detailedservice:pipelines:traces:exporters:- sapm- signalfx- debug
After these changes, the values.yaml file should include the following contents:
Release "splunk-otel-collector" has been upgraded. Happy Helming!
NAME: splunk-otel-collector
LAST DEPLOYED: Mon Dec 23 19:08:08 2024NAMESPACE: default
STATUS: deployed
REVISION: 2NOTES:
Splunk OpenTelemetry Collector is installed and configured to send data to Splunk Observability realm us1.
Whenever a change to the collector config is made via a values.yaml file, it’s helpful
to review the actual configuration applied to the collector by looking at the config map:
kubectl describe cm splunk-otel-collector-otel-agent
We can see that the debug exporter was added to the traces pipeline as desired:
traces:exporters:- sapm- signalfx- debug
We’ll explore the output of the debug exporter once we deploy an application
in our cluster and start capturing traces.
Deploy the Sample Application and Instrument with OpenTelemetry
15 minutes
At this point, we’ve deployed an OpenTelemetry collector in our K8s cluster, and it’s
successfully collecting infrastructure metrics.
The next step is to deploy a sample application and instrument
with OpenTelemetry to capture traces.
We’ll use a microservices-based application written in Python. To keep the workshop simple,
we’ll focus on two services: a credit check service and a credit processor service.
Deploy the Application
To save time, we’ve built Docker images for both of these services already which are available in Docker Hub.
We can deploy the credit check service in our K8s cluster with the following command:
We’ll provide an overview of the application in this section. If you’d like to see the complete source
code for the application, refer to the Observability Workshop repository in GitHub
OpenTelemetry Instrumentation
If we look at the Dockerfile’s used to build the credit check and credit processor services, we
can see that they’ve already been instrumented with OpenTelemetry. For example, let’s look at
/home/splunk/workshop/tagging/creditcheckservice-py-with-tags/Dockerfile:
FROM python:3.11-slim# Set working directoryWORKDIR /app# Copy requirements overCOPY requirements.txt .RUN apt-get update && apt-get install --yes gcc python3-devENVPIP_ROOT_USER_ACTION=ignore
# Install Python dependenciesRUN pip install --no-cache-dir -r requirements.txt# Copy main appCOPY main.py .# Bootstrap OTelRUN splunk-py-trace-bootstrap# Set the entrypoint command to run the applicationCMD["splunk-py-trace","python3","main.py"]
We can see that splunk-py-trace-bootstrap was included, which installs OpenTelemetry instrumentation
for supported packages used by our applications. We can also see that splunk-py-trace is used as part
of the command to start the application.
And if we review the /home/splunk/workshop/tagging/creditcheckservice-py-with-tags/requirements.txt file,
we can see that splunk-opentelemetry[all] was included in the list of packages.
Finally, if we review the Kubernetes manifest that we used to deploy this service (/home/splunk/workshop/tagging/creditcheckservice-py-with-tags/creditcheckservice-dockerhub.yaml),
we can see that environment variables were set in the container to tell OpenTelemetry
where to export OTLP data to:
This is all that’s needed to instrument the service with OpenTelemetry!
Explore the Application
We’ve captured several custom tags with our application, which we’ll explore shortly. Before we do that, let’s
introduce the concept of tags and why they’re important.
What are tags?
Tags are key-value pairs that provide additional metadata about spans in a trace, allowing you to enrich the context of the spans you send to Splunk APM.
For example, a payment processing application would find it helpful to track:
The payment type used (i.e. credit card, gift card, etc.)
The ID of the customer that requested the payment
This way, if errors or performance issues occur while processing the payment, we have the context we need for troubleshooting.
While some tags can be added with the OpenTelemetry collector, the ones we’ll be working with in this workshop are more granular, and are added by application developers using the OpenTelemetry SDK.
Why are tags so important?
Tags are essential for an application to be truly observable. They add the context to the traces to help us
understand why some users get a great experience and others don’t. And powerful features in
Splunk Observability Cloud utilize tags to help you jump quickly to root cause.
A note about terminology before we proceed. While we discuss tags in this workshop,
and this is the terminology we use in Splunk Observability Cloud, OpenTelemetry
uses the term attributes instead. So when you see tags mentioned throughout this
workshop, you can treat them as synonymous with attributes.
How are tags captured?
To capture tags in a Python application, we start by importing the trace module by adding an
import statement to the top of the /home/splunk/workshop/tagging/creditcheckservice-py-with-tags/main.py file:
importrequestsfromflaskimportFlask,requestfromwaitressimportservefromopentelemetryimporttrace# <--- ADDED BY WORKSHOP...
Next, we need to get a reference to the current span so we can add an attribute (aka tag) to it:
defcredit_check():current_span=trace.get_current_span()# <--- ADDED BY WORKSHOPcustomerNum=request.args.get('customernum')current_span.set_attribute("customer.num",customerNum)# <--- ADDED BY WORKSHOP...
That was pretty easy, right? We’ve captured a total of four tags in the credit check service, with the final result looking like this:
defcredit_check():current_span=trace.get_current_span()# <--- ADDED BY WORKSHOPcustomerNum=request.args.get('customernum')current_span.set_attribute("customer.num",customerNum)# <--- ADDED BY WORKSHOP# Get Credit ScorecreditScoreReq=requests.get("http://creditprocessorservice:8899/getScore?customernum="+customerNum)creditScoreReq.raise_for_status()creditScore=int(creditScoreReq.text)current_span.set_attribute("credit.score",creditScore)# <--- ADDED BY WORKSHOPcreditScoreCategory=getCreditCategoryFromScore(creditScore)current_span.set_attribute("credit.score.category",creditScoreCategory)# <--- ADDED BY WORKSHOP# Run Credit CheckcreditCheckReq=requests.get("http://creditprocessorservice:8899/runCreditCheck?customernum="+str(customerNum)+"&score="+str(creditScore))creditCheckReq.raise_for_status()checkResult=str(creditCheckReq.text)current_span.set_attribute("credit.check.result",checkResult)# <--- ADDED BY WORKSHOPreturncheckResult
Review Trace Data
Before looking at the trace data in Splunk Observability Cloud,
let’s review what the debug exporter has captured by tailing the agent collector logs with the following command:
kubectl logs -l component=otel-collector-agent -f
Hint: use CTRL+C to stop tailing the logs.
You should see traces written to the agent collector logs such as the following:
InstrumentationScope opentelemetry.instrumentation.flask 0.44b0
Span #0
Trace ID : 9f9fc109903f25ba57bea9b075aa4833
Parent ID :
ID : 6d71519f454f6059
Name : /check
Kind : Server
Start time : 2024-12-23 19:55:25.815891965 +0000 UTC
End time : 2024-12-23 19:55:27.824664949 +0000 UTC
Status code : Unset
Status message :
Attributes:
-> http.method: Str(GET)
-> http.server_name: Str(waitress.invalid)
-> http.scheme: Str(http)
-> net.host.port: Int(8888)
-> http.host: Str(creditcheckservice:8888)
-> http.target: Str(/check?customernum=30134241)
-> net.peer.ip: Str(10.42.0.19)
-> http.user_agent: Str(python-requests/2.31.0)
-> net.peer.port: Str(47248)
-> http.flavor: Str(1.1)
-> http.route: Str(/check)
-> customer.num: Str(30134241)
-> credit.score: Int(443)
-> credit.score.category: Str(poor)
-> credit.check.result: Str(OK)
-> http.status_code: Int(200)
Notice how the trace includes the tags (aka attributes) that we captured in the code, such as
credit.score and credit.score.category. We’ll use these in the next section, when
we analyze the traces in Splunk Observability Cloud to find the root cause of a performance issue.
Create a Troubleshooting MetricSet
5 minutes
Index Tags
To use advanced features in Splunk Observability Cloud such as Tag Spotlight, we’ll need to first index one or more tags.
To do this, navigate to Settings -> MetricSets and ensure the APM tab is selected. Then click the + Add Custom MetricSet button.
Let’s index the credit.score.category tag by entering the following details (note: since everyone in the workshop is using the same organization, the instructor will do this step on your behalf):
Click Start Analysis to proceed.
The tag will appear in the list of Pending MetricSets while analysis is performed.
Once analysis is complete, click on the checkmark in the Actions column.
Troubleshooting vs. Monitoring MetricSets
You may have noticed that, to index this tag, we created something called a Troubleshooting MetricSet. It’s named this way because a Troubleshooting MetricSet, or TMS, allows us to troubleshoot issues with this tag using features such as Tag Spotlight.
You may have also noticed that there’s another option which we didn’t choose called a Monitoring MetricSet (or MMS). Monitoring MetricSets go beyond troubleshooting and allow us to use tags for alerting and dashboards. While we won’t be
exploring this capability as part of this workshop, it’s a powerful feature that I encourage you to explore on your own.
Troubleshoot a Problem Using Tag Spotlight
15 minutes
Explore APM Data
Let’s explore some of the APM data we’ve captured to see how our application is performing.
Navigate to APM, then use the Environment dropdown to select your environment (i.e. tagging-workshop-instancename).
You should see creditprocessorservice and creditcheckservice displayed in the list of services:
Click on Service Map on the right-hand side to view the service map. We can see that the creditcheckservice makes calls to the creditprocessorservice, with an average response time of at least 3 seconds:
Next, click on Traces on the right-hand side to see the traces captured for this application. You’ll see that some traces run relatively fast (i.e. just a few milliseconds), whereas others take a few seconds.
Click on one of the longer running traces. In this example, the trace took five seconds, and we can see that most of the time was spent calling the /runCreditCheck operation, which is part of the creditprocessorservice:
But why are some traces slow, and others are relatively quick?
Close the trace and return to the Trace Analyzer. If you toggle Errors only to on, you’ll also notice that some traces have errors:
If we look at one of the error traces, we can see that the error occurs when the creditprocessorservice attempts to call another service named otherservice. But why do some requests result in a call to otherservice, and others don’t?
To determine why some requests perform slowly, and why some requests result in errors, we could look through the
traces one by one and try to find a pattern behind the issues.
Splunk Observability Cloud provides a better way to find the root cause of an issue. We’ll explore this next.
Using Tag Spotlight
Since we indexed the credit.score.category tag, we can use it with Tag Spotlight to troubleshoot our application.
Navigate to APM then click on Tag Spotlight on the right-hand side. Ensure the creditcheckservice service is selected from the Service drop-down (if not already selected).
With Tag Spotlight, we can see 100% of credit score requests that result in a score of impossible have an error, yet requests for all other credit score types have no errors at all!
This illustrates the power of Tag Spotlight! Finding this pattern would be time-consuming without it, as we’d have to manually look through hundreds of traces to identify the pattern (and even then, there’s no guarantee we’d find it).
We’ve looked at errors, but what about latency? Let’s click on the Requests & errors distribution dropdown and change it to Latency distribution.
IMPORTANT: Click on the settings icon beside Cards display to add the P50 and P99 metrics.
Here, we can see that the requests with a poor credit score request are running slowly, with P50, P90, and P99 times of around 3 seconds, which is too long for our users to wait, and much slower than other requests.
We can also see that some requests with an exceptional credit score request are running slowly, with P99 times of around 5 seconds, though the P50 response time is relatively quick.
Using Dynamic Service Maps
Now that we know the credit score category associated with the request can impact performance and error rates, let’s explore another feature that utilizes indexed tags: Dynamic Service Maps.
With Dynamic Service Maps, we can breakdown a particular service by a tag. For example, let’s click on APM, then click Service Map to view the service map.
Click on creditcheckservice. Then, on the right-hand menu, click on the drop-down that says Breakdown, and select the credit.score.category tag.
At this point, the service map is updated dynamically, and we can see the performance of requests hitting creditcheckservice broken down by the credit score category:
This view makes it clear that performance for good and fair credit scores is excellent, while poor and exceptional scores are much slower, and impossible scores result in errors.
Our Findings
Tag Spotlight has uncovered several interesting patterns for the engineers that own this service to explore further:
Why are all the impossible credit score requests resulting in error?
Why are all the poor credit score requests running slowly?
Why do some of the exceptional requests run slowly?
As an SRE, passing this context to the engineering team would be extremely helpful for their investigation, as it would allow them to track down the issue much more quickly than if we simply told them that the service was “sometimes slow”.
If you’re curious, have a look at the source code for the creditprocessorservice. You’ll see that requests with impossible, poor, and exceptional credit scores are handled differently, thus resulting in the differences in error rates and latency that we uncovered.
The behavior we saw with our application is typical for modern cloud-native applications, where different inputs passed to a service lead to different code paths, some of which result in slower performance or errors. For example, in a real credit check service, requests resulting in low credit scores may be sent to another downstream service to further evaluate risk, and may perform more slowly than requests resulting in higher scores, or encounter higher error rates.
Summary
2 minutes
This workshop provided hands-on experience with the following concepts:
How to deploy the Splunk Distribution of the OpenTelemetry Collector using Helm.
How to capture tags of interest from your application using an OpenTelemetry SDK.
How to index tags in Splunk Observability Cloud using Troubleshooting MetricSets.
How to utilize tags in Splunk Observability Cloud to find “unknown unknowns” using the Tag Spotlight and Dynamic Service Map features.
Collecting tags aligned with the best practices shared in this workshop will let you get even more value from the data you’re sending to Splunk Observability Cloud. Now that you’ve completed this workshop, you have the knowledge you need to start collecting tags from your own applications!
The goal of this workshop is to help you become comfortable creating and modifying OpenTelemetry Collector configuration files. You’ll start with a minimal agent.yaml file and gradually configure several common advanced scenarios.
The workshop also explores how to configure the OpenTelemetry Collector to store telemetry data locally instead of transmitting it to a third-party vendor backend. Furthermore, this approach significantly enhances the debugging and troubleshooting process and is useful for testing and development environments where you don’t want to send data to a production system.
To get the most out of this workshop, you should have a basic understanding of the OpenTelemetry Collector and its configuration file format. Additionally, proficiency in editing YAML files is required. The entire workshop is designed to run locally.
Workshop Overview
During this workshop, we will cover the following topics:
Setting up the agent locally: Add metadata, and introduce the debug and file exporters.
Configuring a gateway: Route traffic from the agent to the gateway.
Configuring the Filelog receiver: Collect log data from various log files.
Enhancing agent resilience: Basic configurations for fault tolerance.
Configuring processors:
Filter out noise by dropping specific spans (e.g., health checks).
Remove unnecessary tags, and handle sensitive data.
Transform data using OTTL in the pipeline before exporting.
Configuring Connectors: Route data to different endpoints based on the values received.
By the end of this workshop, you’ll be familiar with configuring the OpenTelemetry Collector for a variety of real-world use cases.
Prerequisites
Create a directory on your machine for the workshop (e.g., advanced-otel). We will refer to this directory as [WORKSHOP] in the instructions.
Download the latest OpenTelemetry Collector release for your platform and place it in the [WORKSHOP] directory:
Mac users must trust the executable when running otelcol for the first time. For more details, refer to Apple’s support page.
Optional Tools
For this workshop, using a good YAML editor like Visual Studio Code will be beneficial.
Additionally, having access to jq is recommended. This lightweight command-line tool helps process and format JSON data, making it easier to inspect traces, metrics, and logs from the OpenTelemetry Collector.
Subsections of Advanced OpenTelemetry
1. Agent Configuration
10 minutes
Tip
During this workshop, you will be using up to four terminal windows simultaneously. To stay organized, consider customizing each terminal or shell with unique names and colors. This will help you quickly identify and switch between them as needed.
We will refer to these terminals as: Agent, Gateway, Tests and Log-gen.
Exercise
In your [WORKSHOP] directory, create a subdirectory called 1-agent and change into that directory.
cd [WORKSHOP]
mkdir 1-agent
cd 1-agent
In the 1-agent directory, create a file named agent.yaml. This file will define the basic structure of an OpenTelemetry Collector configuration.
Copy and paste the following initial configuration into agent.yaml:
########################### This section holds all the## Configuration section ## configurations that can be ########################### used in this OpenTelemetry Collectorextensions:# Array of Extensionshealth_check:# Configures the health check extensionendpoint:0.0.0.0:13133# Endpoint to collect health check datareceivers:# Array of Receivershostmetrics:# Receiver Typecollection_interval:3600s # Scrape metrics every hourscrapers:# Array of hostmetric scraperscpu:# Scraper for cpu metricsexporters:# Array of Exportersprocessors:# Array of Processorsmemory_limiter:# Limits memory usage by Collectors pipelinecheck_interval:2s # Interval to check memory usagelimit_mib:512# Memory limit in MiB########################### This section controls what### Activation Section ### configurations will be used########################### by this OpenTelemetry Collectorservice:# Services configured for this Collectorextensions:# Enabled extensions- health_checkpipelines:# Array of configured pipelinestraces:receivers:processors:- memory_limiter # Memory Limiter processorexporters:metrics:receivers:processors:- memory_limiter # Memory Limiter processorexporters:logs:receivers:processors:- memory_limiter # Memory Limiter processorexporters:
Let’s walk through a few modifications to our agent configuration to get things started:
Exercise
Add an otlp receiver: The OTLP receiver will listen for incoming telemetry data over HTTP (or gRPC).
otlp:# Receiver Typeprotocols:# list of Protocols used http:# This wil enable the HTTP Protocolendpoint:"0.0.0.0:4318"# Endpoint for incoming telemetry data
Add a debug exporter: The Debug exporter will output detailed debug information for every telemetry record.
Update Pipelines: Ensure that the otlp receiver, memory_limiter processor, and debug exporter are added to the pipelines for traces, metrics, and logs. You can choose to use the format below or use array brackets [memory_limiter]:
During this workshop, we will use otelbin.io to quickly validate YAML syntax and ensure OpenTelemetry configurations are correct. This helps prevent errors before running tests during this workshop.
To validate your configuration:
Open otelbin.io and replace the existing configuration by pasting your own YAML into the left pane.
At the top of the page, ensure that Splunk OpenTelemetry Collector is selected as the validation target.
Once validated, refer to the image representation below to verify if your pipelines are correctly set up.
In most cases, we will display only the key pipeline. However, if all three pipelines (Traces, Metrics, and Logs) share the same structure, we will indicate this instead of displaying each one separately.
%%{init:{"fontFamily":"monospace"}}%%
graph LR
%% Nodes
REC1( otlp <br>fa:fa-download):::receiver
PRO1(memory_limiter<br>fa:fa-microchip):::processor
EXP1( debug <br>fa:fa-upload):::exporter
%% Links
subID1:::sub-traces
subgraph " "
subgraph subID1[**Traces/Metrics/Logs**]
direction LR
REC1 --> PRO1
PRO1 --> EXP1
end
end
classDef receiver,exporter fill:#8b5cf6,stroke:#333,stroke-width:1px,color:#fff;
classDef processor fill:#6366f1,stroke:#333,stroke-width:1px,color:#fff;
classDef con-receive,con-export fill:#45c175,stroke:#333,stroke-width:1px,color:#fff;
classDef sub-traces stroke:#fff,stroke-width:1px, color:#fff,stroke-dasharray: 3 3;
1.2 Test Agent Configuration
Once you’ve updated the configuration, you’re ready to proceed to running the OpenTelemetry Collector with your new setup. This exercise sets the foundation for understanding how data flows through the OpenTelemetry Collector.
Exercise
Find your Agent terminal window:
Change into the [WORKSHOP]/1-agent folder
Run the following command:
../otelcol --config=agent.yaml
In this workshop, we use macOS/Linux commands by default. If you’re using Windows, adjust the commands as needed i.e. use ./otelcol.exe.
Note
On Windows, a dialog box may appear asking if you want to grant public and private network access to otelcol.exe. Click “Allow” to proceed.
Exercise
Verify debug output: If everything is set up correctly, the first and last lines of the output should display:
2025/01/13T12:43:51 settings.go:478: Set config to [agent.yaml]
<snip to the end>
2025-01-13T12:43:51.747+0100 info service@v0.117.0/service.go:261 Everything is ready. Begin running and processing data.
Create a test span file:
Instead of instrumenting an application, we will simulate sending trace data to the OpenTelemetry Collector using cURL. The trace data, formatted in JSON, represents what an instrumentation library would typically generate and send.
Find your Tests Terminal window and change into the [WORKSHOP]/1-agent directory.
Copy and paste the following span data into a new file named trace.json:
This file will allow us to test how the OpenTelemetry Collector processes and send spans that are part of a trace, without requiring actual application instrumentation.
{"resourceSpans":[{"resource":{"attributes":[{"key":"service.name","value":{"stringValue":"my.service"}},{"key":"deployment.environment","value":{"stringValue":"my.environment"}}]},"scopeSpans":[{"scope":{"name":"my.library","version":"1.0.0","attributes":[{"key":"my.scope.attribute","value":{"stringValue":"some scope attribute"}}]},"spans":[{"traceId":"5B8EFFF798038103D269B633813FC60C","spanId":"EEE19B7EC3C1B174","parentSpanId":"EEE19B7EC3C1B173","name":"I'm a server span","startTimeUnixNano":"1544712660000000000","endTimeUnixNano":"1544712661000000000","kind":2,"attributes":[{"key":"user.name","value":{"stringValue":"George Lucas"}},{"key":"user.phone_number","value":{"stringValue":"+1555-867-5309"}},{"key":"user.email","value":{"stringValue":"george@deathstar.email"}},{"key":"user.account_password","value":{"stringValue":"LOTR>StarWars1-2-3"}},{"key":"user.visa","value":{"stringValue":"4111 1111 1111 1111"}},{"key":"user.amex","value":{"stringValue":"3782 822463 10005"}},{"key":"user.mastercard","value":{"stringValue":"5555 5555 5555 4444"}}]}]}]}]}
Send a test span: Run the following command to send a span to the agent:
curl -X POST -i http://localhost:4318/v1/traces -H "Content-Type: application/json" -d "@trace.json"
HTTP/1.1 200 OK
Content-Type: application/json
Date: Mon, 27 Jan 2025 09:51:02 GMT
Content-Length: 21
{"partialSuccess":{}}%
Info
HTTP/1.1 200 OK: Confirms the request was processed successfully.
{"partialSuccess":{}}: Indicates 100% success, as the field is empty. In case of a partial failure, this field will include details about any failed parts.
Note
On Windows, you may encounter the following error:
2025-02-03T12:46:25.675+0100 info ResourceSpans #0
Resource SchemaURL:
Resource attributes:
-> service.name: Str(my.service)
-> deployment.environment: Str(my.environment)
ScopeSpans #0
ScopeSpans SchemaURL:
InstrumentationScope my.library 1.0.0
InstrumentationScope attributes:
-> my.scope.attribute: Str(some scope attribute)
Span #0
Trace ID : 5b8efff798038103d269b633813fc60c
Parent ID : eee19b7ec3c1b173
ID : eee19b7ec3c1b174
Name : I'm a server span
Kind : Server
Start time : 2018-12-13 14:51:00 +0000 UTC
End time : 2018-12-13 14:51:01 +0000 UTC
Status code : Unset
Status message :
Attributes:
-> user.name: Str(George Lucas)
-> user.phone_number: Str(+1555-867-5309)
-> user.email: Str(george@deathstar.email)
-> user.account_password: Str(LOTR>StarWars1-2-3)
-> user.visa: Str(4111 1111 1111 1111)
-> user.amex: Str(3782 822463 10005)
-> user.mastercard: Str(5555 5555 5555 4444)
{"kind": "exporter", "data_type": "traces", "name": "debug"}
1.3 File Exporter
To capture more than just debug output on the screen, we also want to generate output during the export phase of the pipeline. For this, we’ll add a File Exporter to write OTLP data to files for comparison. The difference between the OpenTelemetry debug exporter and the file exporter lies in their purpose and output destination:
Feature
Debug Exporter
File Exporter
Output Location
Console/Log
File on disk
Purpose
Real-time debugging
Persistent offline analysis
Best for
Quick inspection during testing
Temporary storage and sharing
Production Use
No
Rare, but possible
Persistence
No
Yes
In summary, the Debug Exporter is great for real-time, in-development troubleshooting, while the File Exporter is better suited for storing telemetry data locally for later use.
Exercise
Find your Agent terminal window, and stop the running collector by pressing Ctrl-C. Once the Agent has stopped, open the agent.yaml and configure the File Exporter:
Configuring a file exporter: The File Exporter writes telemetry data to files on disk.
file:# Exporter Typepath:"./agent.out"# Save path (OTLP JSON)append:false# Overwrite the file each time
Update the Pipelines Section: Add the file exporter to the metrics, traces and logs pipelines (leave debug as the first in the array).
Validate the agent configuration using otelbin.io:
flowchart LR
%% Nodes
REC1( otlp <br>fa:fa-download):::receiver
PRO1(memory_limiter<br>fa:fa-microchip):::processor
EXP1( debug <br>fa:fa-upload):::exporter
EXP2(  file  <br>fa:fa-upload):::exporter
%% Links
subID1:::sub-traces
subgraph " "
subgraph subID1[**Traces/Metrics/Logs**]
direction LR
REC1 --> PRO1
PRO1 --> EXP1
PRO1 --> EXP2
end
end
classDef receiver,exporter fill:#8b5cf6,stroke:#333,stroke-width:1px,color:#fff;
classDef processor fill:#6366f1,stroke:#333,stroke-width:1px,color:#fff;
classDef con-receive,con-export fill:#45c175,stroke:#333,stroke-width:1px,color:#fff;
classDef sub-traces stroke:#fff,stroke-width:1px, color:#fff,stroke-dasharray: 3 3;
Subsections of 1.3. File Exporter
1.3.1 Test File Exporter
Exercise
Restart your agent: Find your Agent terminal window, and (re)start the agent, this time with your new config to test it:
../otelcol --config=agent.yaml
Again, if you have done everything correctly, the last line of the output should be:
2025-01-13T12:43:51.747+0100 info service@v0.116.0/service.go:261 Everything is ready. Begin running and processing data.
Send a Trace:
From the Test terminal window send another span.
Verify you get the same output on the console as we saw previously:
curl -X POST -i http://localhost:4318/v1/traces -H "Content-Type: application/json" -d "@trace.json"
Verify that the agent.out file is written: Check that a file named agent.out is written in the current directory.
[WORKSHOP]
├── 1-agent # Module directory
│ └── agent.out # OTLP/Json output created by the File Exporter
│ └── agent.yaml # OpenTelemetry Collector configuration file
│ └── trace.json # Sample trace data
└── otelcol # OpenTelemetry Collector binary
Note
On Windows, an open file may appear empty or cause issues when attempting to read it. To prevent this, make sure to stop the Agent or the Gateway before inspecting the file, as instructed.
Verify the span format:
Check the Format that The File Exporter has used to write the span to the agent.out.
It should be a single line in OTLP/JSON format.
Since no modifications have been made to the pipeline yet, this file should be identical to trace.json.
{"resourceSpans":[{"resource":{"attributes":[{"key":"service.name","value":{"stringValue":"my.service"}},{"key":"deployment.environment","value":{"stringValue":"my.environment"}}]},"scopeSpans":[{"scope":{"name":"my.library","version":"1.0.0","attributes":[{"key":"my.scope.attribute","value":{"stringValue":"some scope attribute"}}]},"spans":[{"traceId":"5B8EFFF798038103D269B633813FC60C","spanId":"EEE19B7EC3C1B174","parentSpanId":"EEE19B7EC3C1B173","name":"I'm a server span","startTimeUnixNano":"1544712660000000000","endTimeUnixNano":"1544712661000000000","kind":2,"attributes":[{"key":"user.name","value":{"stringValue":"George Lucas"}},{"key":"user.phone_number","value":{"stringValue":"+1555-867-5309"}},{"key":"user.email","value":{"stringValue":"george@deathstar.email"}},{"key":"user.account_password","value":{"stringValue":"LOTR>StarWars1-2-3"}},{"key":"user.visa","value":{"stringValue":"4111 1111 1111 1111"}},{"key":"user.amex","value":{"stringValue":"3782 822463 10005"}},{"key":"user.mastercard","value":{"stringValue":"5555 5555 5555 4444"}}]}]}]}]}
{"resourceSpans":[{"resource":{"attributes":[{"key":"service.name","value":{"stringValue":"my.service"}},{"key":"deployment.environment","value":{"stringValue":"my.environment"}}]},"scopeSpans":[{"scope":{"name":"my.library","version":"1.0.0","attributes":[{"key":"my.scope.attribute","value":{"stringValue":"some scope attribute"}}]},"spans":[{"traceId":"5B8EFFF798038103D269B633813FC60C","spanId":"EEE19B7EC3C1B174","parentSpanId":"EEE19B7EC3C1B173","name":"I'm a server span","startTimeUnixNano":"1544712660000000000","endTimeUnixNano":"1544712661000000000","kind":2,"attributes":[{"key":"user.name","value":{"stringValue":"George Lucas"}},{"key":"user.phone_number","value":{"stringValue":"+1555-867-5309"}},{"key":"user.email","value":{"stringValue":"george@deathstar.email"}},{"key":"user.account_password","value":{"stringValue":"LOTR>StarWars1-2-3"}},{"key":"user.visa","value":{"stringValue":"4111 1111 1111 1111"}},{"key":"user.amex","value":{"stringValue":"3782 822463 10005"}},{"key":"user.mastercard","value":{"stringValue":"5555 5555 5555 4444"}}]}]}]}]}
Tip
If you want to view the file’s content, simply run:
cat agent.out
For a formatted JSON output, you can use the same command but pipe it through jq (if installed):
cat ./agent.out | jq
1.4 Resource Metadata
So far, we’ve simply exported an exact copy of the span sent through the OpenTelemetry Collector.
Now, let’s improve the base span by adding metadata with processors. This extra information can be helpful for troubleshooting and correlation.
Find your Agent terminal window, and stop the running collector by pressing Ctrl-C. Once the Agent has stopped, open the agent.yaml and configure the resourcedetection and resource processors:
Exercise
Add the resourcedetection Processor: The Resource Detection Processor can be used to detect resource information from the host and append or override the resource value in telemetry data with this information.
Add resource Processor and name it add_mode: The Resource Processor can be used to apply changes on resource attributes.
resource/add_mode:# Processor Type/Nameattributes:# Array of attributes and modifications- action:insert # Action is to insert a keykey:otelcol.service.mode # Key namevalue:"agent"# Key value
Update All Pipelines: Add both processors (resourcedetection and resource/add_mode) to the processors array in all pipelines (traces, metrics, and logs). Ensure memory_limiter remains the first processor.
By adding these processors, we enrich the data with system metadata and the agent’s operational mode, which aids in troubleshooting and provides useful context for related content.
Validate the agent configuration using otelbin.io:
Verify agent.out: Validate the agent.out file contains the updated data:
[WORKSHOP]
├── 1-agent # Module directory
│ └── agent.out # OTLP/Json output created by the File Exporter
│ └── agent.yaml # OpenTelemetry Collector configuration file
│ └── trace.json # Sample trace data
└── otelcol # OpenTelemetry Collector binary
Verify that metadata is added to spans in the new agent.out file:
Check for the existence of theotelcol.service.mode attribute in the resourceSpans section and that it has a value of agent.
Verify that the resourcedetection attributes (host.name and os.type) exist too.
These values are automatically added based on your device by the processors configured in the pipeline.
{"resourceSpans":[{"resource":{"attributes":[{"key":"service.name","value":{"stringValue":"my.service"}},{"key":"deployment.environment","value":{"stringValue":"my.environment"}},{"key":"host.name","value":{"stringValue":"[YOUR_HOST_NAME]"}},{"key":"os.type","value":{"stringValue":"[YOUR_OS]"}},{"key":"otelcol.service.mode","value":{"stringValue":"agent"}}]},"scopeSpans":[{"scope":{"name":"my.library","version":"1.0.0","attributes":[{"key":"my.scope.attribute","value":{"stringValue":"some scope attribute"}}]},"spans":[{"traceId":"5b8efff798038103d269b633813fc60c","spanId":"eee19b7ec3c1b174","parentSpanId":"eee19b7ec3c1b173","name":"I'm a server span","kind":2,"startTimeUnixNano":"1544712660000000000","endTimeUnixNano":"1544712661000000000","attributes":[{"key":"user.name","value":{"stringValue":"George Lucas"}},{"key":"user.phone_number","value":{"stringValue":"+1555-867-5309"}},{"key":"user.email","value":{"stringValue":"george@deathstar.email"}},{"key":"user.account_password","value":{"stringValue":"LOTR\u003eStarWars1-2-3"}},{"key":"user.visa","value":{"stringValue":"4111 1111 1111 1111"}},{"key":"user.amex","value":{"stringValue":"3782 822463 10005"}},{"key":"user.mastercard","value":{"stringValue":"5555 5555 5555 4444"}}],"status":{}}]}],"schemaUrl":"https://opentelemetry.io/schemas/1.6.1"}]}
{"resourceSpans":[{"resource":{"attributes":[{"key":"service.name","value":{"stringValue":"my.service"}},{"key":"deployment.environment","value":{"stringValue":"my.environment"}},{"key":"host.name","value":{"stringValue":"[YOUR_HOST_NAME]"}},{"key":"os.type","value":{"stringValue":"[YOUR_OS]"}},{"key":"otelcol.service.mode","value":{"stringValue":"agent"}}]},"scopeSpans":[{"scope":{"name":"my.library","version":"1.0.0","attributes":[{"key":"my.scope.attribute","value":{"stringValue":"some scope attribute"}}]},"spans":[{"traceId":"5b8efff798038103d269b633813fc60c","spanId":"eee19b7ec3c1b174","parentSpanId":"eee19b7ec3c1b173","name":"I'm a server span","kind":2,"startTimeUnixNano":"1544712660000000000","endTimeUnixNano":"1544712661000000000","attributes":[{"key":"user.name","value":{"stringValue":"George Lucas"}},{"key":"user.phone_number","value":{"stringValue":"+1555-867-5309"}},{"key":"user.email","value":{"stringValue":"george@deathstar.email"}},{"key":"user.account_password","value":{"stringValue":"LOTR>StarWars1-2-3"}},{"key":"user.visa","value":{"stringValue":"4111 1111 1111 1111"}},{"key":"user.amex","value":{"stringValue":"3782 822463 10005"}},{"key":"user.mastercard","value":{"stringValue":"5555 5555 5555 4444"}}],"status":{}}]}],"schemaUrl":"https://opentelemetry.io/schemas/1.6.1"}]}
Stop the Agent process by pressing Ctrl-C in the terminal window.
2. Gateway Configuration
10 minutes
Exercise
Inside the [WORKSHOP] directory, create a new subdirectory named 2-gateway.
Next, copy all contents from the 1-agent directory into 2-gateway.
After copying, remove agent.out.
Create a file called gateway.yaml and add the following initial configuration:
Change all terminal windows to the [WORKSHOP]/2-gateway directory.
########################### This section holds all the## Configuration section ## configurations that can be ########################### used in this OpenTelemetry Collectorextensions:# Array of Extensionshealth_check:# Configures the health check extensionendpoint:0.0.0.0:14133# Port changed to prevent conflict with agent!!!receivers:otlp:# Receiver Typeprotocols:# list of Protocols usedhttp:# This wil enable the HTTP Protocolendpoint:"0.0.0.0:5318"# Port changed to prevent conflict with agent!!!include_metadata:true# Needed for token pass through modeexporters:# Array of Exportersdebug:# Exporter Typeverbosity:detailed # Enabled detailed debug outputprocessors:# Array of Processorsmemory_limiter:# Limits memory usage by Collectors pipelinecheck_interval:2s # Interval to check memory usagelimit_mib:512# Memory limit in MiBbatch:# Processor to Batch data before sendingmetadata_keys:# Include token in batches- X-SF-Token # Batch data grouped by Tokenresource/add_mode:# Processor Type/Nameattributes:# Array of Attributes and modifications- action:upsert # Action taken is to `insert' or 'update' a keykey:otelcol.service.mode # key Namevalue:"gateway"# Key Value########################### This section controls what### Activation Section ### configuration will be used########################### by the OpenTelemetry Collectorservice:# Services configured for this Collectorextensions:[health_check] # Enabled extensions for this collectorpipelines:# Array of configured pipelinestraces:receivers:- otlp # OTLP Receiverprocessors:- memory_limiter # Memory Limiter processor- resource/add_mode # Add metadata about collector mode- batch # Batch Processor, groups data before send exporters:- debug # Debug Exportermetrics:receivers:- otlp # OTLP Receiverprocessors:- memory_limiter # Memory Limiter processor- resource/add_mode # Add metadata about collector mode- batch # Batch Processor, groups data before send exporters:- debug # Debug Exporterlogs:receivers:- otlp # OTLP Receiverprocessors:- memory_limiter # Memory Limiter processor- resource/add_mode # Add metadata about collector mode- batch # Batch Processor, groups data before sendexporters:- debug # Debug Exporter
In this section, we will extend the gateway.yaml configuration you just created to separate metric, traces & logs into different files.
Create a file exporter and name it traces: Separate exporters need to be configured for traces, metrics, and logs. Below is the YAML configuration for traces:
file/traces:# Exporter Type/Namepath:"./gateway-traces.out"# Path where data will be saved in OTLP json formatappend:false# Overwrite the file each time
Create additional exporters for metrics and logs: Follow the example above, and set appropriate exporter names. Update the file paths to ./gateway-metrics.out for metrics and ./gateway-logs.out for logs.
Add exporters to each pipeline: Ensure that each pipeline includes its corresponding file exporter, placing it after the debug exporter.
logs:receivers:- otlp # OTLP Receiverprocessors:- memory_limiter # Memory Limiter processor- resource/add_mode # Adds collector mode metadata- batch # Groups Data before sendexporters:- debug # Debug Exporter- file/logs # File Exporter for logs
Validate the agent configuration using otelbin.io. For reference, the logs: section of your pipelines will look similar to this:
Run the following command to test the gateway configuration:
../otelcol --config=gateway.yaml
If everything is set up correctly, the first and last lines of the output should look like:
2025/01/15 15:33:53 settings.go:478: Set config to [gateway.yaml]
<snip to the end>
2025-01-13T12:43:51.747+0100 info service@v0.116.0/service.go:261 Everything is ready. Begin running and processing data.
Next, we will configure the Agent to send data to the newly created Gateway.
2.2 Configure Agent
Exercise
Update agent.yaml:
Switch to your Agent terminal window.
Make sure you are in the [WORKSHOP]/2-gateway directory.
Open the agent.yaml file that you copied earlier in your editor.
Add the otlphttp exporter:
The OTLP/HTTP Exporter is used to send data from the agent to the gateway using the OTLP/HTTP protocol. This is now the preferred method for exporting data to Splunk Observability Cloud (more details in Section 2.4 Addendum).
Ensure the endpoint is set to the gateway endpoint and port number.
Add the X-SF-Token header with a random value. During this workshop, you can use any value for X-SF-TOKEN. However, if you are connecting to Splunk Observability Cloud, this is where you will need to enter your Splunk Access Token (more details in Section 2.4 Addendum).
otlphttp:# Exporter Typeendpoint:"http://localhost:5318"# Gateway OTLP endpointheaders:# Headers to add to the HTTPcall X-SF-Token:"ACCESS_TOKEN"# Splunk ACCESS_TOKEN header
Add a Batch Processor configuration: Use the Batch Processor. It will accept spans, metrics, or logs and places them into batches. Batching helps better compress the data and reduce the number of outgoing connections required to transmit the data. It is highly recommended configuring the batch processor on every collector.
batch:# Processor Typemetadata_keys:[X-SF-Token] # Array of metadata keys to batch
Update the pipelines:
Add hostmetrics to the metrics pipeline. The HostMetrics Receiver will generate host metrics.
Add the batch processor after the resource/add_mode processor in the traces, metrics, and logs pipelines.
Replace the file exporter with the otlphttp exporter in the traces, metrics, and logs pipelines.
Verify the gateway is still running: Check your Gateway terminal window and make sure the Gateway collector is running.
Start the Agent: In the Agent terminal window start the agent with the updated configuration:
../otelcol --config=agent.yaml
Verify CPU Metrics:
Check that when the Agent starts, it immediately starts sending CPU metrics.
Both the Agent and the Gateway will display this activity in their debug output. The output should resemble the following snippet:
<snip>
NumberDataPoints #37
Data point attributes:
-> cpu: Str(cpu9)
-> state: Str(system)
StartTimestamp: 2024-12-09 14:18:28 +0000 UTC
Timestamp: 2025-01-15 15:27:51.319526 +0000 UTC
Value: 9637.660000
At this stage, the Agent continues to collect CPU metrics once per hour or upon each restart and sends them to the gateway. The OpenTelemetry Collector, running in Gateway mode, processes these metrics and exports them to a file named ./gateway-metrics.out. This file stores the exported metrics as part of the pipeline service.
Verify Data arrived at Gateway:
Open the newly created gateway-metrics.out file.
Check that it contains CPU metrics.
The Metrics should include details similar to those shown below (We’re only displaying the resourceMetrics section and the first set of CPU metrics — You will likely see more):
{"resourceMetrics":[{"resource":{"attributes":[{"key":"host.name","value":{"stringValue":"YOUR_HOST_NAME"}},{"key":"os.type","value":{"stringValue":"YOUR_OS"}},{"key":"otelcol.service.mode","value":{"stringValue":"gateway"}}]},"scopeMetrics":[{"scope":{"name":"github.com/open-telemetry/opentelemetry-collector-contrib/receiver/hostmetricsreceiver/internal/scraper/cpuscraper","version":"v0.116.0"},"metrics":[{"name":"system.cpu.time","description":"Total seconds each logical CPU spent on each mode.","unit":"s","sum":{"dataPoints":[{"attributes":[{"key":"cpu","value":{"stringValue":"cpu0"}},{"key":"state","value":{"stringValue":"user"}}],"startTimeUnixNano":"1733753908000000000","timeUnixNano":"1737133726158376000","asDouble":1168005.59}]}}]}]}]}
{"resourceMetrics":[{"resource":{"attributes":[{"key":"host.name","value":{"stringValue":"YOUR_HOST_NAME"}},{"key":"os.type","value":{"stringValue":"YOUR_OS"}},{"key":"otelcol.service.mode","value":{"stringValue":"gateway"}}]},"scopeMetrics":[{"scope":{"name":"github.com/open-telemetry/opentelemetry-collector-contrib/receiver/hostmetricsreceiver/internal/scraper/cpuscraper","version":"v0.116.0"},"metrics":[{"name":"system.cpu.time","description":"Total seconds each logical CPU spent on each mode.","unit":"s","sum":{"dataPoints":[{"attributes":[{"key":"cpu","value":{"stringValue":"cpu0"}},{"key":"state","value":{"stringValue":"user"}}],"startTimeUnixNano":"1733753908000000000","timeUnixNano":"1737133726158376000","asDouble":1168005.59},]}}]}]}]}
Validate both collectors are running:
Find the Agent terminal window. If the Agent is stopped, restart it.
Find the Gateway terminal window. Check if the Gateway is running, otherwise restart it.
Send a Test Trace:
Find your Tests terminal window
Navigate it to the [WORKSHOP]/2-gateway directory.
Ensure that you have copied trace.json to the 2-gateway directory.
Run the cURL command to send the span.
Below, we show the first and last lines of the debug output. Use the Complete Debug Output button below to verify that both the Agent and Gateway produced similar debug output.
{"kind": "exporter", "data_type": "metrics", "name": "debug"}
2025-02-05T15:55:18.966+0100 info Traces {"kind": "exporter", "data_type": "traces", "name": "debug", "resource spans": 1, "spans": 1}
2025-02-05T15:55:18.966+0100 info ResourceSpans #0
Resource SchemaURL: https://opentelemetry.io/schemas/1.6.1
Resource attributes:
-> service.name: Str(my.service)
-> deployment.environment: Str(my.environment)
-> host.name: Str(PH-Windows-Box.hagen-ict.nl)
-> os.type: Str(windows)
-> otelcol.service.mode: Str(agent)
ScopeSpans #0
ScopeSpans SchemaURL:
InstrumentationScope my.library 1.0.0
InstrumentationScope attributes:
-> my.scope.attribute: Str(some scope attribute)
Span #0
Trace ID : 5b8efff798038103d269b633813fc60c
Parent ID : eee19b7ec3c1b173
ID : eee19b7ec3c1b174
Name : I'm a server span
Kind : Server
Start time : 2018-12-13 14:51:00 +0000 UTC
End time : 2018-12-13 14:51:01 +0000 UTC
Status code : Unset
Status message :
Attributes:
-> user.name: Str(George Lucas)
-> user.phone_number: Str(+1555-867-5309)
-> user.email: Str(george@deathstar.email)
-> user.account_password: Str(LOTR>StarWars1-2-3)
Gateway has handled the span: Verify that the gateway has generated a new file named ./gateway-traces.out.
{"resourceSpans":[{"resource":{"attributes":[{"key":"service.name","value":{"stringValue":"my.service"}},{"key":"deployment.environment","value":{"stringValue":"my.environment"}},{"key":"host.name","value":{"stringValue":"[YOUR_HOST_NAME]"}},{"key":"os.type","value":{"stringValue":"[YOUR_OS]"}},{"key":"otelcol.service.mode","value":{"stringValue":"agent"}}]},"scopeSpans":[{"scope":{"name":"my.library","version":"1.0.0","attributes":[{"key":"my.scope.attribute","value":{"stringValue":"some scope attribute"}}]},"spans":[{"traceId":"5b8efff798038103d269b633813fc60c","spanId":"eee19b7ec3c1b174","parentSpanId":"eee19b7ec3c1b173","name":"I'm a server span","kind":2,"startTimeUnixNano":"1544712660000000000","endTimeUnixNano":"1544712661000000000","attributes":[{"key":"user.name","value":{"stringValue":"George Lucas"}},{"key":"user.phone_number","value":{"stringValue":"+1555-867-5309"}},{"key":"user.email","value":{"stringValue":"george@deathstar.email"}},{"key":"user.account_password","value":{"stringValue":"LOTR\u003eStarWars1-2-3"}},{"key":"user.visa","value":{"stringValue":"4111 1111 1111 1111"}},{"key":"user.amex","value":{"stringValue":"3782 822463 10005"}},{"key":"user.mastercard","value":{"stringValue":"5555 5555 5555 4444"}}],"status":{}}]}],"schemaUrl":"https://opentelemetry.io/schemas/1.6.1"}]}
{"resourceSpans":[{"resource":{"attributes":[{"key":"service.name","value":{"stringValue":"my.service"}},{"key":"deployment.environment","value":{"stringValue":"my.environment"}},{"key":"host.name","value":{"stringValue":"[YOUR_HOST_NAME]"}},{"key":"os.type","value":{"stringValue":"[YOUR_OS]"}},{"key":"otelcol.service.mode","value":{"stringValue":"agent"}}]},"scopeSpans":[{"scope":{"name":"my.library","version":"1.0.0","attributes":[{"key":"my.scope.attribute","value":{"stringValue":"some scope attribute"}}]},"spans":[{"traceId":"5b8efff798038103d269b633813fc60c","spanId":"eee19b7ec3c1b174","parentSpanId":"eee19b7ec3c1b173","name":"I'm a server span","kind":2,"startTimeUnixNano":"1544712660000000000","endTimeUnixNano":"1544712661000000000","attributes":[{"key":"user.name","value":{"stringValue":"George Lucas"}},{"key":"user.phone_number","value":{"stringValue":"+1555-867-5309"}},{"key":"user.email","value":{"stringValue":"george@deathstar.email"}},{"key":"user.account_password","value":{"stringValue":"LOTR>StarWars1-2-3"}},{"key":"user.visa","value":{"stringValue":"4111 1111 1111 1111"}},{"key":"user.amex","value":{"stringValue":"3782 822463 10005"}},{"key":"user.mastercard","value":{"stringValue":"5555 5555 5555 4444"}}],"status":{}}]}],"schemaUrl":"https://opentelemetry.io/schemas/1.6.1"}]}
Ensure that both gateway-metrics.out and gateway-traces.out include a resource attribute key-value pair for otelcol.service.mode with the value gateway.
Note
In the provided gateway.yaml configuration, we modified the resource/add_mode processor to use the upsert action instead of insert.
The upsert action updates the value of the resource attribute key if it already exists, setting it to gateway. If the key is not present, the upsert action will add it.
Stop the Agent and Gateway processes by pressing Ctrl-C in their respective terminals.
2.4 Addendum - Info on Access Tokens and Batch Processing
Tip
Introduction to the otlphttp Exporter
The otlphttp exporter is now the default method for sending metrics and traces to Splunk Observability Cloud. This exporter provides a standardized and efficient way to transmit telemetry data using the OpenTelemetry Protocol (OTLP) over HTTP.
When deploying the Splunk Distribution of the OpenTelemetry Collector in host monitoring (agent) mode, the otlphttp exporter is included by default. This replaces older exporters such as sapm and signalfx, which are gradually being phased out.
Configuring Splunk Access Tokens
To authenticate and send data to Splunk Observability Cloud, you need to configure access tokens properly.
In OpenTelemetry, authentication is handled via HTTP headers. To pass an access token, use the headers: key with the sub-key X-SF-Token:. This configuration works in both agent and gateway mode.
If you need to forward headers through the pipeline, enable pass-through mode by setting include_metadata: to true in the OTLP receiver configuration. This ensures that any authentication headers received by the collector are retained and forwarded along with the data.
This is particularly useful in gateway mode, where data from multiple agents may pass through a centralized gateway before being sent to Splunk.
Understanding Batch Processing
The Batch Processor is a key component in optimizing data transmission efficiency. It groups traces, metrics, and logs into batches before sending them to the backend. Batching improves performance by:
Reducing the number of outgoing requests.
Improving compression efficiency.
Lowering network overhead.
Configuring the Batch Processor
To enable batching, configure the batch: section and include the X-SF-Token: key. This ensures that data is grouped correctly before being sent to Splunk Observability Cloud.
Example:
processors:batch:metadata_keys:[X-SF-Token] # Array of metadata keys to batch send_batch_size:100timeout:5s
Best Practices for Batch Processing
For optimal performance, it is recommended to use the Batch Processor in every collector deployment. The best placement for the Batch Processor is after the memory limiter and sampling processors. This ensures that only necessary data is batched, avoiding unnecessary processing of dropped data.
Gateway Configuration with Batch Processor
When deploying a gateway, ensure that the Batch Processor is included in the pipeline:
The otlphttp exporter is now the preferred method for sending telemetry data to Splunk Observability Cloud. Properly configuring Splunk Access Tokens ensures secure data transmission, while the Batch Processor helps optimize performance by reducing network overhead. By implementing these best practices, you can efficiently collect and transmit observability data at scale.
3. Filelog Setup
10 minutes
The FileLog Receiver in the OpenTelemetry Collector is used to ingest logs from files.
It monitors specified files for new log entries and streams those logs into the Collector for further processing or exporting. It is useful for testing and development purposes.
For this part of the workshop, there is script that will generate log lines in a file. The Filelog receiver will read these log lines and send them to the OpenTelemetry Collector.
Exercise
Move to the log-gen terminal window.
Navigate to the [WORKSHOP] directory and create a new subdirectory named 3-filelog.
Next, copy all contents from the 2-gateway directory into 3-filelog.
After copying, remove any *.out and *.log files.
Change all terminal windows to the [WORKSHOP]/3-filelog directory.
Your updated directory structure will now look like this:
Create the log-gen script: In the 3-filelog directory create the script log-gen.sh (macOS/Linux), or log-gen.ps1 (Windows) using the appropriate script below for your operating system:
#!/bin/bash
# Define the log fileLOG_FILE="quotes.log"# Define quotesLOTR_QUOTES=("One does not simply walk into Mordor.""Even the smallest person can change the course of the future.""All we have to decide is what to do with the time that is given us.""There is some good in this world, and it's worth fighting for.")STAR_WARS_QUOTES=("Do or do not, there is no try.""The Force will be with you. Always.""I find your lack of faith disturbing.""In my experience, there is no such thing as luck.")# Function to get a random quoteget_random_quote(){if(( RANDOM % 2==0));thenecho"${LOTR_QUOTES[RANDOM % ${#LOTR_QUOTES[@]}]}"elseecho"${STAR_WARS_QUOTES[RANDOM % ${#STAR_WARS_QUOTES[@]}]}"fi}# Function to get a random log levelget_random_log_level(){LOG_LEVELS=("INFO""WARN""ERROR""DEBUG")echo"${LOG_LEVELS[RANDOM % ${#LOG_LEVELS[@]}]}"}# Function to generate log entrygenerate_log_entry(){TIMESTAMP=$(date "+%Y-%m-%d %H:%M:%S")LEVEL=$(get_random_log_level)MESSAGE=$(get_random_quote)if["$JSON_OUTPUT"=true];thenecho"{\"timestamp\": \"$TIMESTAMP\", \"level\": \"$LEVEL\", \"message\": \"$MESSAGE\"}"elseecho"$TIMESTAMP [$LEVEL] - $MESSAGE"fi}# Parse command line argumentsJSON_OUTPUT=falsewhile[["$#" -gt 0]];docase$1 in
-json)JSON_OUTPUT=true;;esacshiftdone# Main loop to write logsecho"Writing logs to $LOG_FILE. Press Ctrl+C to stop."while true;do generate_log_entry >> "$LOG_FILE" sleep 1# Adjust this value for log frequencydone
# Define the log file$LOG_FILE="quotes.log"# Define quotes$LOTR_QUOTES=@("One does not simply walk into Mordor.""Even the smallest person can change the course of the future.""All we have to decide is what to do with the time that is given us.""There is some good in this world, and it's worth fighting for.")$STAR_WARS_QUOTES=@("Do or do not, there is no try.""The Force will be with you. Always.""I find your lack of faith disturbing.""In my experience, there is no such thing as luck.")# Function to get a random quotefunctionGet-RandomQuote{if((Get-Random-Minimum0-Maximum2)-eq0){return$LOTR_QUOTES[(Get-Random-Minimum0-Maximum$LOTR_QUOTES.Length)]}else{return$STAR_WARS_QUOTES[(Get-Random-Minimum0-Maximum$STAR_WARS_QUOTES.Length)]}}# Function to get a random log levelfunctionGet-RandomLogLevel{$LOG_LEVELS=@("INFO","WARN","ERROR","DEBUG")return$LOG_LEVELS[(Get-Random-Minimum0-Maximum$LOG_LEVELS.Length)]}# Function to generate log entryfunctionGenerate-LogEntry{$TIMESTAMP=Get-Date-Format"yyyy-MM-dd HH:mm:ss"$LEVEL=Get-RandomLogLevel$MESSAGE=Get-RandomQuoteif($JSON_OUTPUT){$logEntry=@{timestamp=$TIMESTAMP;level=$LEVEL;message=$MESSAGE}|ConvertTo-Json-Compress}else{$logEntry="$TIMESTAMP [$LEVEL] - $MESSAGE"}return$logEntry}# Parse command line arguments$JSON_OUTPUT=$falseif($args-contains"-json"){$JSON_OUTPUT=$true}# Main loop to write logsWrite-Host"Writing logs to $LOG_FILE. Press Ctrl+C to stop."while($true){$logEntry=Generate-LogEntry# Ensure UTF-8 encoding is used (without BOM) to avoid unwanted characters$logEntry|Out-File-Append-FilePath$LOG_FILE-Encodingutf8Start-Sleep-Seconds1# Adjust log frequency}
WORKSHOP
├── 1-agent
├── 2-gateway
├── 3-filelog
│ ├── agent.yaml # Agent Collector configuration file
│ ├── gateway.yaml # Gateway Collector configuration file
│ ├── log-gen.(sh or ps1) # Script to write a file with logs lines
│ └── trace.json # Example trace file
└── otelcol # OpenTelemetry Collector binary
For macOS/Linux make sure the script is executable:
chmod +x log-gen.sh
3.2 Start Log-Gen
Exercise
Start the appropriate script for your system. The script will begin writing lines to a file named quotes.log:
./log-gen.sh
Writing logs to quotes.log. Press Ctrl+C to stop.
Note
On Windows, you may encounter the following error:
.\log-gen.ps1 : File .\log-gen.ps1 cannot be loaded because running scripts is disabled on this system …
To resolve this run:
powershell-ExecutionPolicyBypass-Filelog-gen.ps1
3.3 Filelog Configuration
Exercise
Move to the Agent terminal window and change into the [WORKSHOP]/3-filelog directory. Open the agent.yaml copied across earlier and in your editor add the filelog receiver to the agent.yaml.
Create the filelog receiver and name it quotes: The FileLog receiver reads log data from a file and includes custom resource attributes in the log data:
filelog/quotes:# Receiver Type/Nameinclude:./quotes.log # The file to read log data frominclude_file_path:true# Include file path in the log datainclude_file_name:false# Exclude file name from the log dataresource:# Add custom resource attributescom.splunk.source:./quotes.log # Source of the log datacom.splunk.sourcetype:quotes # Source type of the log data
Add filelog/quotes receiver: In the logs: pipeline add the filelog/quotes: receiver.
logs:receivers:- otlp # OTLP Receiver- filelog/quotes # Filelog Receiver reading quotes.logprocessors:- memory_limiter # Memory Limiter Processor- resourcedetection # Adds system attributes to the data- resource/add_mode # Adds collector mode metadata- batch # Batch Processor, groups data before sendexporters:- debug # Debug Exporter- otlphttp # OTLP/HTTP EXporter
Validate the agent configuration using otelbin.io. For reference, the logs: section of your pipelines will look similar to this:
Check the log-gen script is running: Find the log-gen Terminal window, and check the script is still running, and the last line is still stating the below, if it not, restart it in the [WORKSHOP]/3-filelog directory:
Writing logs to quotes.log. Press Ctrl+C to stop.
Start the Gateway:
Find your Gateway terminal window.
Navigate to the [WORKSHOP]/3-filelog directory.
Start the Gateway.
Start the Agent:
Switch to your Agent terminal window.
Navigate to the [WORKSHOP]/3-filelog directory.
Start the Agent.
Ignore the initial CPU metrics in the debug output and wait until the continuous stream of log data from the quotes.log appears. The debug output should look similar to the following (use the Check Full Debug Log to see all data):
<snip>
Body: Str(2025-02-05 18:05:16 [INFO] - All we have to decide is what to do with the time that is given)us.
Attributes:
-> log.file.path: Str(quotes.log)
</snip>
Check Full Debug Log
2025-02-05T18:05:17.050+0100 info Logs {"kind": "exporter", "data_type": "logs", "name": "debug", "resource logs": 1, "log records": 1}
2025-02-05T18:05:17.050+0100 info ResourceLog #0
Resource SchemaURL: https://opentelemetry.io/schemas/1.6.1
Resource attributes:
-> com.splunk.source: Str(./quotes.log)
-> com.splunk.sourcetype: Str(quotes)
-> host.name: Str(PH-Windows-Box.hagen-ict.nl)
-> os.type: Str(windows)
-> otelcol.service.mode: Str(gateway)
ScopeLogs #0
ScopeLogs SchemaURL:
InstrumentationScope
LogRecord #0
ObservedTimestamp: 2025-02-05 17:05:16.6926816 +0000 UTC
Timestamp: 1970-01-01 00:00:00 +0000 UTC
SeverityText:
SeverityNumber: Unspecified(0)
Body: Str(2025-02-05 18:05:16 [INFO] - All we have to decide is what to do with the time that is given)us.
Attributes:
-> log.file.path: Str(quotes.log)
Trace ID:
Span ID:
Flags: 0
{"kind": "exporter", "data_type": "logs", "name": "debug"}
Verify the gateway has handled the logs:
Windows only: Stop the Agent and Gateway to flush the files.
Check if the Gateway has written a ./gateway-logs.out file.
At this point, your directory structure will appear as follows:
WORKSHOP
├── 1-agent
├── 2-gateway
├── 3-filelog
│ ├── agent.yaml # Agent Collector configuration file
│ ├── gateway-logs.out # Output from the gateway logs pipeline
│ ├── gateway-metrics.out # Output from the gateway metrics pipeline
│ ├── gateway.yaml # Gateway Collector configuration file
│ ├── log-gen.(sh or ps1) # Script to write a file with logs lines
│ ├── quotes.log # File containing Random log lines
│ └── trace.json # Example trace file
└── otelcol # OpenTelemetry Collector binary
Examine a log line in gateway-logs.out: Compare a log line with the snippet below. It is a preview showing the beginning and a single log line; your actual output will contain many, many more:
{"resourceLogs":[{"resource":{"attributes":[{"key":"com.splunk.sourcetype","value":{"stringValue":"quotes"}},{"key":"com.splunk/source","value":{"stringValue":"./quotes.log"}},{"key":"host.name","value":{"stringValue":"[YOUR_HOST_NAME]"}},{"key":"os.type","value":{"stringValue":"[YOUR_OS]"}},{"key":"otelcol.service.mode","value":{"stringValue":"agent"}}]},"scopeLogs":[{"scope":{},"logRecords":[{"observedTimeUnixNano":"1737231901720160600","body":{"stringValue":"2025-01-18 21:25:01 [WARN] - Do or do not, there is no try."},"attributes":[{"key":"log.file.path","value":{"stringValue":"quotes.log"}}],"traceId":"","spanId":""}]}],"schemaUrl":"https://opentelemetry.io/schemas/1.6.1"}]}{"resourceLogs":[{"resource":{"attributes":[{"key":"com.splunk/source","value":{"stringValue":"./quotes.log"}},{"key":"com.splunk.sourcetype","value":{"stringValue":"quotes"}},{"key":"host.name","value":{"stringValue":"PH-Windows-Box.hagen-ict.nl"}},{"key":"os.type","value":{"stringValue":"windows"}},{"key":"otelcol.service.mode","value":{"stringValue":"agent"}}]},"scopeLogs":[{"scope":{},"logRecords":[{"observedTimeUnixNano":"1737231902719133000","body":{"stringValue":"2025-01-18 21:25:02 [DEBUG] - One does not simply walk into Mordor."},"attributes":[{"key":"log.file.path","value":{"stringValue":"quotes.log"}}],"traceId":"","spanId":""}]}],"schemaUrl":"https://opentelemetry.io/schemas/1.6.1"}]}
{"resourceLogs":[{"resource":{"attributes":[{"key":"com.splunk/source","value":{"stringValue":"./quotes.log"}},{"key":"com.splunk.sourcetype","value":{"stringValue":"quotes"}},{"key":"host.name","value":{"stringValue":"[YOUR_HOST_NAME]"}},{"key":"os.type","value":{"stringValue":"[YOUR_OS]"}},{"key":"otelcol.service.mode","value":{"stringValue":"agent"}}]},"scopeLogs":[{"scope":{},"logRecords":[{"observedTimeUnixNano":"1737231902719133000","body":{"stringValue":"2025-01-18 21:25:02 [DEBUG] - One does not simply walk into Mordor."},"attributes":[{"key":"log.file.path","value":{"stringValue":"quotes.log"}}],"traceId":"","spanId":""}]}],"schemaUrl":"https://opentelemetry.io/schemas/1.6.1"}]}
Examine the resourceLogs section: Verify that the files include the same attributes we observed in the traces and metrics sections.
You may also have noticed that every log line contains empty placeholders for "traceId":"" and "spanId":"". The FileLog receiver will populate these fields only if they are not already present in the log line.
For example, if the log line is generated by an application instrumented with an OpenTelemetry instrumentation library, these fields will already be included and will not be overwritten.
Stop the Agent, Gateway and the Quotes generating script as well using Ctrl-C.
4. Building In Resilience
10 minutes
The OpenTelemetry Collector’s FileStorage Extension enhances the resilience of your telemetry pipeline by providing reliable checkpointing, managing retries, and handling temporary failures effectively.
With this extension enabled, the OpenTelemetry Collector can store intermediate states on disk, preventing data loss during network disruptions and allowing it to resume operations seamlessly.
Note
This solution will work for metrics as long as the connection downtime is brief—up to 15 minutes. If the downtime exceeds this, Splunk Observability Cloud will drop data due to datapoints being out of order.
For logs, there are plans to implement a more enterprise-ready solution in one of the upcoming Splunk OpenTelemetry Collector releases.
Exercise
Inside the [WORKSHOP] directory, create a new subdirectory named 4-resilience.
Next, copy all contents from the 3-filelog directory into 4-resilience.
After copying, remove any *.out and *.log files.
Change all terminal windows to the [WORKSHOP]/4-reslilience directory.
Your updated directory structure will now look like this:
In this exercise, we will update the extensions: section of the agent.yaml file. This section is part of the OpenTelemetry configuration YAML and defines optional components that enhance or modify the OpenTelemetry Collector’s behavior.
While these components do not process telemetry data directly, they provide valuable capabilities and services to improve the Collector’s functionality.
Exercise
Update the agent.yaml: Add the file_storage extension and name it checkpoint:
file_storage/checkpoint:# Extension Type/Namedirectory:"./checkpoint-dir"# Define directorycreate_directory:true# Create directorytimeout:1s # Timeout for file operationscompaction:# Compaction settingson_start:true# Start compaction at Collector startup# Define compaction directorydirectory:"./checkpoint-dir/tmp"# Max. size limit before compaction occursmax_transaction_size:65536
Add file_storage to existing otlphttp exporter: Modify the otlphttp: exporter to configure retry and queuing mechanisms, ensuring data is retained and resent if failures occur:
otlphttp:# Exporter Typeendpoint:"http://localhost:5318"# Gateway OTLP endpointheaders:# Headers to add to the HTTPcall X-SF-Token:"ACCESS_TOKEN"# Splunk ACCESS_TOKEN headerretry_on_failure:# Retry on failure settingsenabled:true# Enables retryingsending_queue:# Sending queue settingsenabled:true# Enables Sending queuenum_consumers:10# Number of consumersqueue_size:10000# Maximum queue size# File storage extensionstorage:file_storage/checkpoint
Update the services section: Add the file_storage/checkpoint extension to the existing extensions: section. This will cause the extension to be enabled:
service:extensions:- health_check- file_storage/checkpoint # Enabled extensions for this collector
Update the metrics pipeline: For this exercise we are going to remove the hostmetrics receiver from the Metric pipeline to reduce debug and log noise:
Next, we will configure our environment to be ready for testing the File Storage configuration.
Exercise
Start the Gateway: In the Gateway terminal window navigate to the [WORKSHOP]/4-resilience directory and run:
../otelcol --config=gateway.yaml
Start the Agent: In the Agent terminal window navigate to the [WORKSHOP]/4-resilience directory and run:
../otelcol --config=agent.yaml
Send a test trace: In the Test terminal window navigate to the [WORKSHOP]/4-resilience directory and run:
curl -X POST -i http://localhost:4318/v1/traces -H "Content-Type: application/json" -d "@trace.json"
Both the Agent and Gateway should display debug logs, and the Gateway should create a ./gateway-traces.out file.
If everything functions correctly, we can proceed with testing system resilience.
4.3 Simulate Failure
To assess the Agent’s resilience, we’ll simulate a temporary Gateway outage and observe how the Agent handles it:
Summary:
Send Traces to the Agent – Generate traffic by sending traces to the Agent.
Stop the Gateway – This will trigger the Agent to enter retry mode.
Restart the Gateway – The Agent will recover traces from its persistent queue and forward them successfully. Without the persistent queue, these traces would have been lost permanently.
Exercise
Simulate a network failure: In the Gateway terminal stop the Gateway with Ctrl-C and wait until the gateway console shows that it has stopped:
2025-01-28T13:24:32.785+0100 info service@v0.116.0/service.go:309 Shutdown complete.
Send traces: In the Test terminal window send two traces using the curl command we used earlier.
Notice that the agent’s retry mechanism is activated as it continuously attempts to resend the data. In the agent’s console output, you will see repeated messages similar to the following:
2025-01-28T14:22:47.020+0100 info internal/retry_sender.go:126 Exporting failed. Will retry the request after interval. {"kind": "exporter", "data_type": "traces", "name": "otlphttp", "error": "failed to make an HTTP request: Post \"http://localhost:5318/v1/traces\": dial tcp 127.0.0.1:5318: connect: connection refused", "interval": "9.471474933s"}
Stop the Agent: Use Ctrl-C to stop the agent. Wait until the agent’s console confirms it has stopped:
2025-01-28T14:40:28.702+0100 info extensions/extensions.go:66 Stopping extensions...
2025-01-28T14:40:28.702+0100 info service@v0.116.0/service.go:309 Shutdown complete.
Tip
Stopping the agent will halt its retry attempts and prevent any future retry activity.
If the agent runs for too long without successfully delivering data, it may begin dropping traces, depending on the retry configuration, to conserve memory. By stopping the agent, any metrics, traces, or logs currently stored in memory are lost before being dropped, ensuring they remain available for recovery.
This step is essential for clearly observing the recovery process when the agent is restarted.
4.4 Simulate Recovery
In this exercise, we’ll test how the OpenTelemetry Collector recovers from a network outage by restarting the Gateway. When the Gateway becomes available again, the Agent will resume sending data from its last checkpointed state, ensuring no data loss.
Exercise
Restart the Gateway: In the Gateway terminal window run:
../otelcol --config=gateway.yaml
Restart the Agent: In the Agent terminal window run:
../otelcol --config=agent.yaml
After the Agent is up and running, the File_Storage extension will detect buffered data in the checkpoint folder. It will start to dequeue the stored spans from the last checkpoint folder, ensuring no data is lost.
Exercise
Verify the Agent Debug output Note that the Agent Debug Screen does NOT change and still shows the following line indicating no new data is being exported.
2025-02-07T13:40:12.195+0100 info service@v0.117.0/service.go:253 Everything is ready. Begin running and processing data.
Watch the Gateway Debug output You should see from the Gateway debug screen, it has started receiving the previously missed traces without requiring any additional action on your part.
2025-02-07T12:44:32.651+0100 info service@v0.117.0/service.go:253 Everything is ready. Begin running and processing data.
2025-02-07T12:47:46.721+0100 info Traces {"kind": "exporter", "data_type": "traces", "name": "debug", "resource spans": 4, "spans": 4}
2025-02-07T12:47:46.721+0100 info ResourceSpans #0
Resource SchemaURL: https://opentelemetry.io/schemas/1.6.1
Resource attributes:
Check the gateway-traces.out file Count the number of traces in the recreated ./gateway-traces.out. It should match the number you send when the Gateway was down
Conclusion
This exercise demonstrated how to enhance the resilience of the OpenTelemetry Collector by configuring the file_storage extension, enabling retry mechanisms for the otlp exporter, and using a file-backed queue for temporary data storage.
By implementing file-based checkpointing and queue persistence, you ensure the telemetry pipeline can gracefully recover from temporary interruptions, making it a more robust and reliable for production environments.
Stop the Agent and Gateway using Ctrl-C.
5. Dropping Spans
10 minutes
In this section, we will explore how to use the Filter Processor to selectively drop spans based on certain conditions.
Specifically, we will drop traces based on the span name, which is commonly used to filter out unwanted spans such as health checks or internal communication traces. In this case, we will be filtering out spans whose name is "/_healthz", typically associated with health check requests and usually are quite “noisy”.
Exercise
Inside the [WORKSHOP] directory, create a new subdirectory named 5-dropping-spans.
Next, copy all contents from the 4-resilience directory into 5-dropping-spans.
After copying, remove any *.out and *.log files.
Change all terminal windows to the [WORKSHOP]/5-dropping-spans directory.
Your updated directory structure will now look like this:
Next, we will configure the filter processor and the respective pipelines.
Subsections of 5. Dropping Spans
5.1 Configuration
Exercise
Switch to your Gateway terminal window. Navigate to the [WORKSHOP]/5-dropping-spans directory and open the gateway.yaml and add the following configuration to the processors section:
Add a filter processor: Configure the OpenTelemetry Collector to drop spans with the name "/_healthz":
filter/health:# Defines a filter processorerror_mode:ignore # Ignore errorstraces:# Filtering rules for tracesspan:# Exclude spans named "/_healthz" - 'name == "/_healthz"'
Add the filter processor: Make sure you add the filter to the traces pipeline. Filtering should be applied as early as possible, ideally right after the memory_limiter and before the batch processor:
traces:receivers:- otlp # OTLP Receiverprocessors:- memory_limiter # Manage memory usage- filter/health # Filter Processor. Filter's out Data based on rules- resource/add_mode # Add metadata about collector mode- batch # Groups Data before sendexporters:- debug # Debug Exporter- file/traces # File Exporter for Trace
Validate the agent configuration using otelbin.io. For reference, the traces: section of your pipelines will look similar to this:
Start the Gateway: In the Gateway terminal window navigate to the [WORKSHOP]/5-dropping-spans directory and run:
../otelcol --config=gateway.yaml
Start the Agent: In the Agent terminal window navigate to the [WORKSHOP]/5-dropping-spans directory and run:
../otelcol --config=agent.yaml
Send the new health.json payload: In the Test terminal window navigate to the [WORKSHOP]/5-dropping-spans directory and run the curl command below. (Windows use curl.exe).
curl -X POST -i http://localhost:4318/v1/traces -H "Content-Type: application/json" -d "@health.json"
Verify Agent Debug output shows the healthz span: Confirm that the span span payload is sent, Check the agent’s debug output to see the span data like the snippet below:
<snip>
Span #0
Trace ID : 5b8efff798038103d269b633813fc60c
Parent ID : eee19b7ec3c1b173
ID : eee19b7ec3c1b174
Name : /_healthz
Kind : Server
<snip>
The Agent has forward the span to the Gateway.
Check the Gateway Debug output:
The Gateway should NOT show any span data received. This is because the Gateway is configured with a filter to drop spans named "/_healthz", so the span will be discarded/dropped and not processed further.
Confirm normal span are processed by using the cURL command with the trace.json file again. This time, you should see both the agent and gateway process the spans successfully.
Tip
When using the Filter processor make sure you understand the look of your incoming data and test the configuration thoroughly. In general, use as specific a configuration as possible to lower the risk of the wrong data being dropped.
You can further extend this configuration to filter out spans based on different attributes, tags, or other criteria, making the OpenTelemetry Collector more customizable and efficient for your observability needs.
Stop the Agent and Gateway using Ctrl-C.
6. Redacting Sensitive Data
10 minutes
In this section, you’ll learn how to configure the OpenTelemetry Collector to remove specific tags and redact sensitive data from telemetry spans. This is crucial for protecting sensitive information such as credit card numbers, personal data, or other security-related details that must be anonymized before being processed or exported.
We’ll walk through configuring key processors in the OpenTelemetry Collector, including:
In this step, we’ll modify agent.yaml to include the attributes and redaction processors. These processors will help ensure that sensitive data within span attributes is properly handled before being logged or exported.
Previously, you may have noticed that some span attributes displayed in the console contained personal and sensitive data. We’ll now configure the necessary processors to filter out and redact this information effectively.
Switch to your Agent terminal window. Navigate to the [WORKSHOP]/6-sensitive-data directory and open the agent.yaml file in your editor.
Add an attributes Processor: This processor allows you to update, delete, or hash specific attributes (tags) within spans. We’ll update the user.phone_number, hash the user.email, and delete the user.account_password:
attributes/update:# Processor Type/Nameactions:# List of actions- key:user.phone_number # Target keyaction:update # Replace value with "UNKNOWN NUMBER"value:"UNKNOWN NUMBER"- key:user.email # Hash the email valueaction:hash - key:user.account_password# Remove the passwordaction:delete
Add a redaction Processor: This processor will detect and redact sensitive data values based on predefined patterns. We’ll block credit card numbers using regular expressions.
redaction/redact:# Processor Type/Nameallow_all_keys:true# If false, only allowed keys will be retainedblocked_values:# List of regex patterns to hash- '\b4[0-9]{3}[\s-]?[0-9]{4}[\s-]?[0-9]{4}[\s-]?[0-9]{4}\b'# Visa card- '\b5[1-5][0-9]{2}[\s-]?[0-9]{4}[\s-]?[0-9]{4}[\s-]?[0-9]{4}\b'# MasterCardsummary:debug # Show debug details about redaction
Update the traces Pipeline: Integrate both processors into the traces pipeline. Make sure that you comment out the redaction processor at first: (We will enable it later)
traces:receivers:- otlp # OTLP Receiverprocessors:- memory_limiter # Manage memory usage- attributes/update # Update, hash, and remove attributes#- redaction/redact # Redact sensitive fields using regex- resourcedetection # Add system attributes- resource/add_mode # Add metadata about collector mode- batch # Batch Processor, groups data before sendexporters:- debug # Debug Exporter- otlphttp # OTLP/HTTP EXporter used by Splunk O11Y
Validate the agent configuration using otelbin.io. For reference, the traces: section of your pipelines will look similar to this:
In this exercise, we will delete the user.account_password, update the user.phone_numberattribute and hash the user.email in the span data before it is exported by the Agent.
Exercise
Start the Gateway: In the Gateway terminal window navigate to the [WORKSHOP]/6-sensitive-data directory and run:
../otelcol --config=gateway.yaml
Start the Agent: In the Agent terminal window navigate to the [WORKSHOP]/6-sensitive-data directory and run:
../otelcol --config=agent.yaml
Send a span:
In the Test terminal window change into the 6-sensitive-data directory.
Send the span containing sensitive data by running the curl command to send trace.json.
curl -X POST -i http://localhost:4318/v1/traces -H "Content-Type: application/json" -d "@trace.json"
Check the debug output: For both the Agent and Gateway debug output, confirm that user.account_password has been removed, and both user.phone_number & user.email have been updated.
Check file output: In the new gateway-traces.out file confirm that user.account_password has been removed, and user.phone_number & user.email have been updated:
The redaction processor gives precise control over which attributes and values are permitted or removed from telemetry data.
Earlier we configured the agent collector to:
Block sensitive data: Any values (in this case Credit card numbers) matching the provided regex patterns (Visa and MasterCard) are automatically detected and redacted.
This is achieved using the redaction processor you added earlier, where we define regex patterns to filter out unwanted data:
redaction/redact:# Processor Type/Nameallow_all_keys:true# False removes all key unless in allow list blocked_values:# List of regex to check and hash# Visa card regex. - Please note the '' around the regex- '\b4[0-9]{3}[\s-]?[0-9]{4}[\s-]?[0-9]{4}[\s-]?[0-9]{4}\b'# MasterCard card regex - Please note the '' around the regex- '\b5[1-5][0-9]{2}[\s-]?[0-9]{4}[\s-]?[0-9]{4}[\s-]?[0-9]{4}\b'summary:debug # Show detailed debug information about the redaction
Test the Redaction Processor
In this exercise, we will redact the user.visa & user.mastercardvalues in the span data before it is exported by the Agent.
Exercise
Prepare the terminals: Delete the *.out files and clear the screen.
Enable the redaction/redact processor: Edit agent.yaml and remove the # we inserted in the previous exercise.
Start the Gateway: In the Gateway terminal window navigate to the [WORKSHOP]/6-sensitive-data directory and run:
../otelcol --config=gateway.yaml
Start the Agent: In the Agent terminal window navigate to the [WORKSHOP]/6-sensitive-data directory and run:
../otelcol --config=agent.yaml
Send a span: Run the curl command and in the Test terminal window to send trace.json.
curl -X POST -i http://localhost:4318/v1/traces -H "Content-Type: application/json" -d "@trace.json"
Check the debug output: For both the Agent and Gateway confirm the values for user.visa & user.mastercard have been updated. Notice user.amex attribute value was NOT redacted because a matching regex pattern was not added to blocked_values
By including summary:debug in the redaction processor, the debug output will include summary information about which matching keys values were redacted, along with the count of values that were masked.
These are just a few examples of how attributes and redaction processors can be configured to protect sensitive data.
Stop the Agent and Gateway using Ctrl-C.
7. Transform Data
10 minutes
The Transform Processor lets you modify telemetry data—logs, metrics, and traces—as it flows through the pipeline. Using the OpenTelemetry Transformation Language (OTTL), you can filter, enrich, and transform data on the fly without touching your application code.
In this exercise we’ll update agent.yaml to include a Transform Processor that will:
Filter log resource attributes.
Parse JSON structured log data into attributes.
Set log severity levels based on the log message body.
You may have noticed that in previous logs, fields like SeverityText and SeverityNumber were undefined (this is typical of the filelog receiver). However, the severity is embedded within the log body:
<snip>
LogRecord #0
ObservedTimestamp: 2025-01-31 21:49:29.924017 +0000 UTC
Timestamp: 1970-01-01 00:00:00 +0000 UTC
SeverityText:
SeverityNumber: Unspecified(0)
Body: Str(2025-01-31 15:49:29 [WARN] - Do or do not, there is no try.)
</snip>
Logs often contain structured data encoded as JSON within the log body. Extracting these fields into attributes allows for better indexing, filtering, and querying. Instead of manually parsing JSON in downstream systems, OTTL enables automatic transformation at the telemetry pipeline level.
Exercise
Inside the [WORKSHOP] directory, create a new subdirectory named 7-transform.
Next, copy all contents from the 6-sensitve-data directory into 7-transform.
After copying, remove any *.out and *.log files.
Change all terminal windows to the [WORKSHOP]/7-transform directory.
Your updated directory structure will now look like this:
Switch to your Agent terminal window. Navigate to the [WORKSHOP]/7-transform-data directory and open the agent.yaml file in your editor.
Configure the transform processor and name it /logs: By using the -context: resource key we are targeting the resourceLog attributes of logs.
This configuration ensures that only the relevant resource attributes (com.splunk.sourcetype, host.name, otelcol.service.mode) are retained, improving log efficiency and reducing unnecessary metadata.
transform/logs:# Processor Type/Namelog_statements:# Log Processing Statements- context:resource # Log Contextstatements:# List of attribute keys to keep- keep_keys(attributes, ["com.splunk.sourcetype", "host.name", "otelcol.service.mode"])
Adding a Context Block for Log Severity Mapping: To properly set the severity_text and severity_number fields of a log record, we add another log context block within log_statements.
This configuration extracts the level value from the log body, maps it to severity_text, and assigns the appropriate severity_number:
- context:log # Log Contextstatements:# Transform Statements Array- set(cache, ParseJSON(body)) where IsMatch(body, "^\\{")- flatten(cache, "") - merge_maps(attributes, cache, "upsert")- set(severity_text, attributes["level"])- set(severity_number, 1) where severity_text == "TRACE"- set(severity_number, 5) where severity_text == "DEBUG"- set(severity_number, 9) where severity_text == "INFO"- set(severity_number, 13) where severity_text == "WARN"- set(severity_number, 17) where severity_text == "ERROR"- set(severity_number, 21) where severity_text == "FATAL"
Summary of Key Transformations:
Parse JSON: Extracts structured data from the log body.
Flatten JSON: Converts nested JSON objects into a flat structure.
Merge Attributes: Integrates extracted data into log attributes.
Map Severity Text: Assigns severity_text from the log’s level attribute.
Assign Severity Numbers: Converts severity levels into standardized numerical values.
You should have a singletransform processor containing two context blocks: one for resource and one for log.
This configuration ensures that log severity is correctly extracted, standardized, and structured for efficient processing.
Tip
This method of mapping all JSON fields to top-level attributes should only be used for testing and debugging OTTL. It will result in high cardinality in a production scenario.
Update the logs pipeline: Add the transform/logs: processor into the logs: pipeline:
logs:receivers:- otlp # OTLP Receiver- filelog/quotes # Filelog Receiver reading quotes.logprocessors:- memory_limiter # Memory Limiter Processor- resourcedetection # Adds system attributes to the data- resource/add_mode # Adds collector mode metadata- transform/logs # Transform Processor to update log lines- batch # Batch Processor, groups data before send
Validate the agent configuration using otelbin.io. For reference, the logs: section of your pipelines will look similar to this:
Start the Log Generator: In the Test terminal window, navigate to the [WORKSHOP]/7-transform-data directory and start the appropriate log-gen script for your system. We want to work with structured JSON logs, so add the -json flag.
./log-gen.sh -json
The script will begin writing lines to a file named ./quotes.log, while displaying a single line of output in the console.
Writing logs to quotes.log. Press Ctrl+C to stop.
Start the Gateway: In the Gateway terminal window navigate to the [WORKSHOP]/7-transform-data directory and run:
../otelcol --config=gateway.yaml
Start the Agent: In the Agent terminal window navigate to the [WORKSHOP]/7-transform-data directory and run:
../otelcol --config=agent.yaml
7.3 Test Transform Processor
This test verifies that the com.splunk/source and os.type metadata have been removed from the log resource attributes before being exported by the Agent. Additionally, the test ensures that:
The log body is parsed to extract severity information.
SeverityText and SeverityNumber are set on the LogRecord.
JSON fields from the log body are promoted to log attributes.
This ensures proper metadata filtering, severity mapping, and structured log enrichment before export.
Exercise
Check the debug output: For both the Agent and Gateway confirm that com.splunk/source and os.type have been removed:
Check the debug output: For both the Agent and Gateway confirm that SeverityText and SeverityNumber in the LogRecord is now defined with the severity level from the log body. Confirm that the JSON fields from the body can be accessed as top-level log Attributes:
LogRecord #0
ObservedTimestamp: 2025-01-31 21:49:29.924017 +0000 UTC
Timestamp: 1970-01-01 00:00:00 +0000 UTC
SeverityText: WARN
SeverityNumber: Warn(13)
Body: Str(2025-01-31 15:49:29 [WARN] - Do or do not, there is no try.)
Attributes:
-> log.file.path: Str(quotes.log)
-> timestamp: Str(2025-01-31 15:49:29)
-> level: Str(WARN)
-> message: Str(Do or do not, there is no try.)
Trace ID:
Span ID:
Flags: 0
{"kind": "exporter", "data_type": "logs", "name": "debug"}
LogRecord #0
ObservedTimestamp: 2025-01-31 21:49:29.924017 +0000 UTC
Timestamp: 1970-01-01 00:00:00 +0000 UTC
SeverityText:
SeverityNumber: Unspecified(0)
Body: Str(2025-01-31 15:49:29 [WARN] - Do or do not, there is no try.)
Attributes:
-> log.file.path: Str(quotes.log)
Trace ID:
Span ID:
Flags: 0
{"kind": "exporter", "data_type": "logs", "name": "debug"}
Check file output: In the new gateway-logs.out file verify the data has been transformed:
"resource":{"attributes":[{"key":"com.splunk.sourcetype","value":{"stringValue":"quotes"}},{"key":"host.name","value":{"stringValue":"YOUR_HOST_NAME"}},{"key":"otelcol.service.mode","value":{"stringValue":"agent"}}]},"scopeLogs":[{"scope":{},"logRecords":[{"observedTimeUnixNano":"1738360169924017000","severityText":"WARN","body":{"stringValue":"2025-01-31 15:49:29 [WARN] - Do or do not, there is no try."},"attributes":[{"key":"log.file.path","value":{"stringValue":"quotes.log"}},{"key":"timestamp","value":{"stringValue":"2025-01-31 15:49:29"}},{"key":"level","value":{"stringValue":"WARN"}},{"key":"message","value":{"stringValue":"Do or do not, there is no try."}}],"traceId":"","spanId":""}]}]
"resource":{"attributes":[{"key":"com.splunk.sourcetype","value":{"stringValue":"quotes"}},{"key":"com.splunk.source","value":{"stringValue":"./quotes.log"}},{"key":"host.name","value":{"stringValue":"YOUR_HOST_NAME"}},{"key":"os.type","value":{"stringValue":"YOUR_OS"}},{"key":"otelcol.service.mode","value":{"stringValue":"agent"}}]},"scopeLogs":[{"scope":{},"logRecords":[{"observedTimeUnixNano":"1738349801265812000","body":{"stringValue":"2025-01-31 12:56:41 [INFO] - There is some good in this world, and it's worth fighting for."},"attributes":[{"key":"log.file.path","value":{"stringValue":"quotes.log"}}],"traceId":"","spanId":""}]}]
8. Routing Data
10 minutes
The Routing Connector in OpenTelemetry is a powerful feature that allows you to direct data (traces, metrics, or logs) to different pipelines based on specific criteria. This is especially useful in scenarios where you want to apply different processing or exporting logic to subsets of your telemetry data.
For example, you might want to send production data to one exporter while directing test or development data to another. Similarly, you could route certain spans based on their attributes, such as service name, environment, or span name, to apply custom processing or storage logic.
Exercise
Inside the [WORKSHOP] directory, create a new subdirectory named 8-routing.
Next, copy all contents from the 7-transform-data directory into 8-routing.
After copying, remove any *.out and *.log files.
Change all terminal windows to the [WORKSHOP]/8-routing directory.
Your updated directory structure will now look like this:
Next, we will configure the routing connector and the respective pipelines.
Subsections of 8. Routing Data
8.1 Configure the Routing Connector
In this exercise, you will configure the routing connector in the gateway.yaml file. This setup enables the Gateway to route traces based on the deployment.environment attribute in the spans you send. By implementing this, you can process and handle traces differently depending on their attributes.
Exercise
Add the routing connector: In the Gateway terminal window edit gateway.yaml and add the following below the receivers: and processors: stanzas and above the exporters: stanza:
connectors:routing:default_pipelines:[traces/standard]# Default pipeline if no rule matcheserror_mode:ignore # Ignore errors in routingtable:# Define routing rules# Routes spans to a target pipeline if the resourceSpan attribute matches the rule- statement:route() where attributes["deployment.environment"] == "security_applications"pipelines:[traces/security] # Target pipeline
In OpenTelemetry configuration files, connectors have their own dedicated section, similar to receivers and processors. This approach also applies to metrics and logs, allowing them to be routed based on attributes in resourceMetrics or resourceLogs.
Configure file: exporters: The routing connector requires separate targets for routing. Add two file exporters, file/traces/security and file/traces/standard, to ensure data is directed correctly:
file/traces/standard:# Exporter for regular tracespath:"./gateway-traces-standard.out"# Path for saving trace dataappend:false# Overwrite the file each timefile/traces/security:# Exporter for security tracespath:"./gateway-traces-security.out"# Path for saving trace dataappend:false# Overwrite the file each time
With the routing configuration complete, the next step is to configure the pipelines to apply these routing rules.
8.2 Configuring the Pipelines
Exercise
Add both the standard and security traces pipelines:
Standard pipeline: This pipeline processes all spans that do not match the routing rule. Add it below the existing traces: pipeline, keeping the configuration unchanged for now:
traces/standard:# Default pipeline for unmatched spansreceivers:- routing # Receive data from the routing connectorprocessors:- memory_limiter # Limits memory usage- resource/add_mode # Adds collector mode metadataexporters:- debug # Debug exporter- file/traces/standard # File exporter for unmatched spans
Security pipeline: This pipeline will handle all spans that match the routing rule:
traces/security:# New Security Traces/Spans Pipeline receivers:- routing # Routing Connector, Only receives data from Connectorprocessors:- memory_limiter # Memory Limiter Processor- resource/add_mode # Adds collector mode metadataexporters:- debug # Debug Exporter - file/traces/security # File Exporter for spans matching rule
Update the traces pipeline to use routing:
To enable routing, update the original traces: pipeline by adding routing as an exporter. This ensures all span data is sent through the routing connector for evaluation.
Remove all processors as these are now defined in the traces/standard and traces/security pipelines.
By excluding the batch processor, spans are written immediately instead of waiting for multiple spans to accumulate before processing. This improves responsiveness, making the workshop run faster and allowing you to see results sooner.
Validate the agent configuration using otelbin.io. For reference, the traces: section of your pipelines will look similar to this:
In this section, we will test the routing rule configured for the Gateway. The expected result is that thespan from the security.json file will be sent to the gateway-traces-security.out file.
Exercise
Start the Gateway: In the Gateway terminal window navigate to the [WORKSHOP]/8-routing directory and run:
../otelcol --config=gateway.yaml
Start the Agent: In the Agent terminal window navigate to the [WORKSHOP]/8-routing directory and run:
../otelcol --config=agent.yaml
Create new security trace: In the Tests terminal window navigate to the [WORKSHOP]/8-routing directory.
The following JSON contains attributes which will trigger the routing rule. Copy the content from the tab below and save into a file named security.json.
{"resourceSpans":[{"resource":{"attributes":[{"key":"service.name","value":{"stringValue":"password_check"}},{"key":"deployment.environment","value":{"stringValue":"security_applications"}}]},"scopeSpans":[{"scope":{"name":"my.library","version":"1.0.0","attributes":[{"key":"my.scope.attribute","value":{"stringValue":"some scope attribute"}}]},"spans":[{"traceId":"5B8EFFF798038103D269B633813FC60C","spanId":"EEE19B7EC3C1B174","parentSpanId":"EEE19B7EC3C1B173","name":"I'm a server span","startTimeUnixNano":"1544712660000000000","endTimeUnixNano":"1544712661000000000","kind":2,"attributes":[{"keytest":"my.span.attr","value":{"stringValue":"some value"}}]}]}]}]}
8.4 Test Routing Connector
Exercise
Send a Regular Span:
Locate the Test terminal and navigate to the [WORKSHOP]/8-routing directory.
Send a regular span using the trace.json file to confirm proper communication.
Both the Agent and Gateway should display debug information, including the span you just sent. The gateway will also generate a new gateway-traces-standard.out file, as this is now the designated destination for regular spans.
Tip
If you check gateway-traces-standard.out, it should contain the span sent using the cURL command. You will also see an empty gateway-traces-security.out file, as the routing configuration creates output files immediately, even if no matching spans have been processed yet.
Send a Security Span:
Ensure both the Agent and Gateway are running.
Send a security span using the security.json file to test the gateway’s routing rule.
Again, both the Agent and Gateway should display debug information, including the span you just sent. This time, the Gateway will write a line to the gateway-traces-security.out file, which is designated for spans where the deployment.environment resource attribute matches "security_applications".
The gateway-traces-standard.out should be unchanged.
Tip
If you verify the ./gateway-traces-security.out it should only contain the spans from the "security_applications" deployment.environment.
You can repeat this scenario multiple times, and each trace will be written to its corresponding output file.
Conclusion
In this section, we successfully tested the routing connector in the gateway by sending different spans and verifying their destinations.
Regular spans were correctly routed to gateway-traces-standard.out, confirming that spans without a matching deployment.environment attribute follow the default pipeline.
Security-related spans from security.json were routed to gateway-traces-security.out, demonstrating that the routing rule based on "deployment.environment": "security_applications" works as expected.
By inspecting the output files, we confirmed that the OpenTelemetry Collector correctly evaluates span attributes and routes them to the appropriate destinations. This validates that routing rules can effectively separate and direct telemetry data for different use cases.
You can now extend this approach by defining additional routing rules to further categorize spans, metrics, and logs based on different attributes.
Stop the Agent, Gateway and the log-gen script in their respective terminals.
Wrap-up
Ingest Processor for Splunk Observability Cloud
Author
Tim Hard
As infrastructure and application environments become exceedingly complex, the volume of data they generate continues to grow significantly. This increase in data volume and variety makes it challenging to gain actionable insights and can impact problem identification and troubleshooting efficiencies. Additionally, the cost of storing and accessing this data can skyrocket. Many data sources, particularly logs and events, provide critical visibility into system operations. However, in most cases, only a few details from these extensive logs are actually needed for effective monitoring and alerting.
Common Challenges:
Increasing complexity of infrastructure and application environments.
Significant growth in data volume generated by these environments.
Challenges in gaining actionable insights from large volumes of data.
High costs associated with storing and accessing extensive data.
Logs and events provide critical visibility but often contain only a few essential details.
To address these challenges, Splunk Ingest Processor provides a powerful new feature: the ability to convert log events into metrics. Metrics are more efficient to store and process, allowing for faster identification of issues, thereby reducing Mean Time to Detection (MTTD). When retaining the original log or event is necessary, they can be stored in cheaper storage solutions such as S3, reducing the overall cost of data ingestion and computation required for searching them.
Solution:
Convert log events into metrics where possible.
Retain original logs or events in cheaper storage solutions if needed.
Utilize federated search for accessing and analyzing retained logs.
Outcomes:
Metrics are more efficient to store and process.
Faster identification of problems, reducing Mean Time to Detection (MTTD).
Lower overall data ingestion and computation costs.
Enhanced monitoring efficiency and resource optimization.
Maintain high visibility into system operations with reduced operational costs.
In this workshop you’ll have the opportunity to get hands on with Ingest Processor and Splunk Observability Cloud to see how it can be used to address the challenges outlined above and .
Tip
The easiest way to navigate through this workshop is by using:
the left/right arrows (< | >) on the top right of this page
the left (◀️) and right (▶️) cursor keys on your keyboard
Subsections of Ingest Processor for Splunk Observability Cloud
Getting Started
During this technical Ingest Processor1 for Splunk Observability Cloud workshop you will have the opportunity to get hands-on with Ingest Processor in Splunk Enterprise Cloud.
To simplify the workshop modules, a pre-configured Splunk Enterprise Cloud instance is provided.
The instance is pre-configured with all of the requirements for creating an Ingest Processor pipeline.
This workshop will introduce you to the benefits of using Ingest Processor to convert robust logs to metrics and send those metrics to Splunk Observability Cloud. By the end of these technical workshops, you will have a good understanding of some of the key features and capabilities of Ingest Processor in Splunk Enterprise Cloud and the value of using Splunk Observability Cloud as a destination within an Ingest Processor pipeline.
Here are the instructions on how to access your pre-configured Splunk Enterprise Cloud instance.
Ingest Processor is a data processing capability that works within your Splunk Cloud Platform deployment. Use the Ingest Processor to configure data flows, control data format, apply transformation rules prior to indexing, and route to destinations. ↩︎
Subsections of 1. Getting Started
How to connect to your workshop environment
How to retrieve the URL for your Splunk Enterprise Cloud instances.
How to access the Splunk Observability Cloud workshop organization.
1. Splunk Cloud Instances
There are three instances that will be used throughout this workshop which have already been provisioned for you:
Splunk Enterprise Cloud
Splunk Ingest Processor (SCS Tenant)
Splunk Observability Cloud
The Splunk Enterprise Cloud and Ingest Processor instances are hosted in Splunk Show. If you were invited to the workshop, you should have received an email with an invite to the event in Splunk Show or a link to the event will have been provided at the beginning of the workshop.
Login to Splunk Show using your splunk.com credentials. You should see the event for this workshop. Open the event to see the instance details for your Splunk Cloud and Ingest Processor instances.
Note
Take note of the User Id provided in your Splunk Show event details. This number will be included in the sourcetype that you will use for searching and filtering the Kubernetes data. Because this is a shared environment only use the participant number provided so that other participants data is not effected.
2. Splunk Observability Cloud Instances
You should have also received an email to access the Splunk Observability Cloud workshop organization (You may need to check your spam folder). If you have not received an email, let your workshop instructor know. To access the environment click the Join Now button.
Important
If you access the event before the workshop start time, your instances may not be available yet. Don’t worry, they will provided once the workshop begins.
Additionally, you have been invited to a Splunk Observability Cloud workshop organization. The invitation includes a link to the environment. If you don’t have a Splunk Observability Cloud account already, you will be asked to create one. If you already have one, you can login to the instance and you will see the workshop organization in your available organizations.
How Ingest Processor Works
System architecture
The primary components of the Ingest Processor service include the Ingest Processor service and SPL2 pipelines that support data processing. The following diagram provides an overview of how the components of the Ingest Processor solution work together:
Ingest Processor service
The Ingest Processor service is a cloud service hosted by Splunk. It is part of the data management experience, which is a set of services that fulfill a variety of data ingest and processing use cases.
You can use the Ingest Processor service to do the following:
Create and apply SPL2 pipelines that determine how each Ingest Processor processes and routes the data that it receives.
Define source types to identify the kind of data that you want to process and determine how the Ingest Processor breaks and merges that data into distinct events.
Create connections to the destinations that you want your Ingest Processor to send processed data to.
Pipelines
A pipeline is a set of data processing instructions written in SPL2. When you create a pipeline, you write a specialized SPL2 statement that specifies which data to process, how to process it, and where to send the results. When you apply a pipeline, the Ingest Processor uses those instructions to process all the data that it receives from data sources such as Splunk forwarders, HTTP clients, and logging agents.
Each pipeline selects and works with a subset of all the data that the Ingest Processor receives. For example, you can create a pipeline that selects events with the source type cisco_syslog from the incoming data, and then sends them to a specified index in Splunk Cloud Platform. This subset of selected data is called a partition. For more information, see Partitions.
The Ingest Processor solution supports only the commands and functions that are part of the IngestProcessor profile. For information about the specific SPL2 commands and functions that you can use to write pipelines for Ingest Processor, see Ingest Processor pipeline syntax. For a summary of how the IngestProcessor profile supports different commands and functions compared to other SPL2 profiles, see the following pages in the SPL2 Search Reference:
In this scenario you will be playing the role of a Splunk Admin responsible for managing your organizations Splunk Enterprise Cloud environment. You recently worked with an internal application team on instrumenting their Kubernetes environment with Splunk APM and Infrastructure monitoring using OpenTelemetry to monitor their critical microservice applications.
The logs from the Kubernetes environment are also being collected and sent to Splunk Enter Prize Cloud. These logs include:
Pod logs (application logs)
Kubernetes Events
Kubernetes Cluster Logs
Control Plane Node logs
Worker Node logs
Audit Logs
As a Splunk Admin you want to ensure that the data you are collecting is optimized so it can be analyzed in the most efficient way possible. Taking this approach accelerates troubleshooting and ensures efficient license utilization.
One way to accomplish this is by using Ingest Processor to convert robust logs to metrics and use Splunk Observability Cloud as the destination for those metrics. Not only does this make collecting the logs more efficient, you have the added ability of using the newly created metrics in Splunk Observability which can then be correlated with Splunk APM data (traces) and Splunk Infrastructure Monitoring data providing additional troubleshooting context. Because Splunk Observability Cloud uses a streaming metrics pipeline, the metrics can be alerted on in real-time speeding up problem identification. Additionally, you can use the Metrics Pipeline Management functionality to further optimize the data by aggregating, dropping unnecessary fields, and archiving less important or un-needed metrics.
In the next step you’ll create an Ingest Processor Pipeline which will convert Kubernetes Audit Logs to metrics that will be sent to Observability Cloud.
Subsections of 3. Create an Ingest Pipeline
Login to Splunk Cloud
In this section you will create an Ingest Pipeline which will convert Kubernetes Audit Logs to metrics which are sent to the Splunk Observability Cloud workshop organization. Before getting started you will need to access the Splunk Cloud and Ingest Processor SCS Tenant environments provided in the Splunk Show event details.
Pre-requisite: Login to Splunk Enterprise Cloud
1. Open the Ingest Processor Cloud Stack URL provided in the Splunk Show event details.
2. In the Connection info click on the Stack URL link to open your Splunk Cloud stack.
3. Use the admin username and password to login to Splunk Cloud.
4. After logging in, if prompted, accept the Terms of Service and click OK
5. Navigate back to the Splunk Show event details and select the Ingest Processor SCS Tenant
6. Click on the Console URL to access the Ingest Processor SCS Tenant
Note
Single Sign-On (SSO)
Single Sign-on (SSO) is configured between the Splunk Data Management service (‘SCS Tenant’) and Splunk Cloud environments, so if you already logged in to your Splunk Cloud stack you should automatically be logged in to Splunk Data Management service. If you are prompted for credentials, use the credentials provided in the Splunk Cloud Stack on Splunk Show event (listed under the ‘Splunk Cloud Stack’ section.)
Review Kubernetes Audit Logs
In this section you will review the Kubernetes Audit Logs that are being collected. You can see that the events are quite robust, which can make charting them inefficient. To address this, you will create an Ingest Pipeline in Ingest Processor that will convert these events to metrics that will be sent to Splunk Observability Cloud. This will allow you to chart the events much more efficiently and take advantage of the real-time streaming metrics in Splunk Observability Cloud.
Exercise: Create Ingest Pipeline
1. Open your Ingest Processor Cloud Stack instance using the URL provided in the Splunk Show workshop details.
2. Navigate to Apps -> Search and Reporting
3. In the search bar, enter the following SPL search string.
Note
Make sure to replace USER_ID with the User ID provided in your Splunk Show instance information.
```Replace USER_ID with the User ID provided in your Splunk Show instance information```
index=main sourcetype="kube:apiserver:audit:USER_ID"
4. Press Enter or click the green magnifying glass to run the search.
You should now see the Kubernetes Audit Logs for your environment. Notice that the events are fairly robust. Explore the available fields and start to think about what information would be good candidates for metrics and dimensions. Ask yourself: What fields would I like to chart and how would I like to be able to filter, group, or split those fields?
Create an Ingest Pipeline
In this section you will create an Ingest Pipeline which will convert Kubernetes Audit Logs to metrics which are sent to the Splunk Observability Cloud workshop organization.
Exercise: Create Ingest Pipeline
1. Open the Ingest Processor SCS Tenant using the connection details provided in the Splunk Show event.
Note
When you open the Ingest Processor SCS Tenant, if you are taken to a welcome page, click on Launch under Splunk Cloud Platform to be taken the the Data Management page where you will configure the Ingest Pipeline.
2. From the Splunk Data Management console select Pipelines -> New pipeline -> Ingest Processor pipeline.
3. In the Get started step of the Ingest Processor configuration page select Blank Pipeline and click Next.
4. In the Define your pipeline’s partition step of the Ingest Processor configuration page select Partition by sourcetype. Select the = equals Operator and enter kube:apiserver:audit:USER_ID (Be sure to replace USER_ID with the User ID you were assigned) for the value. Click Apply.
5. Click Next
6. In the Add sample data step of the Ingest Processor configuration page select Capture new snapshot. Enter k8s_audit_USER_ID (Be sure to replace USER_ID with the User ID you were assigned) for the Snapshot name and click Capture.
7. Make sure your newly created snapshot (k8s_audit_USER_ID) is selected and then click Next.
8. In the Select a metrics destination step of the Ingest Processor configuration page select show_o11y_org. Click Next.
9. In the Select a data destination step of the Ingest Processor configuration page select splunk_indexer. Under Specify how you want your events to be routed to an index select Default. Click Done.
10. In the Pipeline search field replace the default search with the following.
Note
Replace UNIQUE_FIELD in the metric name with a unique value (such as your initials) which will be used to identify your metric in Observability Cloud.
/*A valid SPL2 statement for a pipeline must start with "$pipeline", and include "from $source" and "into $destination".*/
/* Import logs_to_metrics */
import logs_to_metrics from /splunk/ingest/commands
$pipeline =
| from $source
| thru [
//define the metric name, type, and value for the Kubernetes Events
//
// REPLACE UNIQUE_FIELD WITH YOUR INITIALS
//
| logs_to_metrics name="k8s_audit_UNIQUE_FIELD" metrictype="counter" value=1 time=_time
| into $metrics_destination
]
| eval index = "kube_logs"
| into $destination;
New to SPL2?
Here is a breakdown of what the SPL2 query is doing:
First, you are importing the built in logs_to_metrics command which will be used to convert the kubernetes events to metrics.
You’re using the source data, which you can see on the right is any event from the kube:apiserver:audit sourcetype.
Now, you use the thru command which writes the source dataset to the following command, in this case logs_to_metrics.
You can see that the metric name (k8s_audit), metric type (counter), value, and timestamp are all provided for the metric. You’re using a value of 1 for this metric because we want to count the number of times the event occurs.
Next, you choose the destination for the metric using the into $metrics_destintation command, which is our Splunk Observability Cloud organization
Finally, you can send the raw log events to another destination, in this case another index, so they are retained if we ever need to access them.
11. In the upper-right corner click the Preview button or press CTRL+Enter (CMD+Enter on Mac). From the Previewing $pipeline dropdown select $metrics_destination. Confirm you are seeing a preview of the metrics that will be sent to Splunk Observability Cloud.
12. In the upper-right corner click the Save pipeline button . Enter Kubernetes Audit Logs2Metrics USER_ID for your pipeline name and click Save.
13. After clicking save you will be asked if you would like to apply the newly created pipeline. Click Yes, apply.
The Ingest Pipeline should now be sending metrics to Splunk Observability Cloud. Keep this tab open as it will be used it again in the next section.
In the next step you’ll confirm the pipeline is working by viewing the metrics you just created in Splunk Observability Cloud.
Confirm Metrics in Splunk Observability Cloud
Now that an Ingest Pipeline has been configured to convert Kubernetes Audit Logs into metrics and send them to Splunk Observability Cloud the metrics should be available. To confirm the metrics are being collected complete the following steps:
Exercise: Confirm Metrics in Splunk Observability Cloud
1. Login to the Splunk Observability Cloud organization you were invited for the workshop. In the upper-right corner, click the + Icon -> Chart to create a new chart.
2. In the Plot Editor of the newly created chart enter the metric name you used while configuring the Ingest Pipeline.
You should see the metric you created in the Ingest Pipeline. Keep this tab open as it will be used again in the next section.
In the next step you will update the ingest pipeline to add dimensions to the metric so you have additional context for alerting and troubleshooting.
Update Pipeline and Visualize Metrics
Context Matters
In the previous section, you reviewed the raw Kubernetes audit logs and created an Ingest Processor Pipeline to convert them to metrics and send those metrics to Splunk Observability Cloud.
Now that this pipeline is defined we are collecting the new metrics in Splunk Observability Cloud. This is a great start; however, you will only see a single metric showing the total number of kubernetes audit events for a given time period. It would be much more valuable to add dimensions so that you can split the metric by the event type, user, response status, and so on.
In this section you will update the Ingest Processor Pipeline to include additional dimensions from the Kubernetes audit logs to the metrics that are being collected. This will allow you to further filter, group, visualize, and alert on specific aspects of the audit logs. After updating the metric, you will create a new dashboard showing the status of the different types of actions associated with the logs.
Subsections of 4. Update Pipeline and Visualize Metrics
Update Ingest Pipeline
Exercise: Update Ingest Pipeline
1. Navigate back to the configuration page for the Ingest Pipeline you created in the previous step.
2. To add dimensions to the metric from the raw Kubernetes audit logs update the SPL2 query you created for the pipeline by replacing the logs_to_metrics portion of the query with the following:
Note
Be sure to update the metric name field (name="k8s_audit_UNIQUE_FIELD") to the name you provided in the original pipeline
Using the dimensions field in the SPL2 query you can add dimensions from the raw events to the metrics that will be sent to Splunk Observability Cloud. In this case you are adding the event response status, namespace, kubernetes resource, user, and verb (action that was performed). These dimensions can be used to create more granular dashboards and alerts.
You should consider adding any common tags across your services so that you can take advantage of context propagation and related content in Splunk Observability Cloud.
The updated pipeline should now be the following:
/*A valid SPL2 statement for a pipeline must start with "$pipeline", and include "from $source" and "into $destination".*/
/* Import logs_to_metrics */
import logs_to_metrics from /splunk/ingest/commands
$pipeline =
| from $source
| thru [
//define the metric name, type, and value for the Kubernetes Events
//
// REPLACE UNIQUE_FIELD WITH YOUR INITIALS
//
| logs_to_metrics name="k8s_audit_UNIQUE_FIELD" metrictype="counter" value=1 time=_time dimensions={"level": _raw.level, "response_status": _raw.responseStatus.code, "namespace": _raw.objectRef.namespace, "resource": _raw.objectRef.resource, "user": _raw.user.username, "action": _raw.verb}
| into $metrics_destination
]
| eval index = "kube_logs"
| into $destination;
3. In the upper-right corner click the Preview button or press CTRL+Enter (CMD+Enter on Mac). From the Previewing $pipeline dropdown select $metrics_destination. Confirm you are seeing a preview of the metrics that will be sent to Splunk Observability Cloud.
4. Confirm you are seeing the dimensions in the dimensions column of the preview table. You can view the entire dimensions object by clicking into the table.
5. In the upper-right corner click the Save pipeline button . On the “You are editing an active pipeline modal” click Save.
Because this pipeline is already active, the changes you made will take effect immediately. Your metric should now be split into multiple metric timeseries using the dimensions you added.
In the next step you will create a visualization using different dimensions from the kubernetes audit events.
Visualize Kubernetes Audit Event Metrics
Now that your metric has dimensions you will create a chart showing the health of different Kubernetes actions using the verb dimension from the events.
1. If you closed the chart you created in the previous section, in the upper-right corner, click the + Icon -> Chart to create a new chart.
2. In the Plot Editor of the newly created chart enter k8s_audit* in the metric name field. You will use a wildcard here so that you can see all of the metrics that are being ingested.
3. Notice the change from one to many metrics, which is when you updated the pipeline to include the dimensions. Now that we have this metric available, let’s adjust the chart to show us if any of our actions have errors associated with them.
First you'll filter the Kubernetes events to only those that were not successful using the HTTP response code which is available in the response_status field. We only want events that have a response code of 409, which indicates that there was a conflict (for example a trying to create a resource that already exists) or 503, which indicates that the API was unresponsive for the request.
4. In the plot editor of your chart click the Add filter, use response_status for the field and select 409.0 and 503.0 for the values.
Next, you’ll add a function to the chart which will calculate the total number of events grouped by the resource, action, and response status. This will allow us to see exactly which actions and the associated resources had errors. Now we are only looking at kubernetes events that were not successful.
5. Click Add analytics -> Sum -> Sum:Aggregation and add resource, action, and response_status in the Group by field.
6. Using the chart type along the top buttons, change the chart to a heatmap. Next to the Plot editor, click Chart options. In the Group by section select response_status then action. Change the Color threshold from Auto to Fixed. Click the blue + button to add another threshold. Change the Down arrow to Yellow, the Middle to orange. Leave the Up arrow as red. Enter 5 for the middle threshold and 20 for the upper threshold.
7. In the upper right corner of the chart click the blue Save as… button. Enter a name for your chart (For Example: Kubernetes Audit Logs - Conflicts and Failures).
8. On the Choose a dashboard select New dashboard.
9. Enter a name for your dashboard that includes your initials so you can easily find it later. Click Save.
10. Make sure the new dashboard you just created is selected and click Ok.
You should now be taken to your new Kubernetes Audit Events dashboard with the chart you created. You can add new charts from other metrics in your environment, such as application errors and response times from the applications running in the Kubernetes cluster, or other Kubernetes metrics such as pod phase, pod memory utilization, etc. giving you a correlated view of your Kubernetes environment from cluster events to application health.
Conclusion
In this workshop, you walked through the entire process of optimizing Kubernetes log management by converting detailed log events into actionable metrics using Splunk Ingest Pipelines. You started by defining a pipeline that efficiently converts Kubernetes audit logs into metrics, drastically reducing the data volume while retaining critical information. You then ensured the raw log events were securely stored in S3 for long-term retention and deeper analysis.
Next, you demonstrated how to enhance these metrics by adding key dimensions from the raw events, enabling us to drill down into specific actions and resources. you created a chart that filtered the metrics to focus on errors, breaking them out by resource and action. This allowed us to pinpoint exactly where issues were occurring in real-time.
The real-time architecture of Splunk Observability Cloud means that these metrics can trigger alerts the moment an issue is detected, significantly reducing the Mean Time to Detection (MTTD). Additionally, you showed how this chart can be easily saved to new or existing dashboards, ensuring ongoing visibility and monitoring of critical metrics.
The value behind this approach is clear: by converting logs to metrics using Ingest Processor, you not only streamline data processing and reduce storage costs but also gain the ability to monitor and respond to issues in real-time using Splunk Observability Cloud. This results in faster problem resolution, improved system reliability, and more efficient resource utilization, all while maintaining the ability to retain and access the original logs for compliance or deeper analysis.