Log Observer Overview

5 minutes  

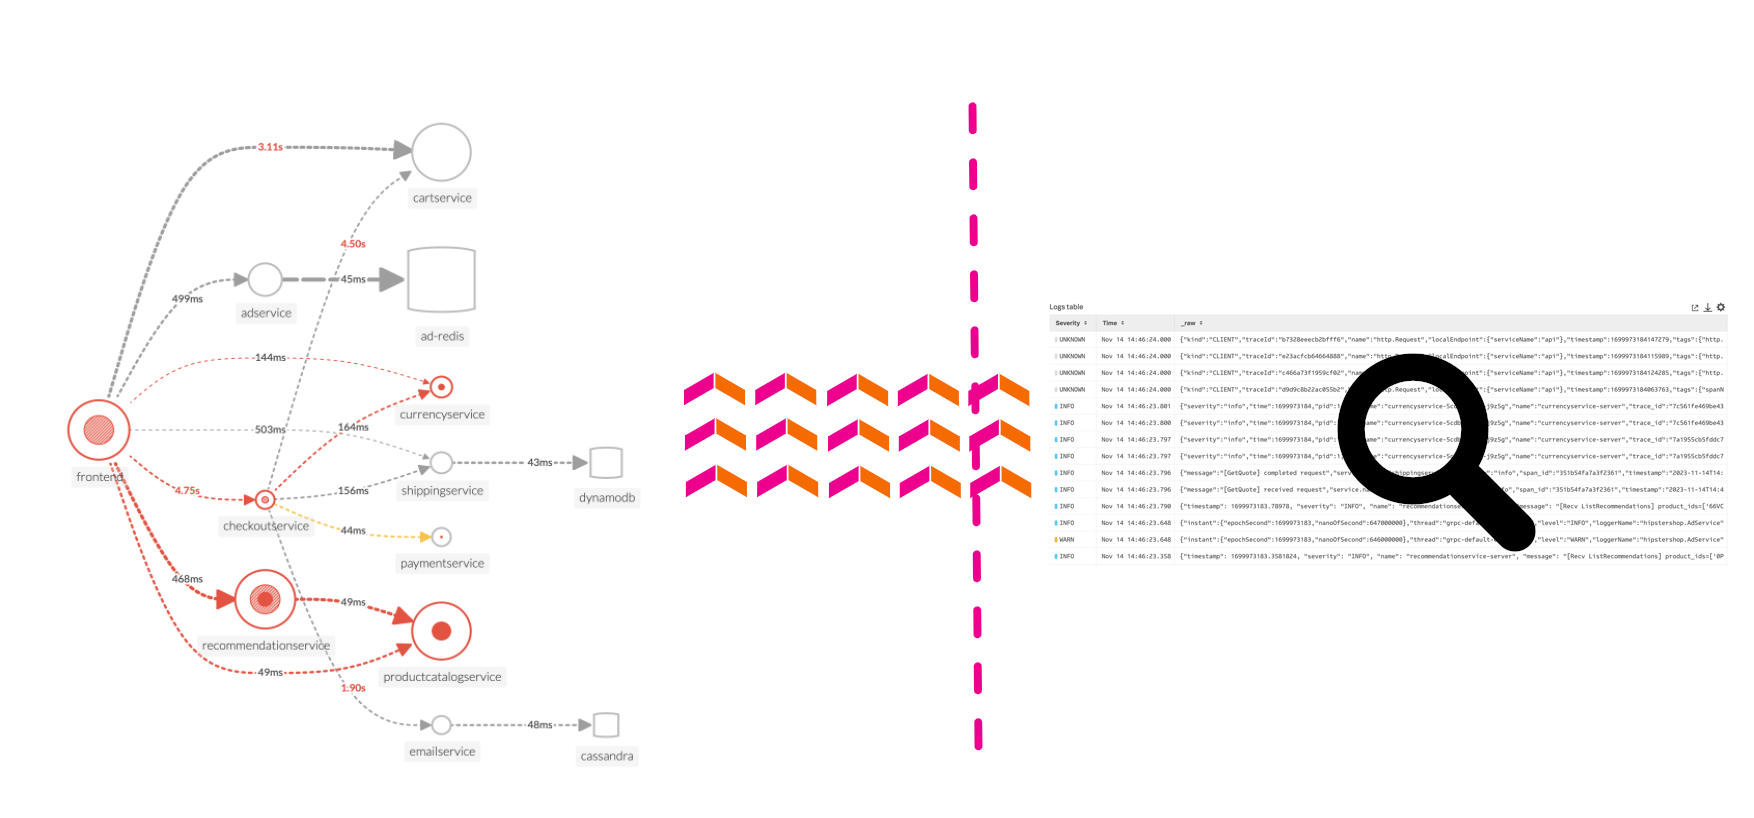
Log Observer Connect allows you to seamlessly bring in the same log data from your Splunk Platform into an intuitive and no-code interface designed to help you find and fix problems quickly. You can easily perform log-based analysis and seamlessly correlate your logs with Splunk Infrastructure Monitoring’s real-time metrics and Splunk APM traces in one place.

End-to-end visibility: By combining the powerful logging capabilities of Splunk Platform with Splunk Observability Cloud’s traces and real-time metrics for deeper insights and more context of your hybrid environment.
Perform quick and easy log-based investigations: By reusing logs that are already ingested in Splunk Cloud Platform or Enterprise in a simplified and intuitive interface (no need to know SPL!) with customizable and out-of-the-box dashboards
Achieve higher economies of scale and operational efficiency: By centralizing log management across teams, breaking down data and team silos, and getting better overall support
Logo graph Logo graph

Last Modified Apr 28, 2025

Subsections of 4. Log Observer Overview

Log Observer Home Page

Click Log Observer in the main menu, the Log Observer Home Page is made up of 4 distinct sections:

Lo Page Lo Page

  1. Onboarding Pane: Training videos and links to documentation to get you started with Splunk Log Observer.
  2. Filter Bar: Filter on time, indexes, and fields and also Save Queries.
  3. Logs Table Pane: List of log entries that match the current filter criteria.
  4. Fields Pane: List of fields available in the currently selected index.
Splunk indexes

Generally, in Splunk, an “index” refers to a designated place where your data is stored. It’s like a folder or container for your data. Data within a Splunk index is organized and structured in a way that makes it easy to search and analyze. Different indexes can be created to store specific types of data. For example, you might have one index for web server logs, another for application logs, and so on.

Tip

If you have used Splunk Enterprise or Splunk Cloud before, you are probably used to starting investigations with logs. As you will see in the following exercise, you can do that with Splunk Observability Cloud as well. This workshop, however, will use all the OpenTelemetry signals for investigations.

Let’s run a little search exercise:

Exercise
  • Set the time frame to -15m.

  • Click on Add Filter in the filter bar then click on Fields in the dialog.

  • Type in cardType and select it.

  • Under Top values click on visa, then click on = to add it to the filter.

  • Click Run search

    logo search logo search

  • Click on one of the log entries in the Logs table to validate that the entry contains cardType: "visa".

  • Let’s find all the orders that have been shipped. Click on Clear All in the filter bar to remove the previous filter.

  • Click again on Add Filter in the filter bar, then select Keyword. Next just type order in the Enter Keyword… box and press enter.

  • Click Run search

  • You should now only have log lines that contain the word order. There are still a lot of log lines, so let’s filter some more.

  • Add another filter, this time select the Fields box, then type severity in the Find a field … search box and select it. severity severity

  • Under Top values click on error, then click on = to add it to the filter.

  • Click Run search

  • You should now have a list of orders that failed to complete for the last 15 minutes.

Next, let’s check out Splunk Synthetics.