Intro to Dashboards
10 minutes1. Dashboards
Dashboards are collections of charts and visualizations that display key metrics in one place. A well-designed dashboard gives you quick, actionable insights into the health and performance of your system. They can be as simple or as detailed as needed—ranging from a few focused charts to complex views across multiple services.
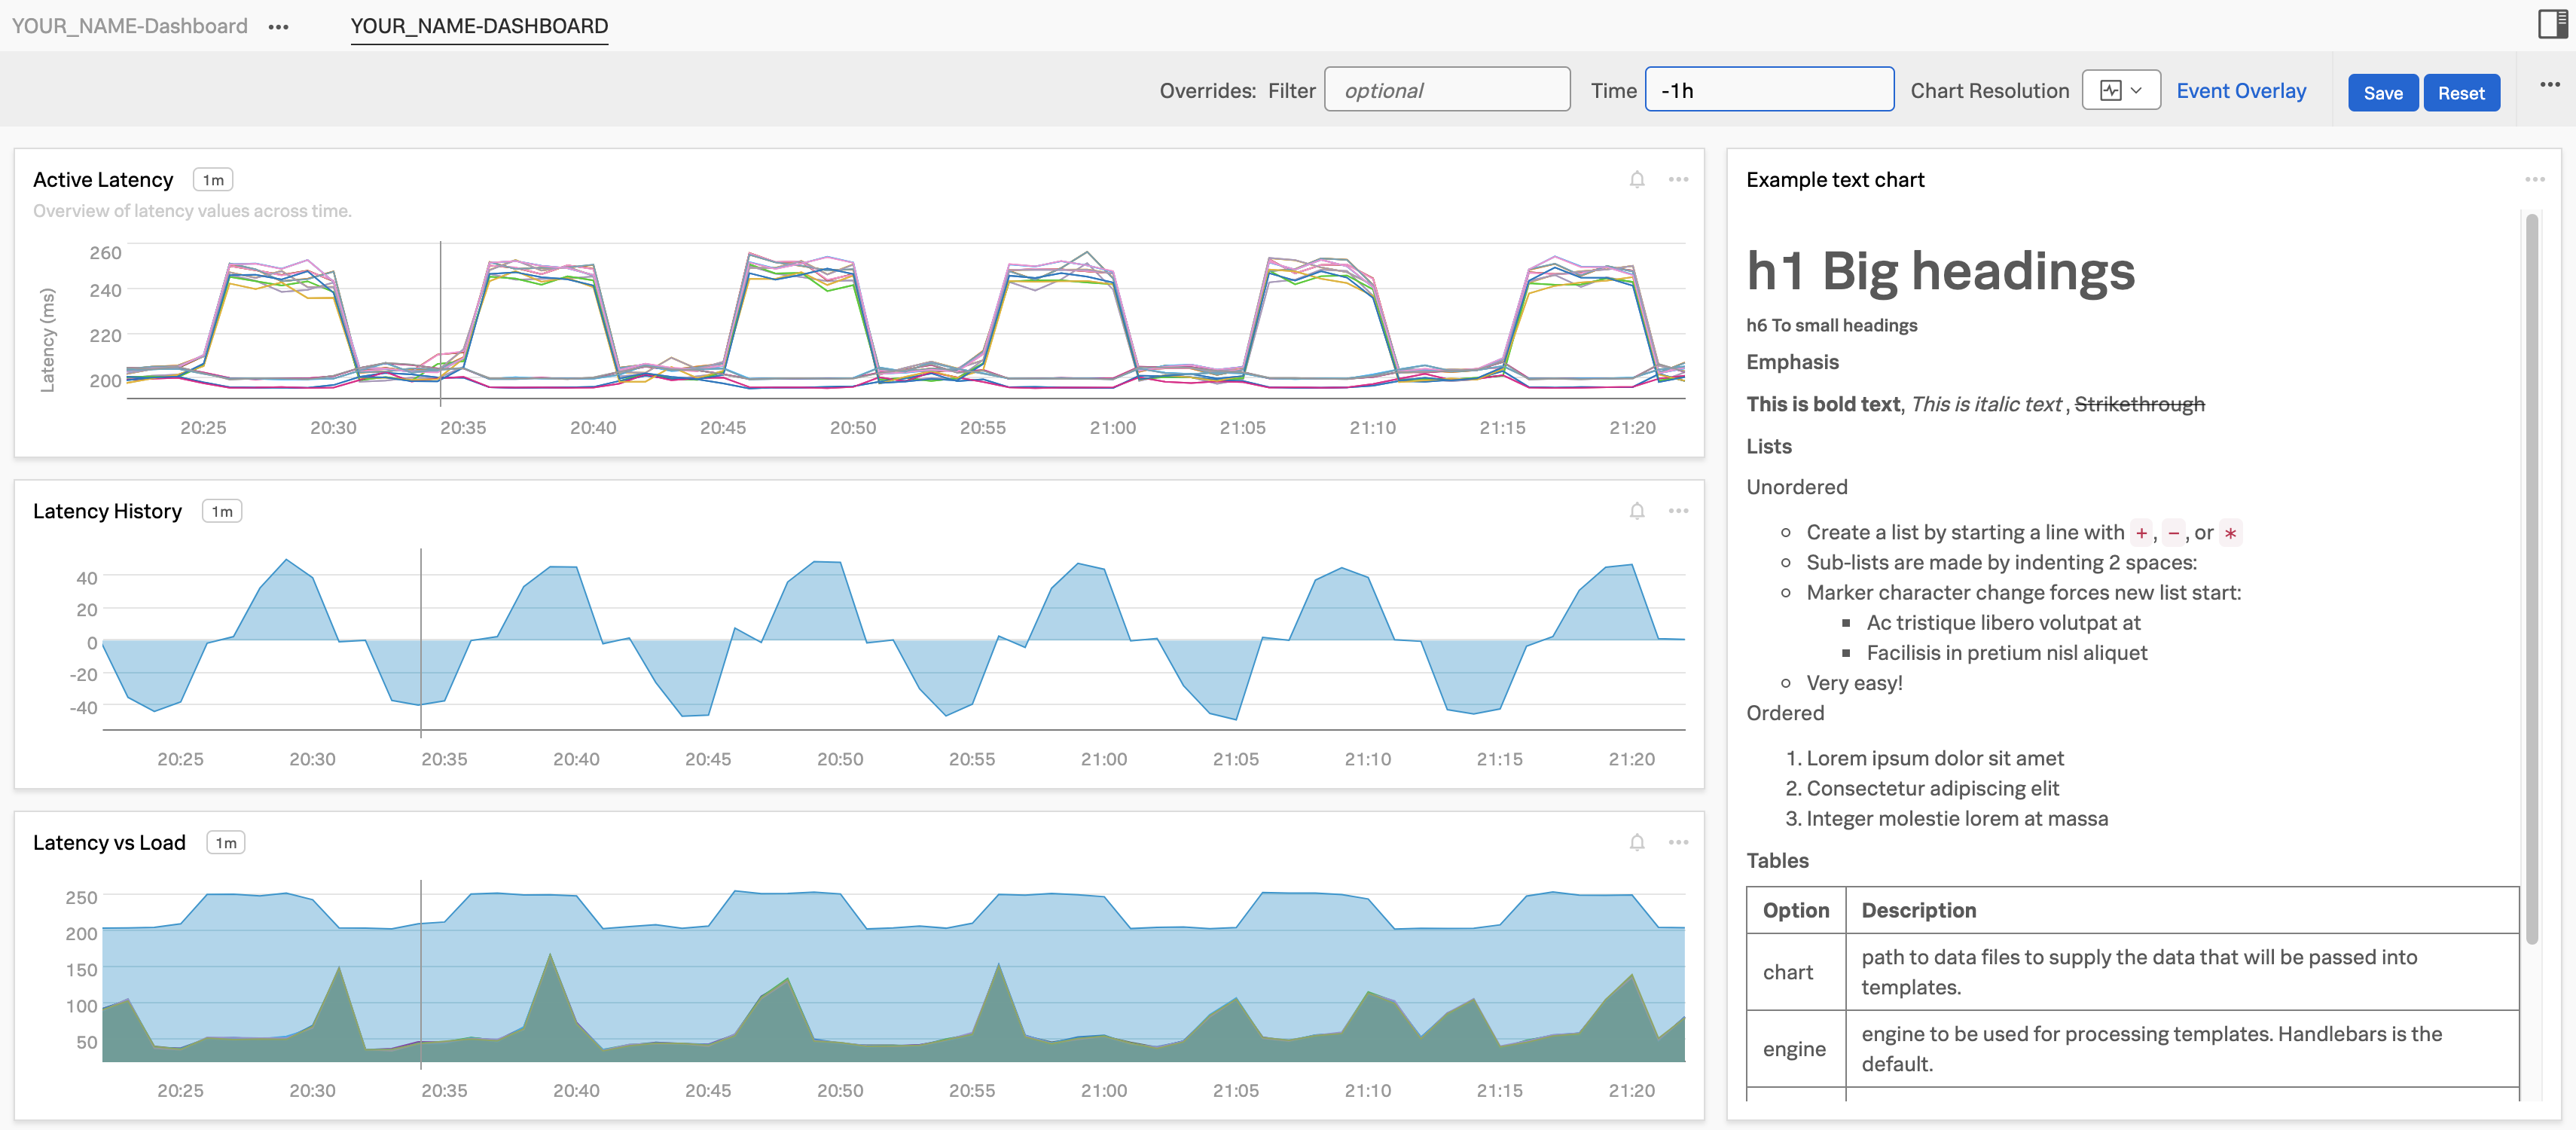
In this module, you’ll build several charts and bring them together into the following custom dashboard.
2. Accessing Dashboards
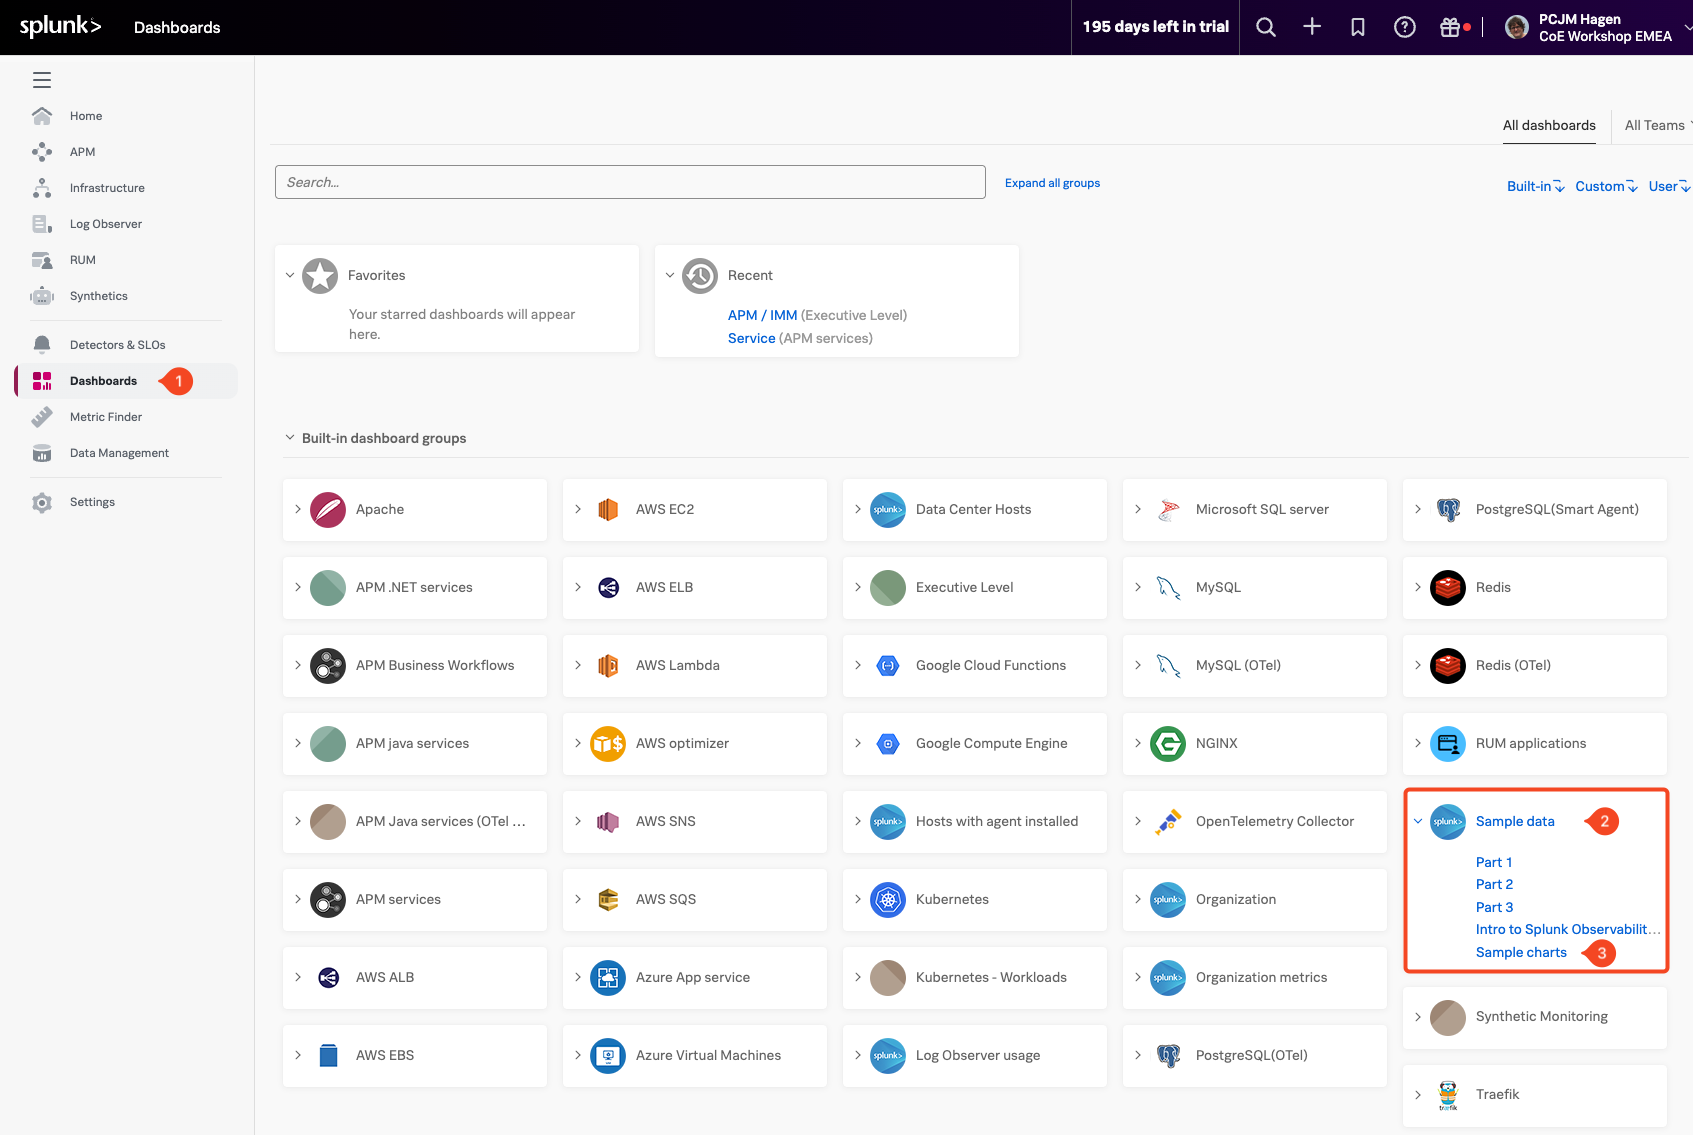
To begin, let’s locate the dashboards in Splunk Observability suite.
Click the Dashboards (1) button in the left-hand navigation menu. If the menu is collapsed, you can expand it by clicking the hamburger icon in the top-left corner of the screen.
This will take you to the main Dashboard view, where you’ll see all available dashboards—including the pre-built ones provided by Splunk Observability.
If your organization is already ingesting data from a Cloud API integration or through the Splunk OpenTelemetry Agent, you may also see additional dashboards relevant to those services.