Saving Charts and Dashboards
Once you’ve customized a chart to fit your needs, the next step is to save it as part of a dashboard. Saving your work lets you reuse, share, and monitor key visualizations over time. In this section, you’ll learn how to name and describe your chart, and how to add it to a dashboard for easy access later.
1. Saving a Chart
To begin saving your chart, let’s give it a clear name and description.
Click on the chart title, currently labeled Copy of Latency Histogram, and rename it to “Active Latency” (1).
Next, update the chart description. Click on the existing text, Spread of latency values across time, and change it to: Overview of latency values in real-time. (2)
These updates help make the chart easier to identify and understand when it’s part of a larger dashboard or shared with others.
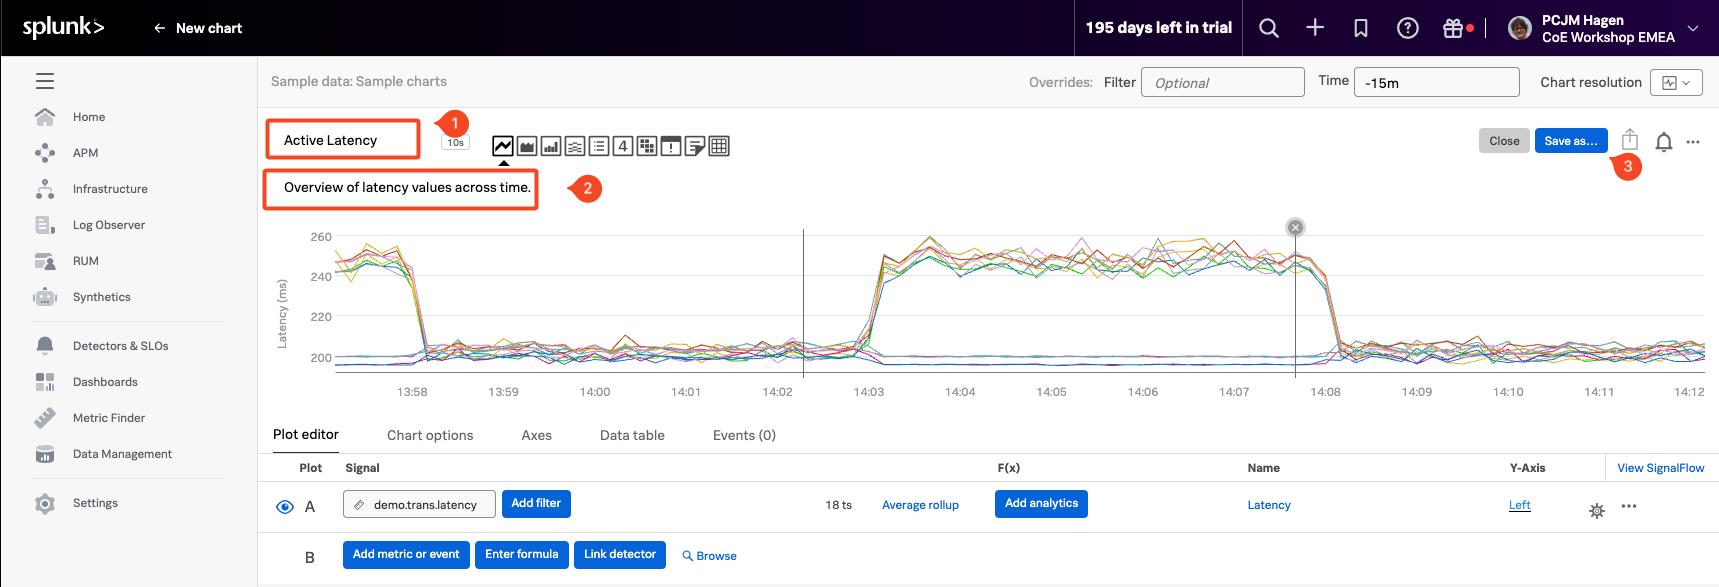
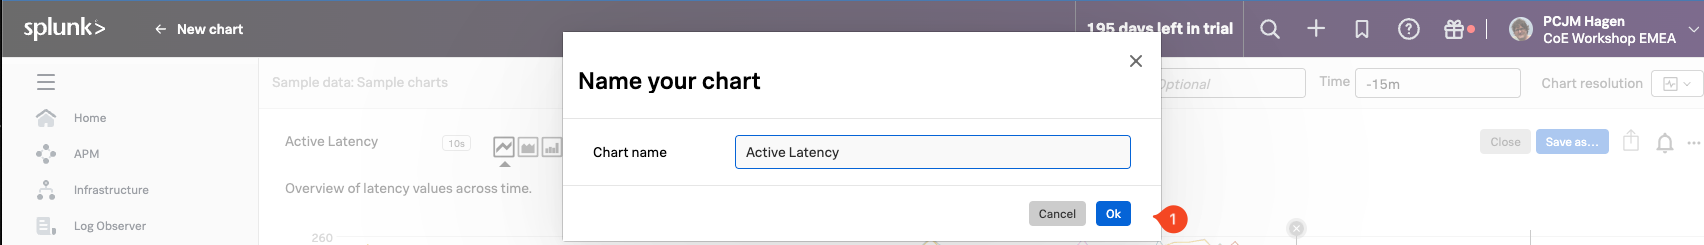
Click the Save As (3) button to begin the saving process. The chart will use the name Active Latency that you set earlier, but you can update the name here if needed.
Once you’re ready, click the Ok (1) button to confirm and continue.
2. Creating a dashboard
Now that we’re saving the chart, we need somewhere to store it—a dashboard.
Dashboards help organize and group related charts together, making it easier to monitor key metrics in one view. For this workshop, we’ll create a new dashboard to hold the charts we are building.
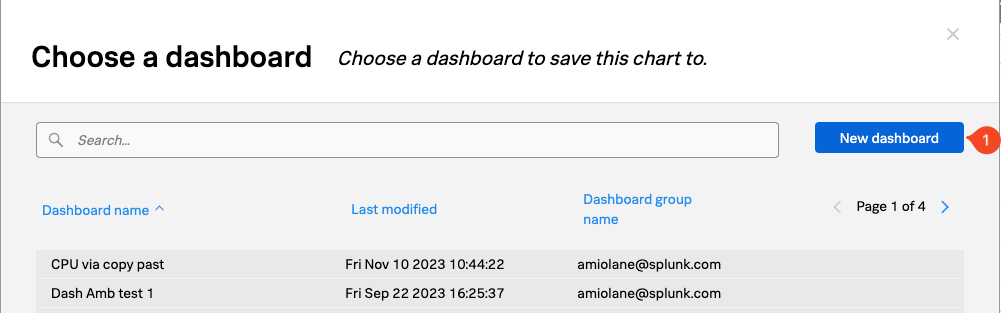
In the Choose dashboard dialog, click the New Dashboard (1) button.
Important: Do not select an existing dashboard—make sure to create a new one for this exercise.
You’ll now see the New Dashboard dialog, where you can configure the details of your new dashboard.
Start by giving your dashboard a name. For this workshop, use the following format: YOUR_NAME-Dashboard Replace YOUR_NAME with your actual name to make your dashboard easy to identify.
Next, update the permissions. Set them to Restricted Read and Write access, to ensure that only you (or specific users) can view and modify the dashboard. Make sure your user account is included and has both read and write access.
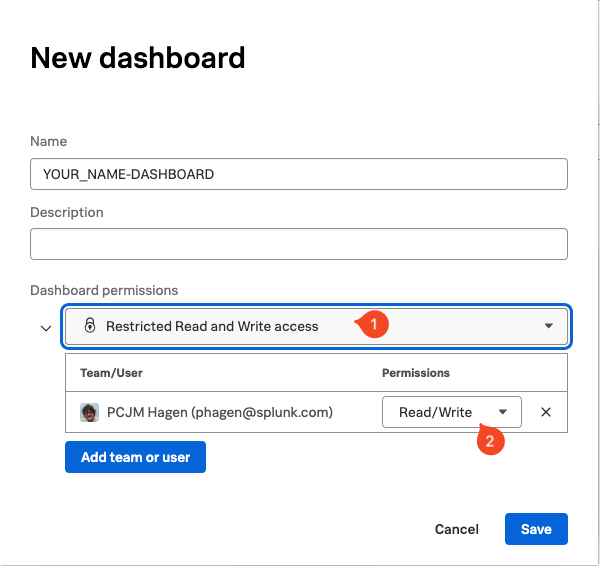
You should now see your own user account listed in the permissions, which means you are currently the only one who can edit this dashboard.
If needed, you can add additional users or teams by selecting them from the dropdown below.
For the purposes of this workshop, let’s remove the restrictions. Change the permissions setting to Everyone can Read and Write so that access isn’t limited during the session.
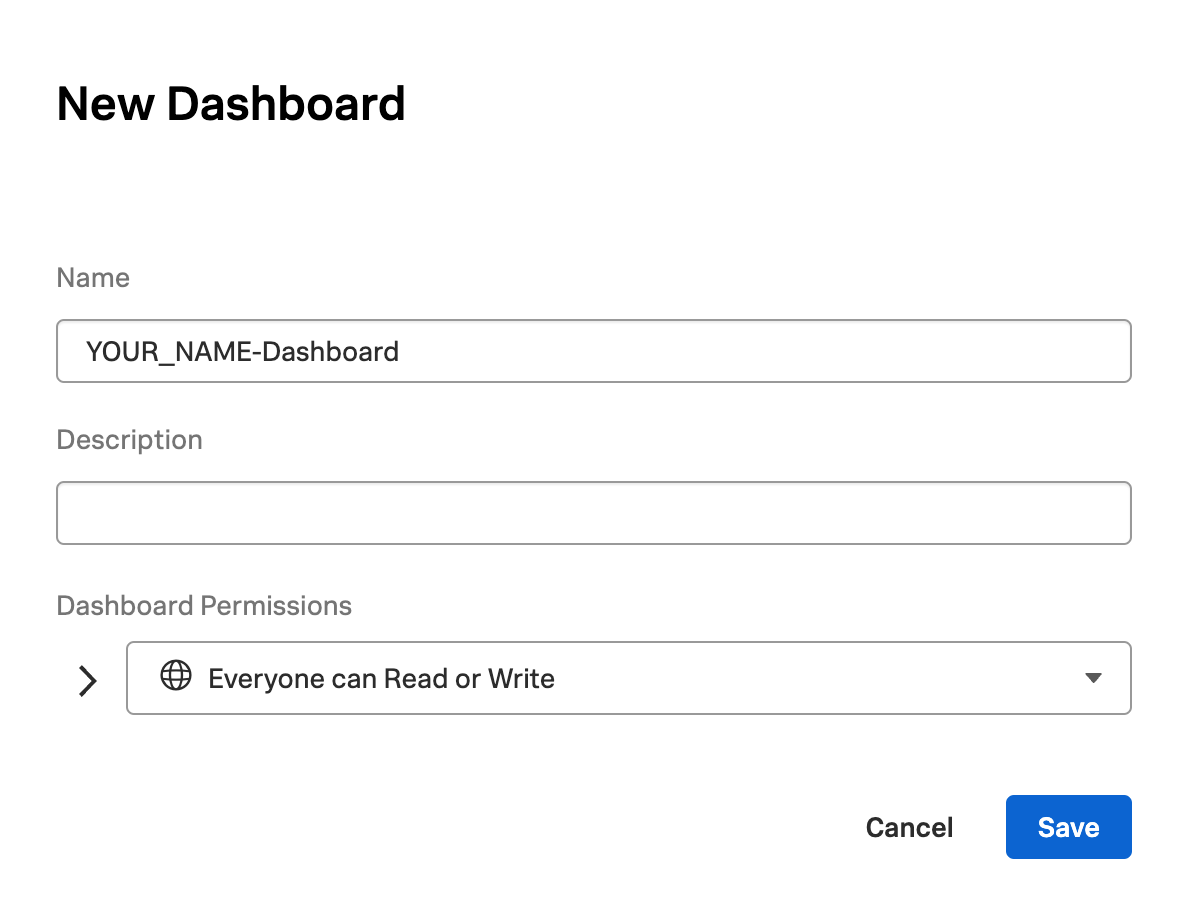
Now, click the Save button to continue. Your new dashboard will be created and automatically selected, allowing you to save your chart directly into it
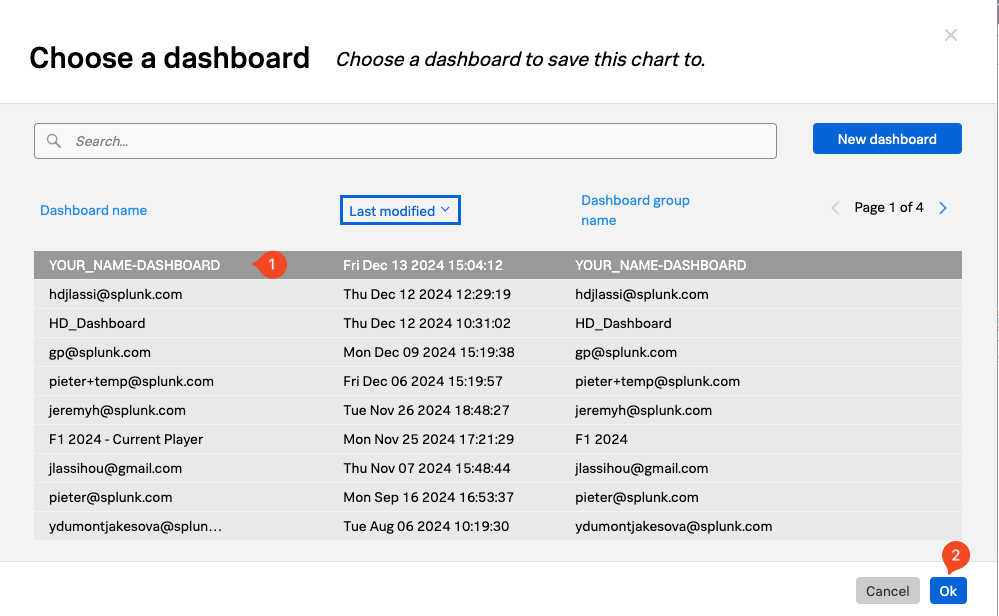
Make sure your newly created dashboard is selected (1), then click the Ok button (2) to proceed.
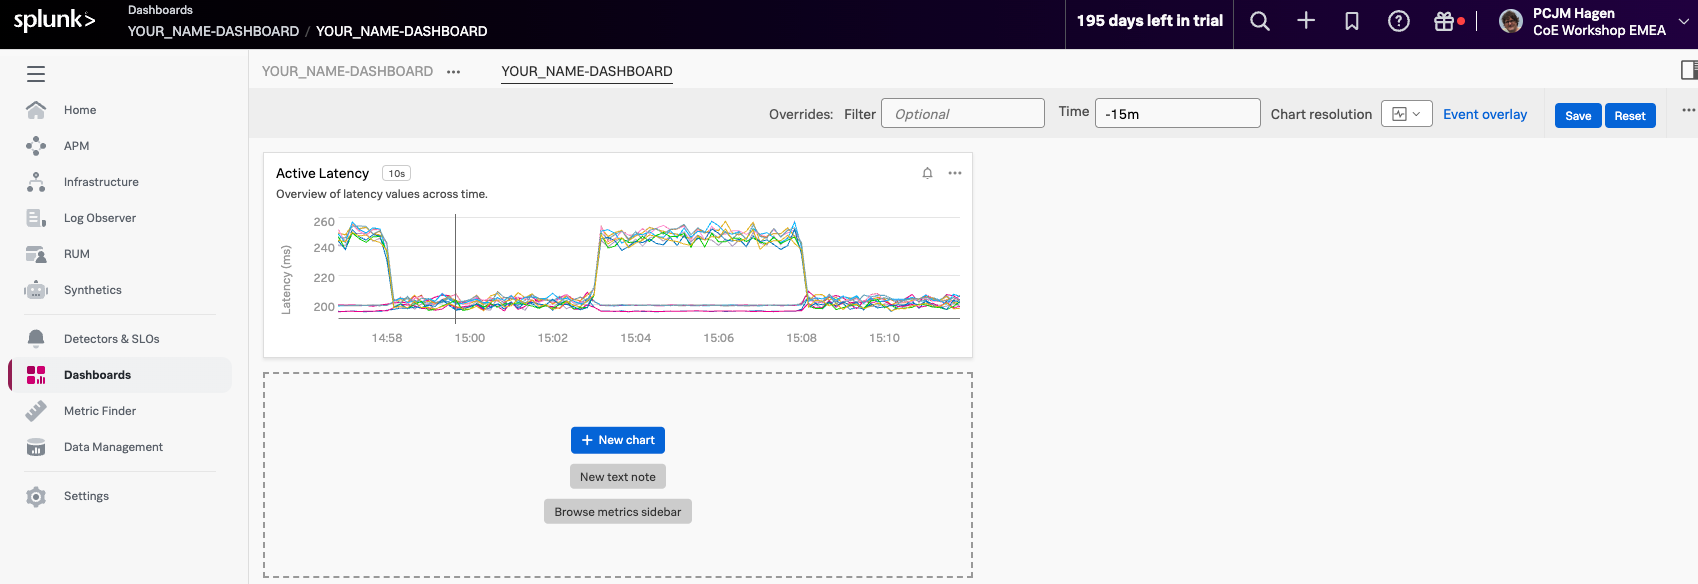
You’ll now be taken to your dashboard. In the top-left corner, you’ll see that YOUR_NAME-DASHBOARD is part of a Dashboard Group is part of a dashboard group with the same name. You can add additional dashboards to this dashboard group to organize charts around different use cases, systems, or projects.