Verify Kubernetes Cluster metrics
10 minutesOnce the installation has completed, you can log in to Splunk Observability Cloud and verify that the metrics are flowing in from your Kubernetes cluster.
From the left-hand menu, click on Infrastructure and select Kubernetes, then select the Kubernetes nodes tile.
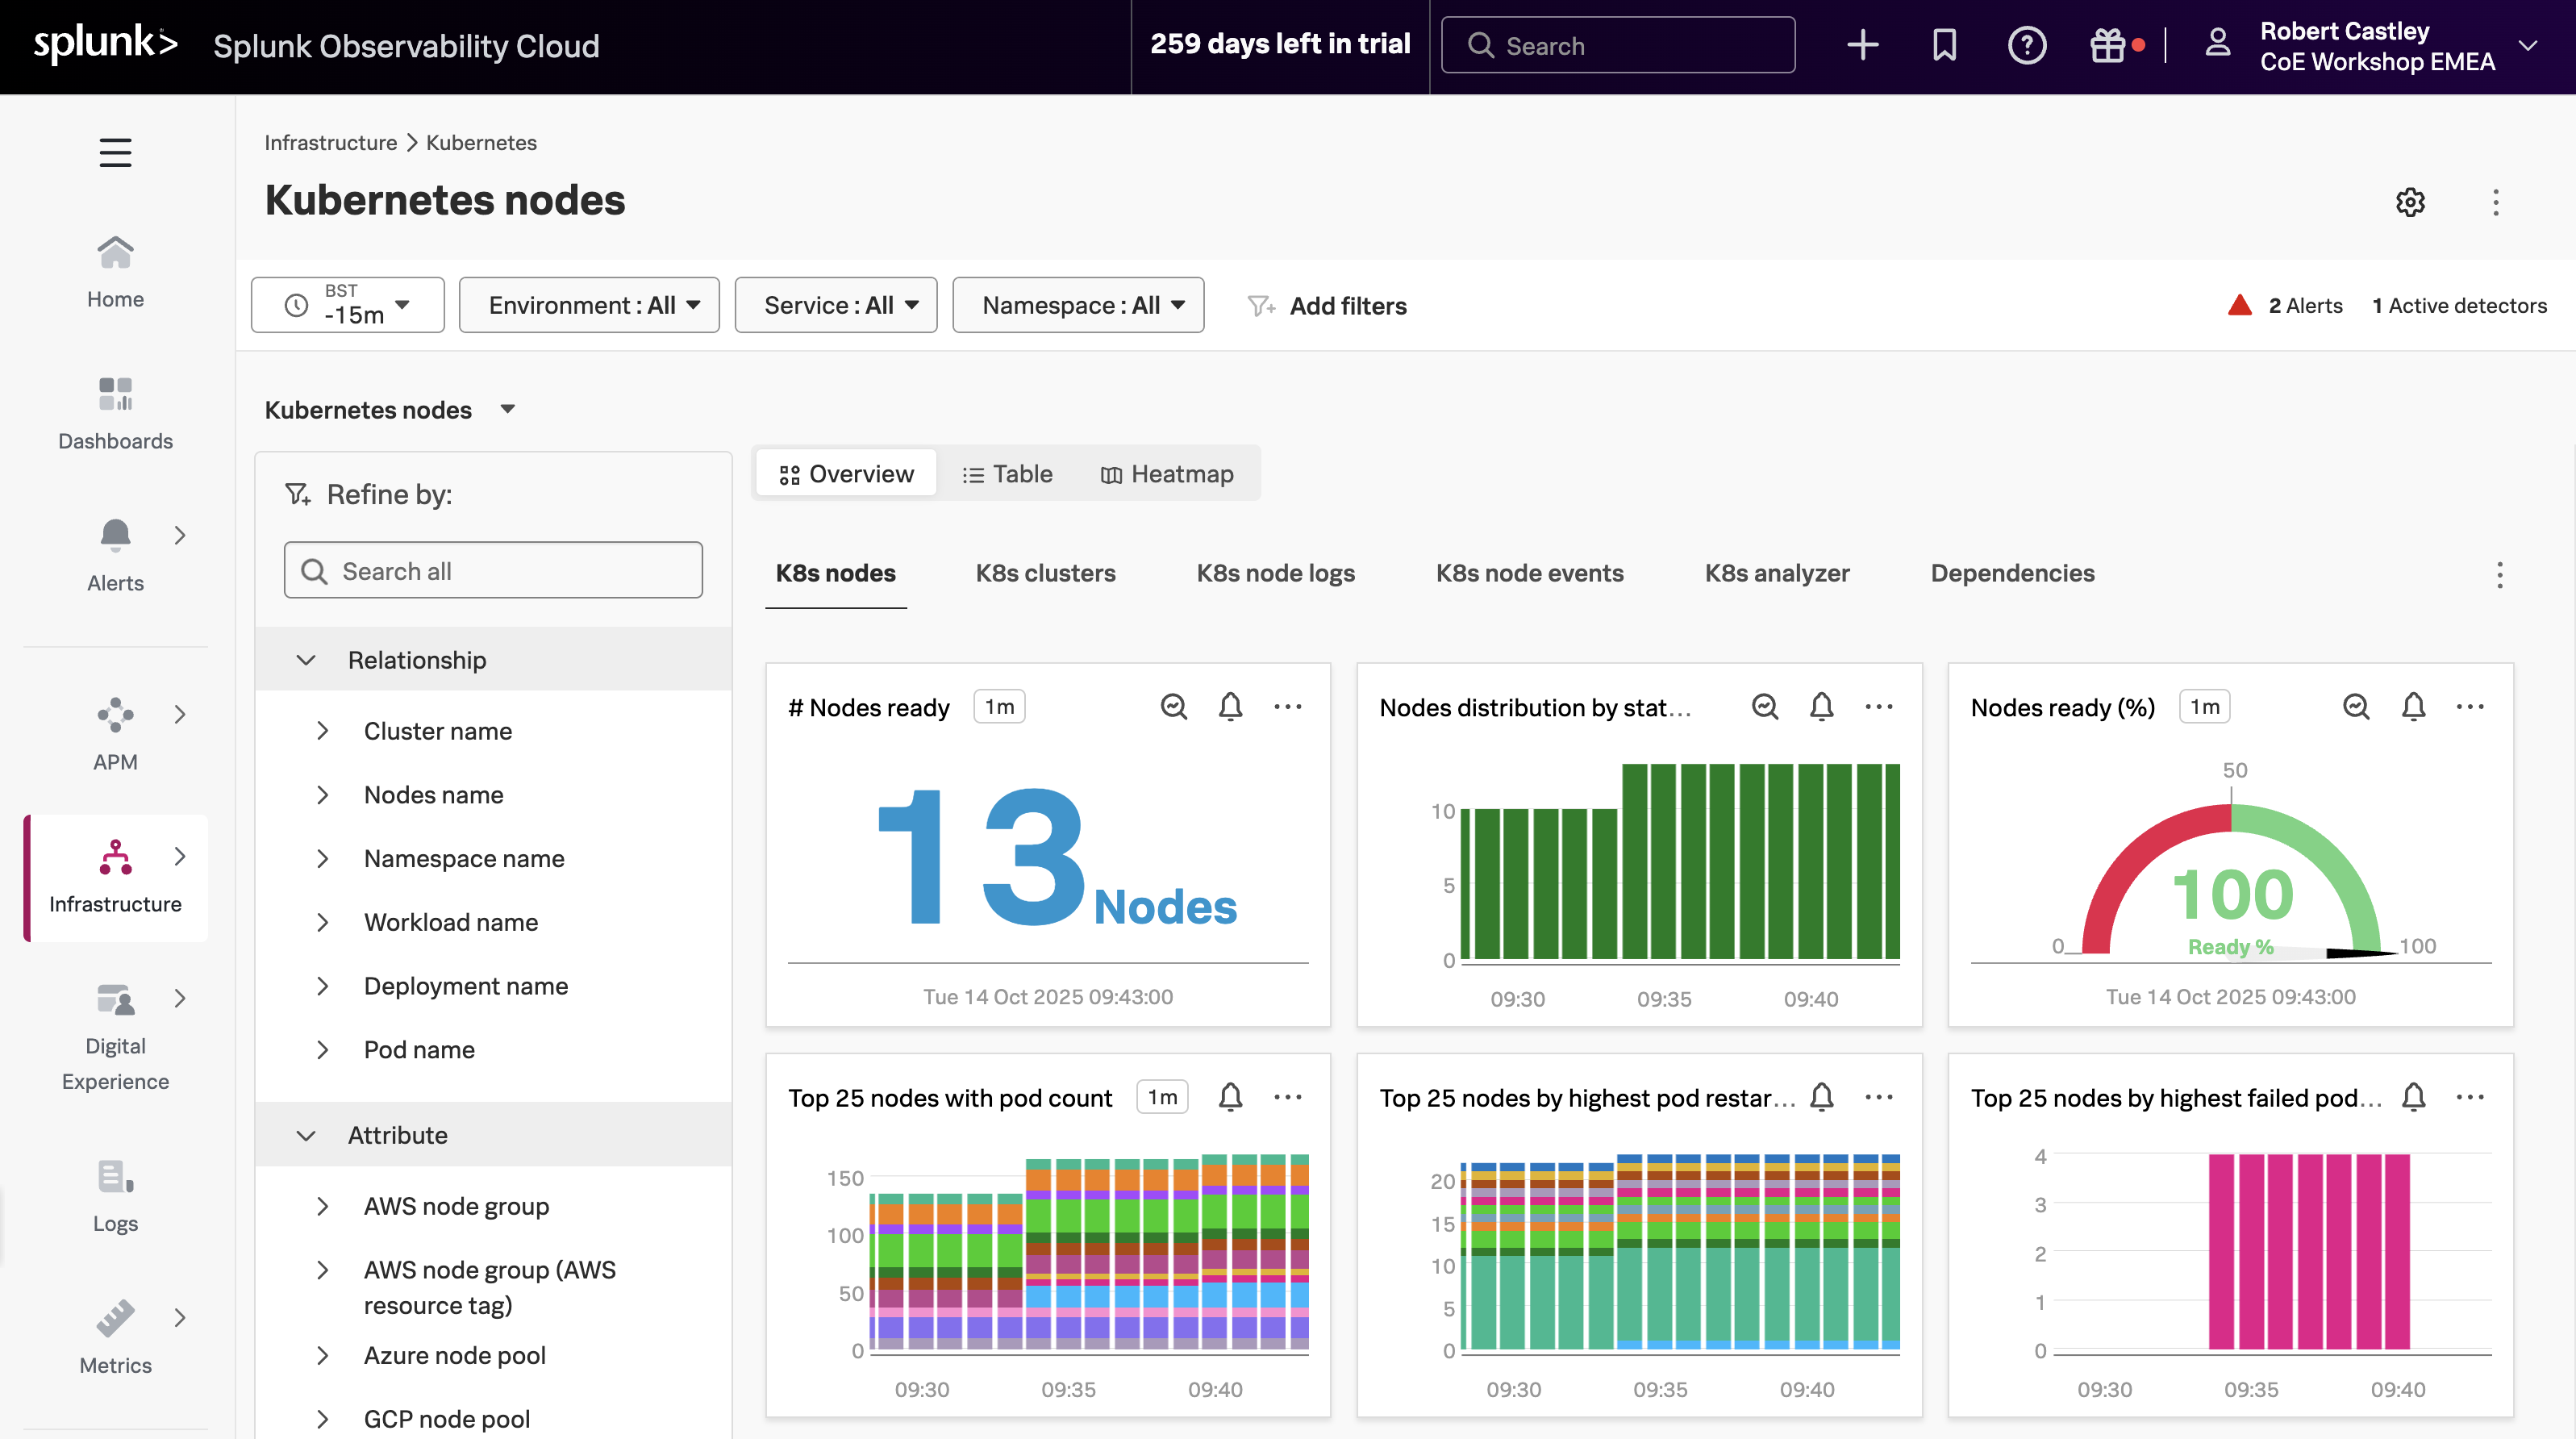
Once you are in the Kubernetes nodes overview, change the Time filter from -1h to the last 15 minutes (-15m) to focus on the latest data, then select Table to list all the nodes that are reporting metrics.
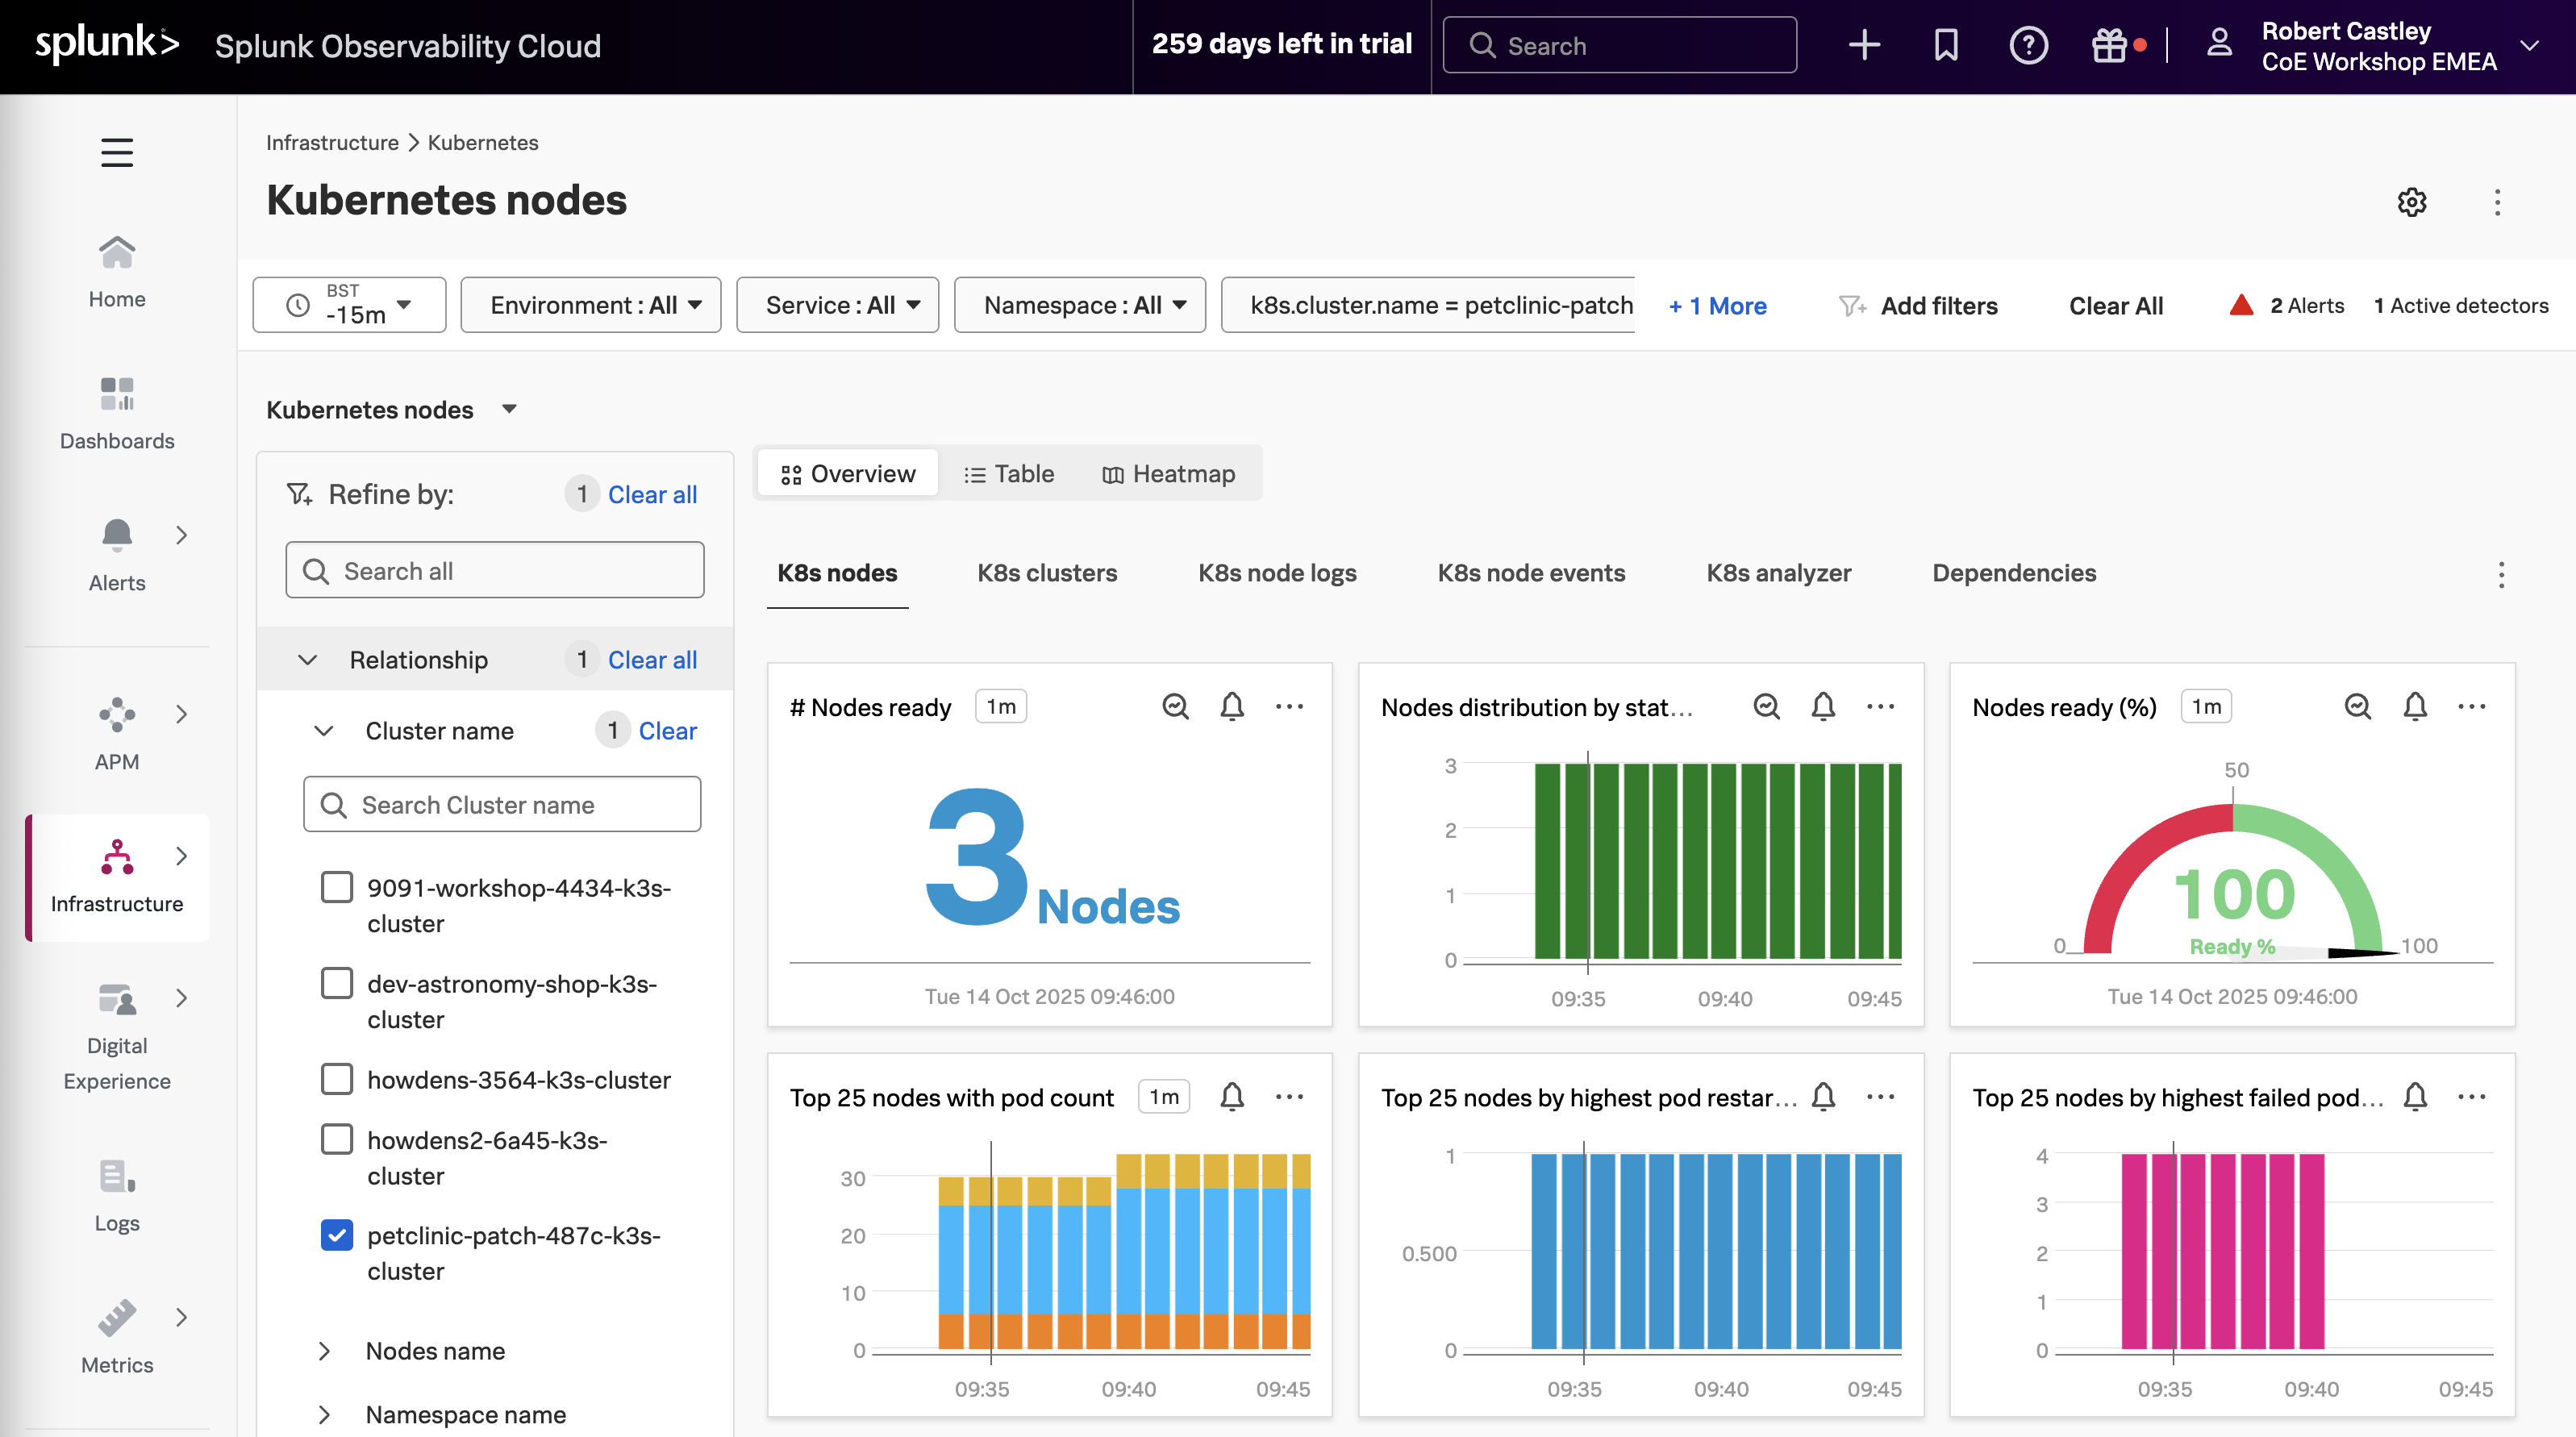
Next, in the Refine by: panel, select Cluster name and choose your cluster from the list.
Tip
To identify your specific cluster, use the INSTANCE value from the shell script output you ran during setup. This unique identifier helps you locate your workshop cluster among other nodes in the list.
This will filter the list to show only the nodes from your cluster.
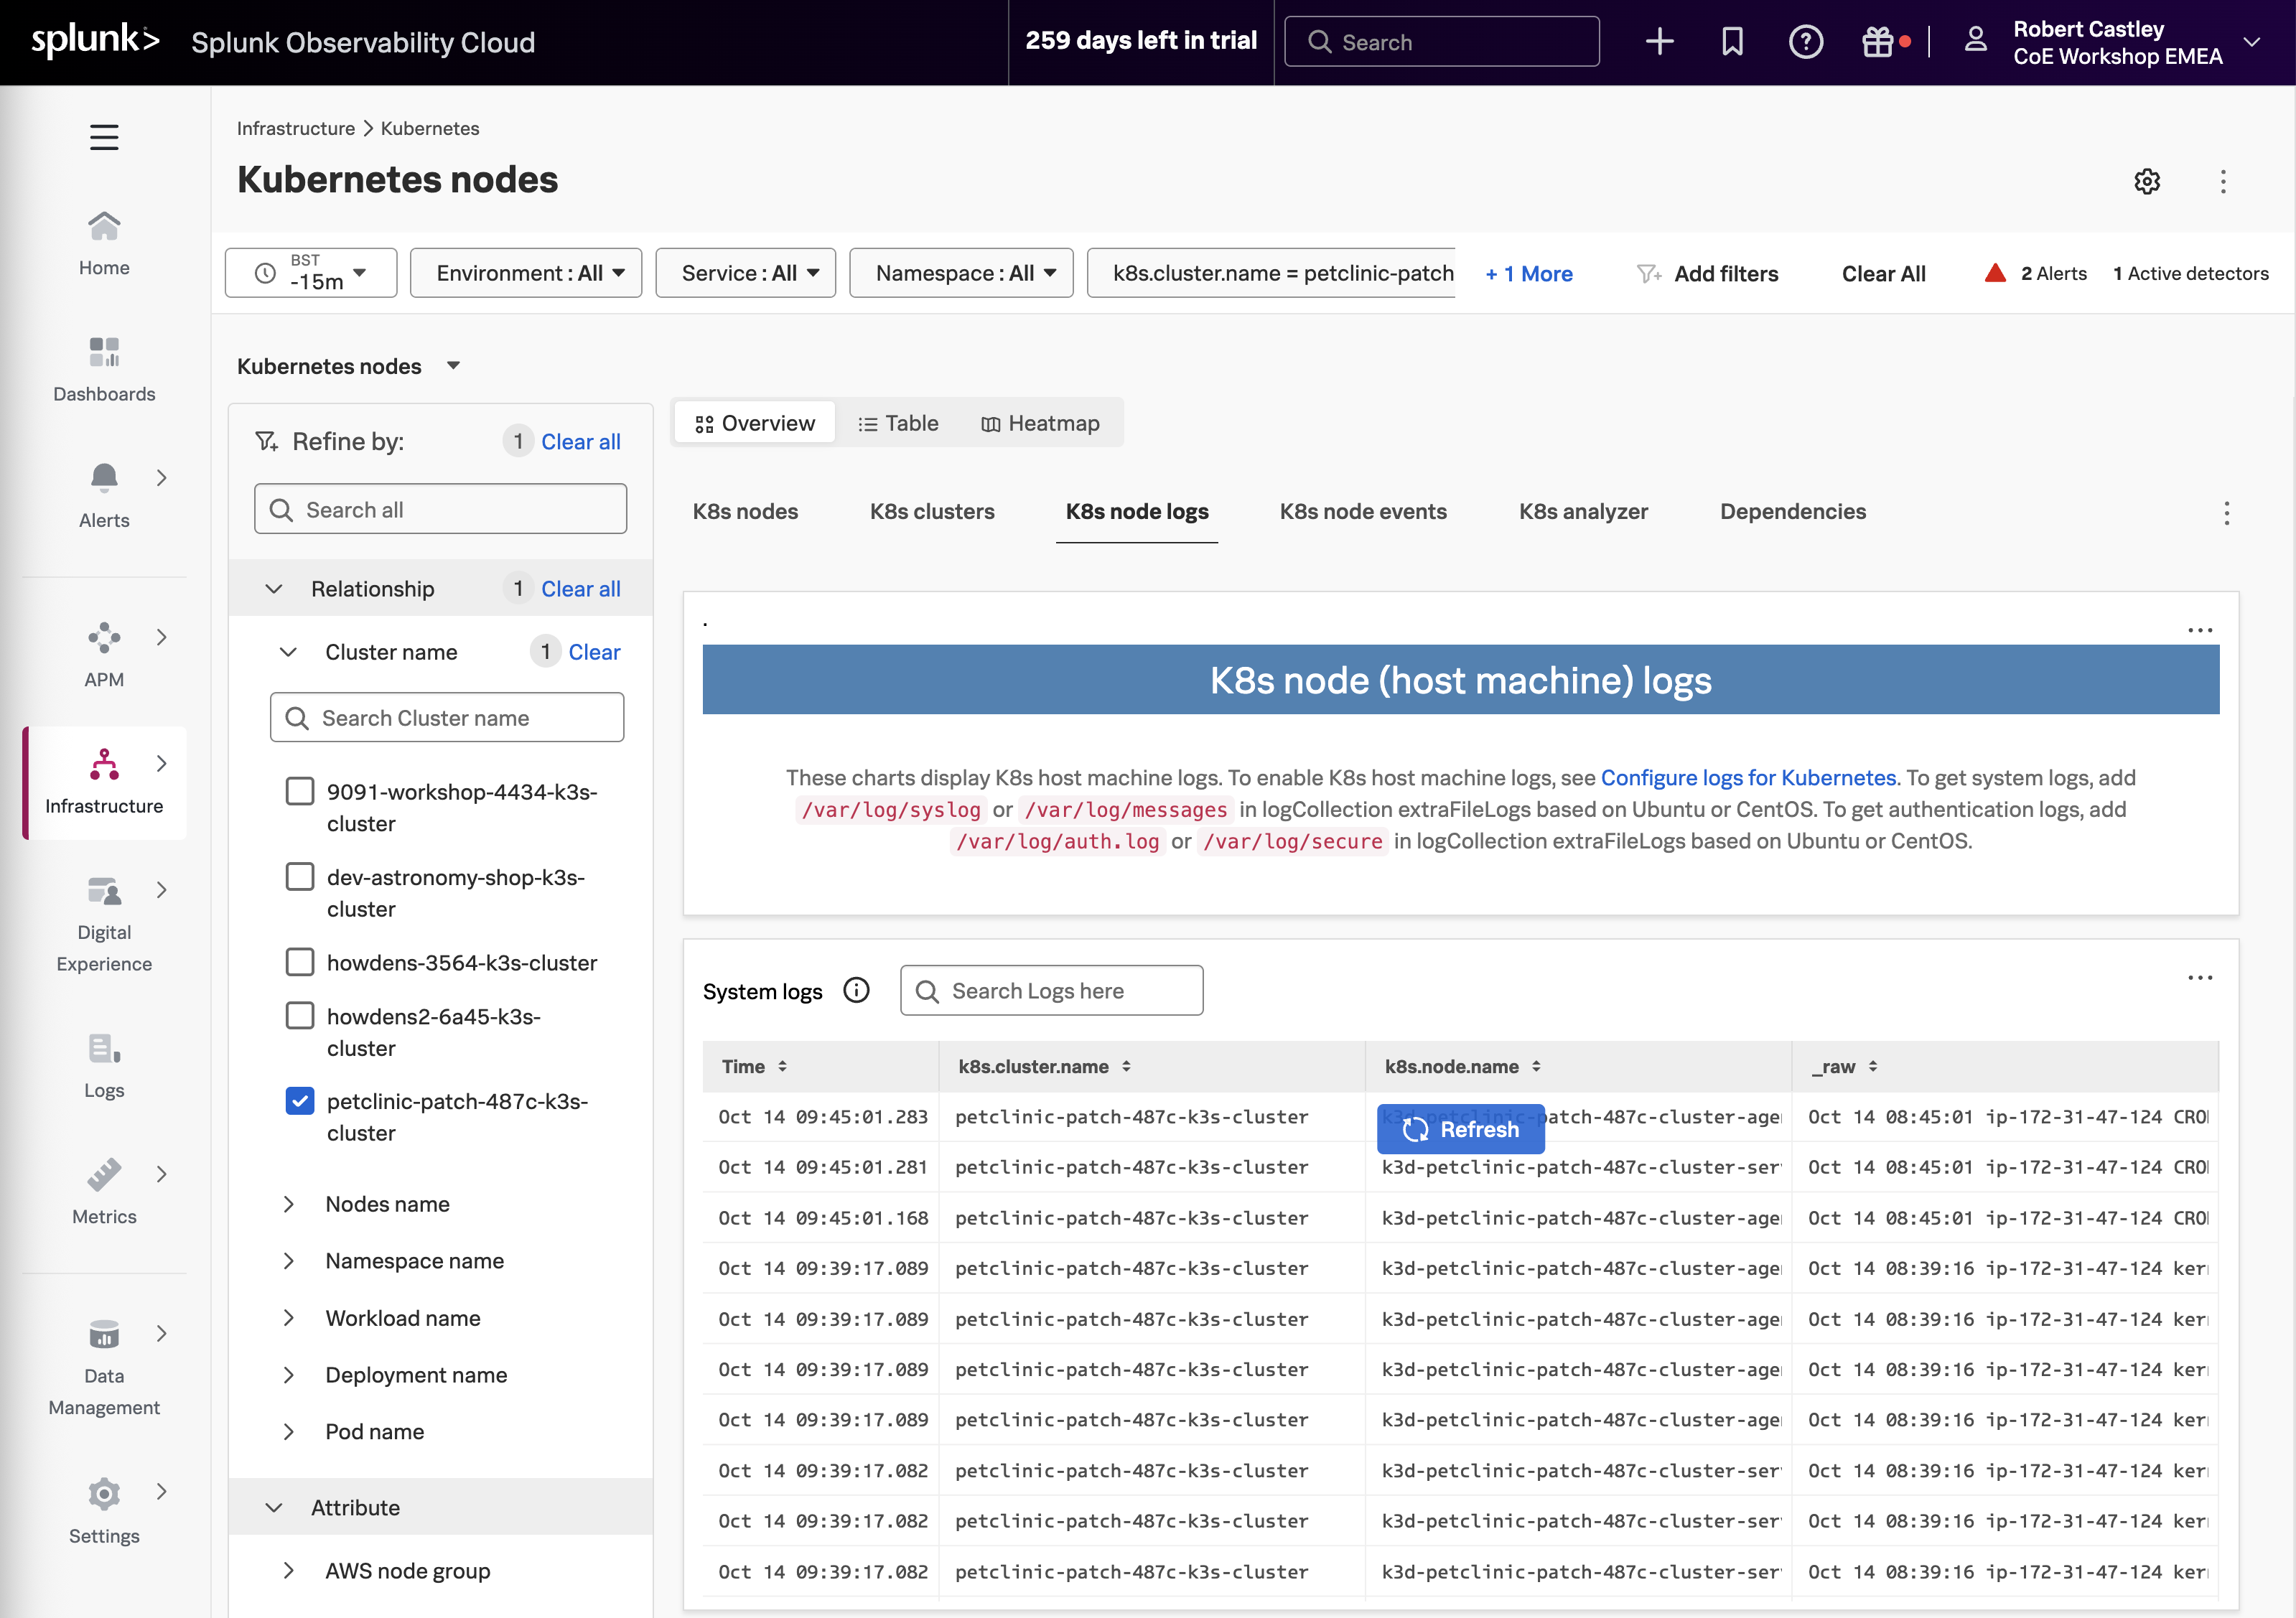
Switch to the K8s node logs view to see the logs from your nodes.