Splunk4Ninjas Workshops
Learn how to leverage Splunk's automatic discovery and configuration capabilities for Java applications. These workshops demonstrate zero-code instrumentation to instantly generate metrics, traces, and logs for comprehensive observability across monolith and Kubernetes deployments.
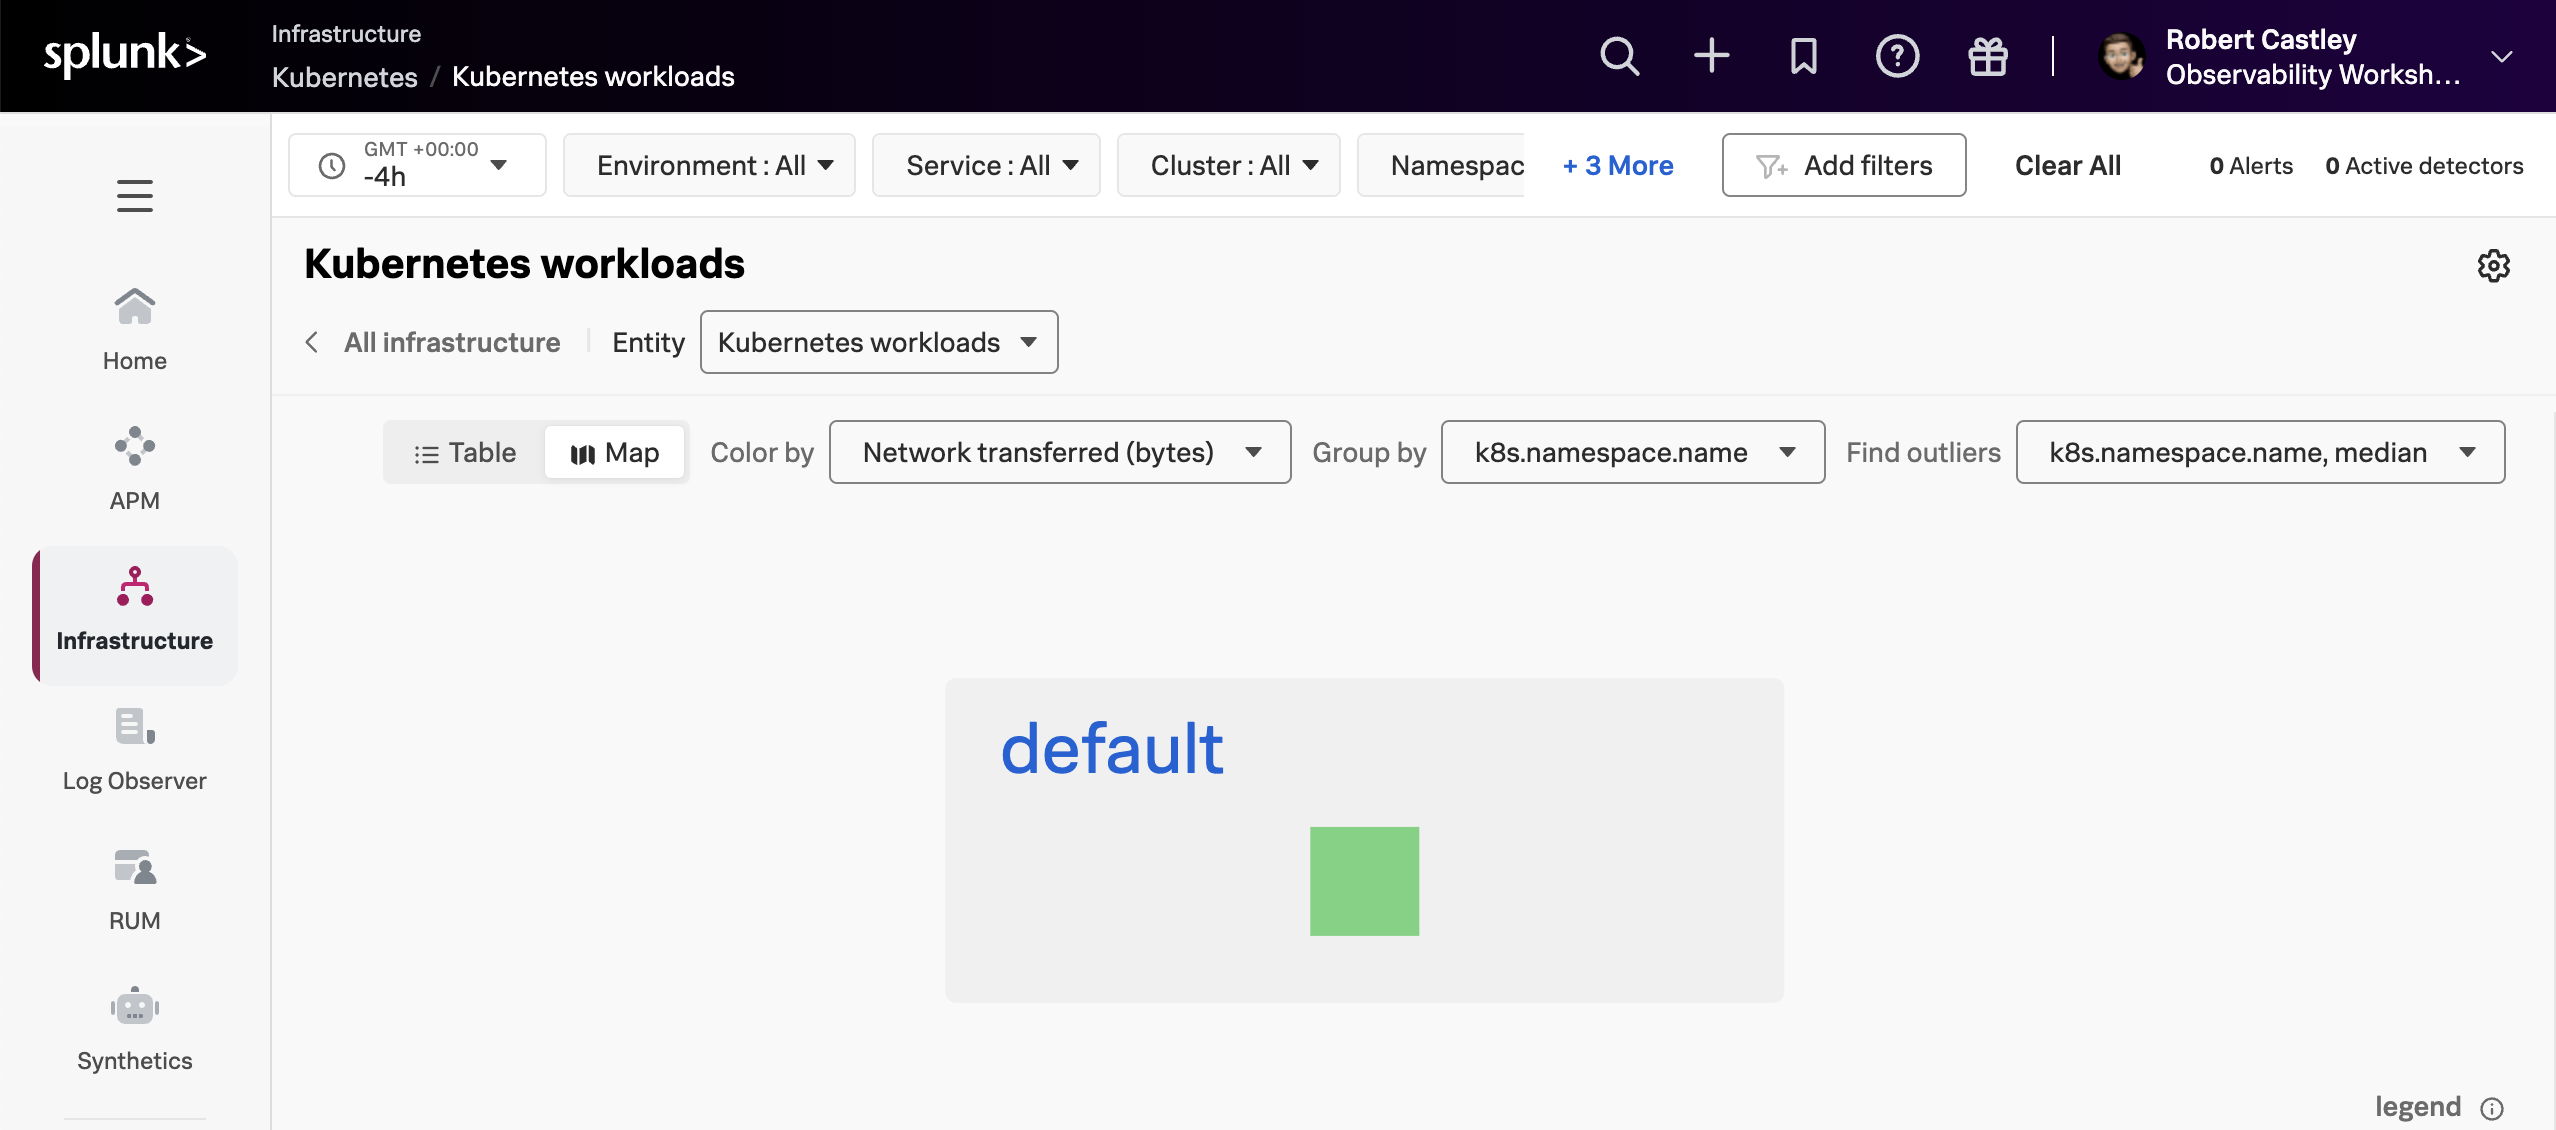
Learn to monitor Kubernetes Horizontal Pod Autoscaling (HPA) with the Splunk OpenTelemetry Collector, exploring metrics, events, and auto-scaling behavior in real-time
OpenTelemetry Collector Concepts Learn the concepts of the OpenTelemetry Collector and how to use it to send data to Splunk Observability Cloud. Advanced OpenTelemetry Collector Practice setting up the OpenTelemetry Collector configuration from scratch and go though several advanced configuration scenarios's.
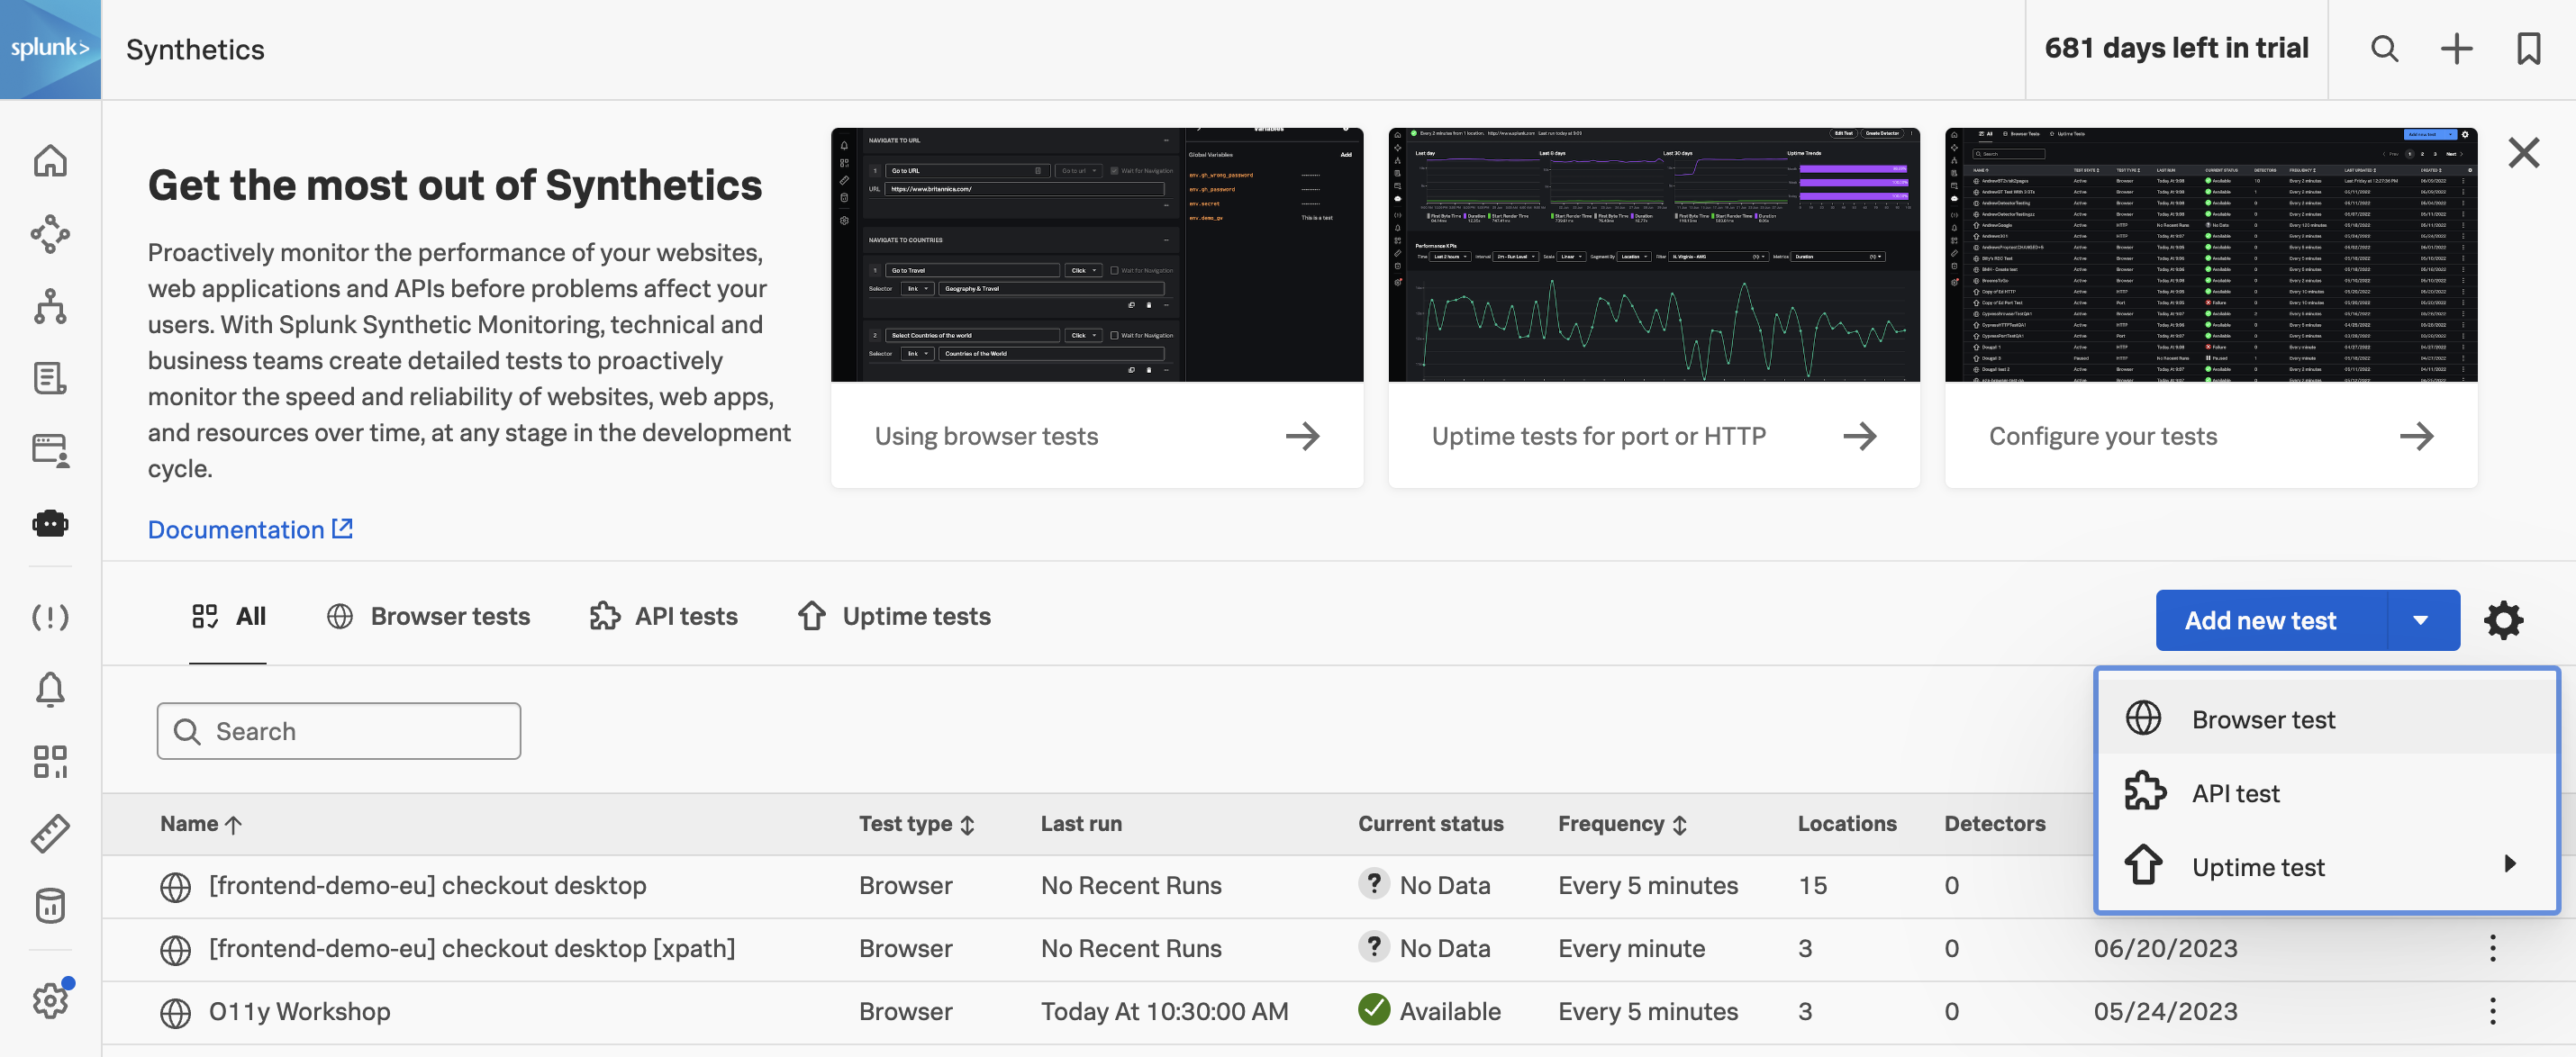
Proactively find and fix performance issues across user flows, business transactions and APIs to deliver better digital experiences.
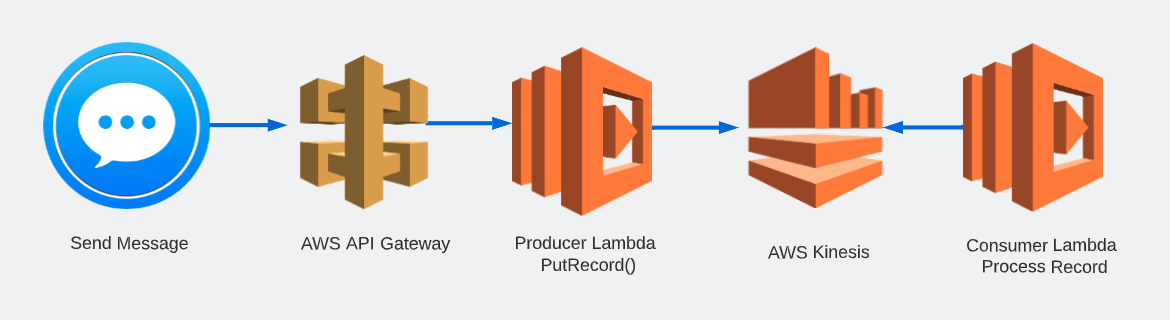
This workshop will enable you to build a distributed trace for a small serverless application that runs on AWS Lambda, producing and consuming a message via AWS Kinesis
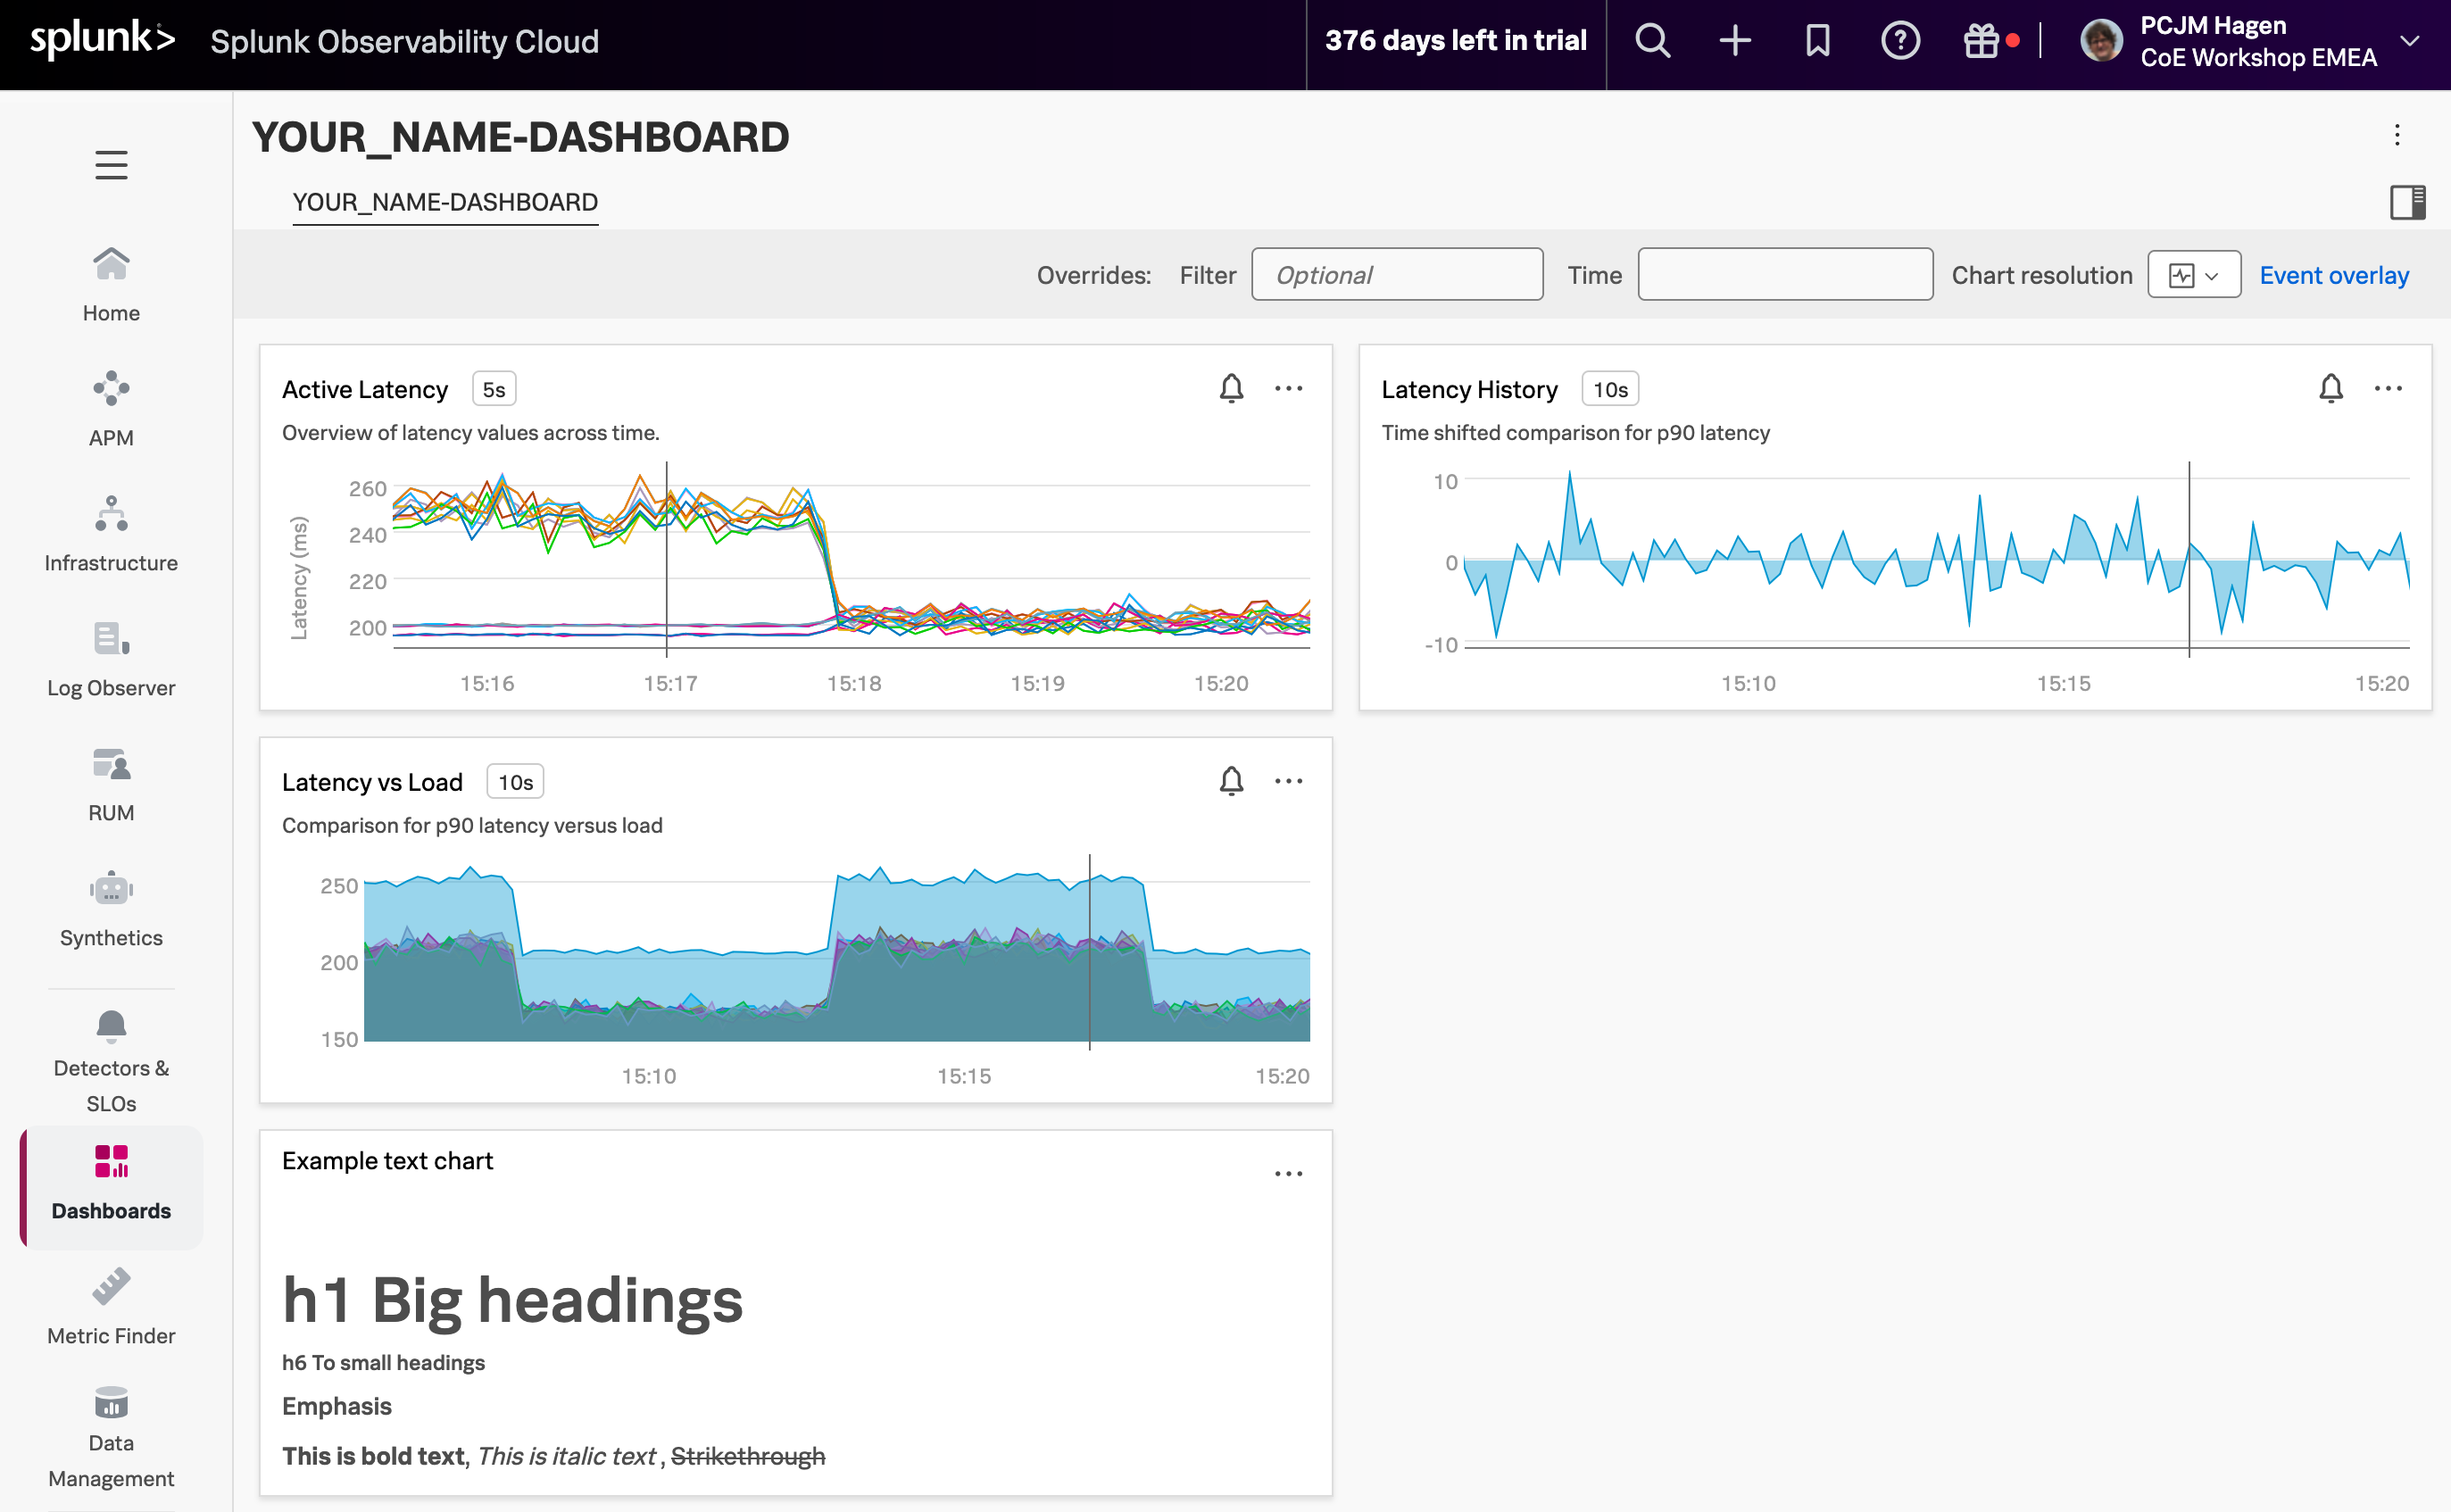
Learn to build insightful visualizations and custom dashboards using Splunk Observability Cloud's charting capabilities, filters, analytical functions, and SignalFlow
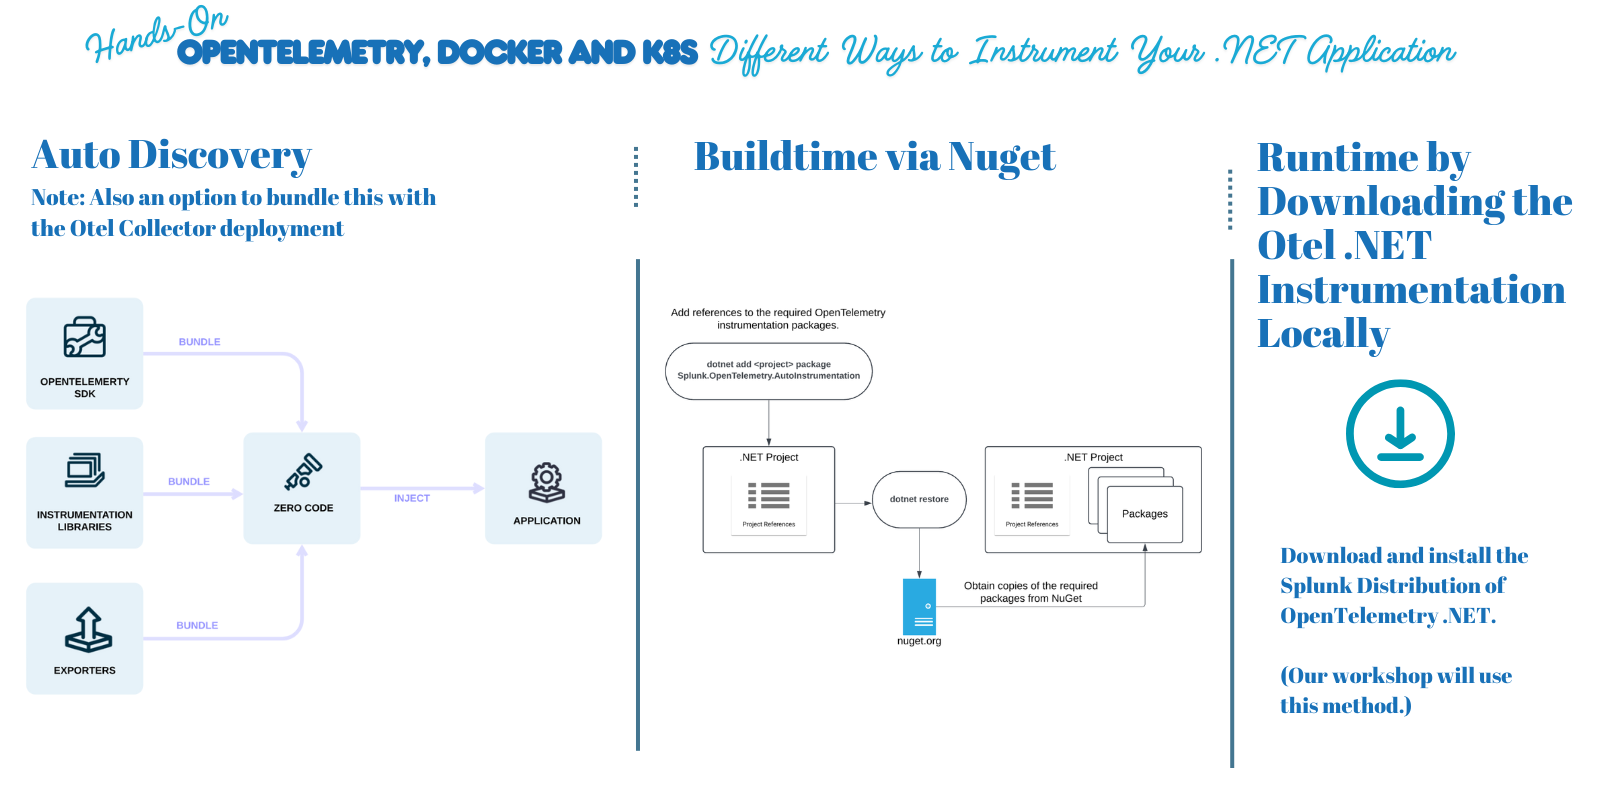
This hands-on workshop guides you through instrumenting a .NET application with OpenTelemetry, containerizing it with Docker, and deploying it to Kubernetes. You'll learn to deploy and configure the OpenTelemetry collector using Helm and troubleshoot common configuration issues.
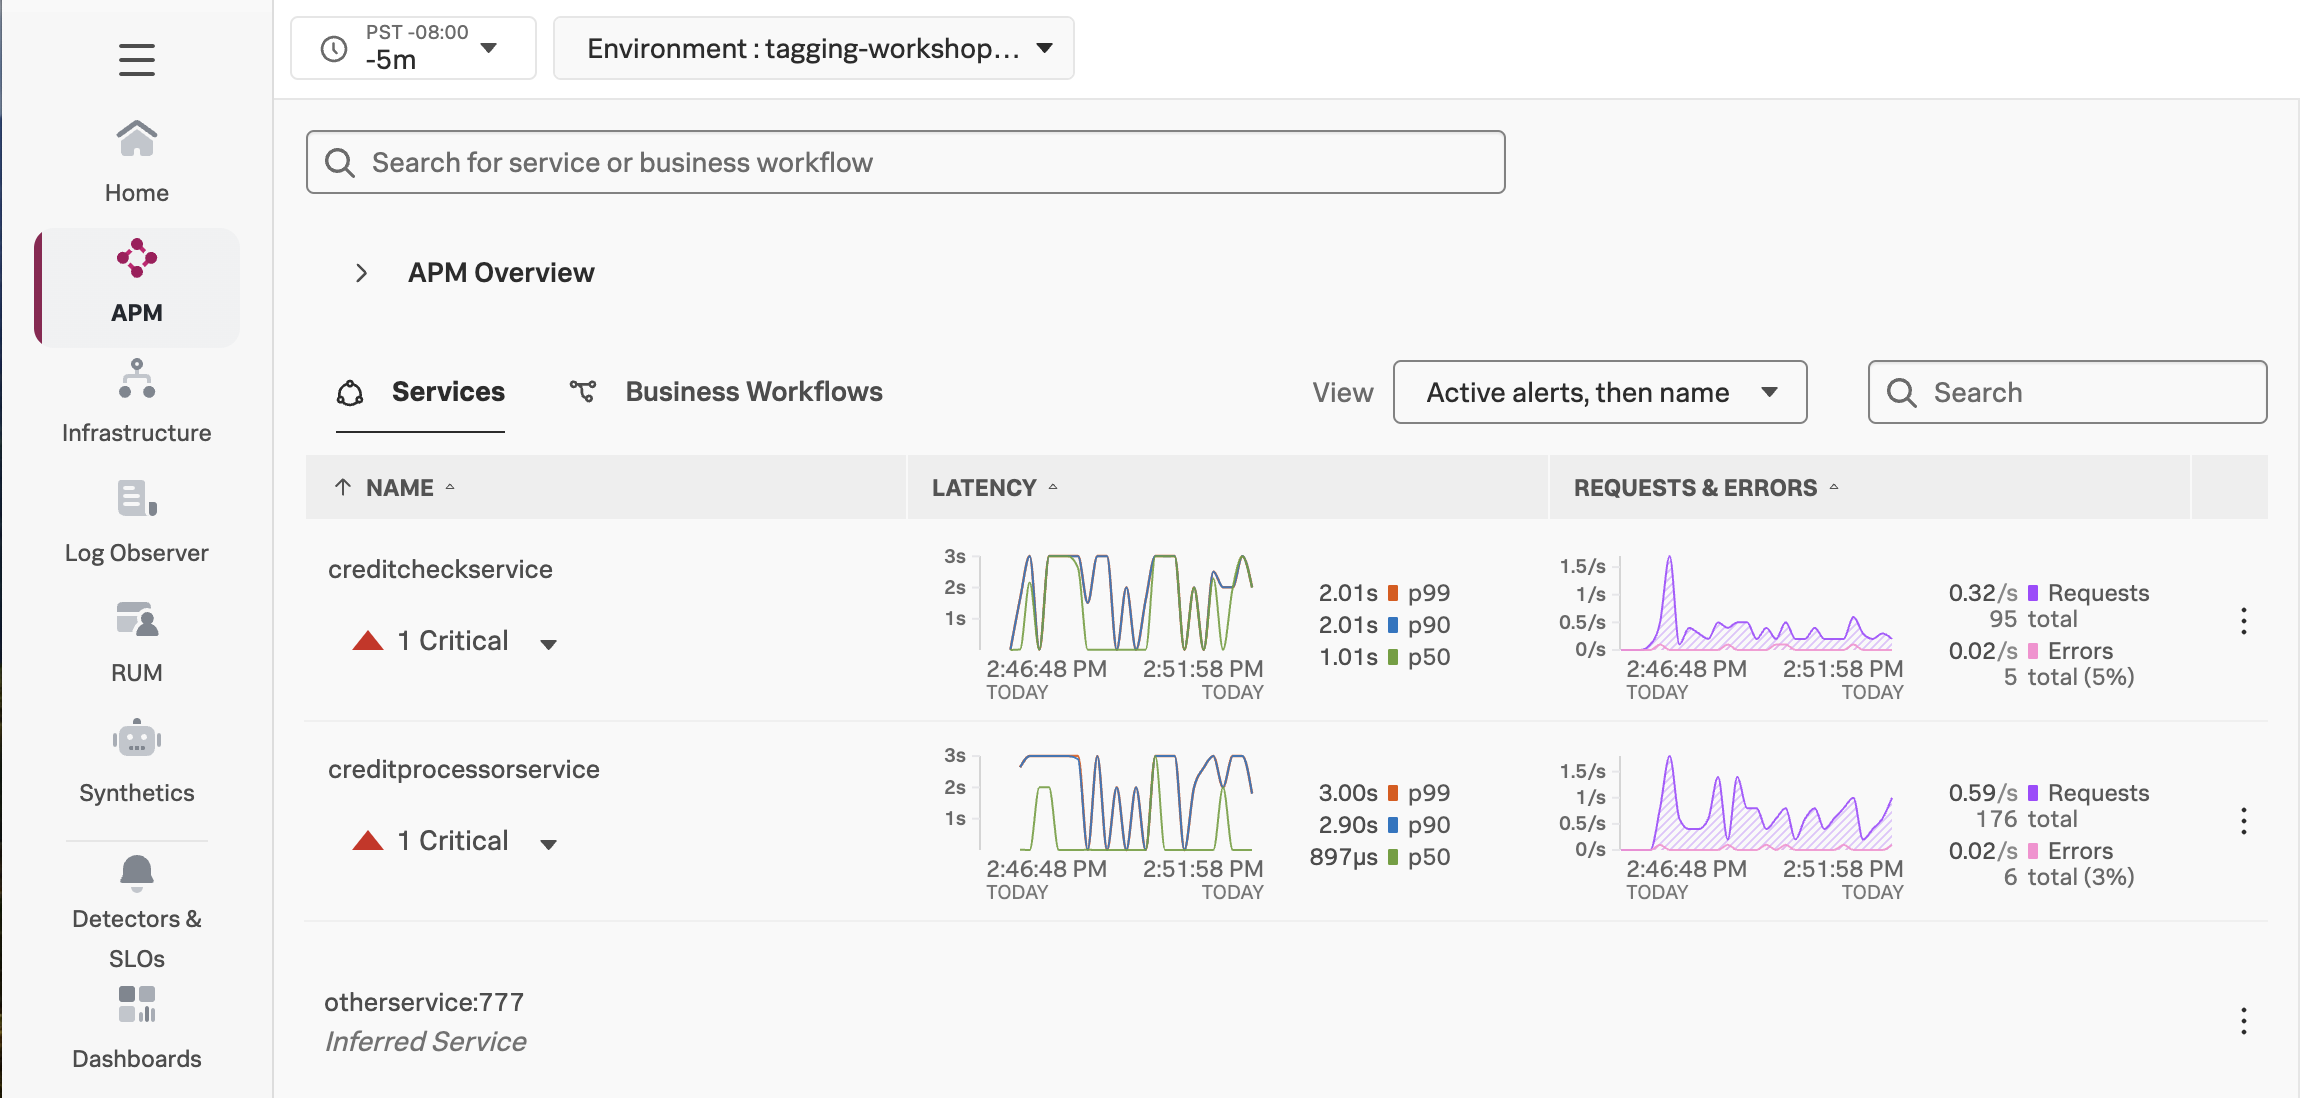
Learn how to deploy and configure the OpenTelemetry Collector, instrument applications with OpenTelemetry, and leverage Troubleshooting MetricSets and Tag Spotlight to identify and resolve performance issues in Splunk Observability Cloud.
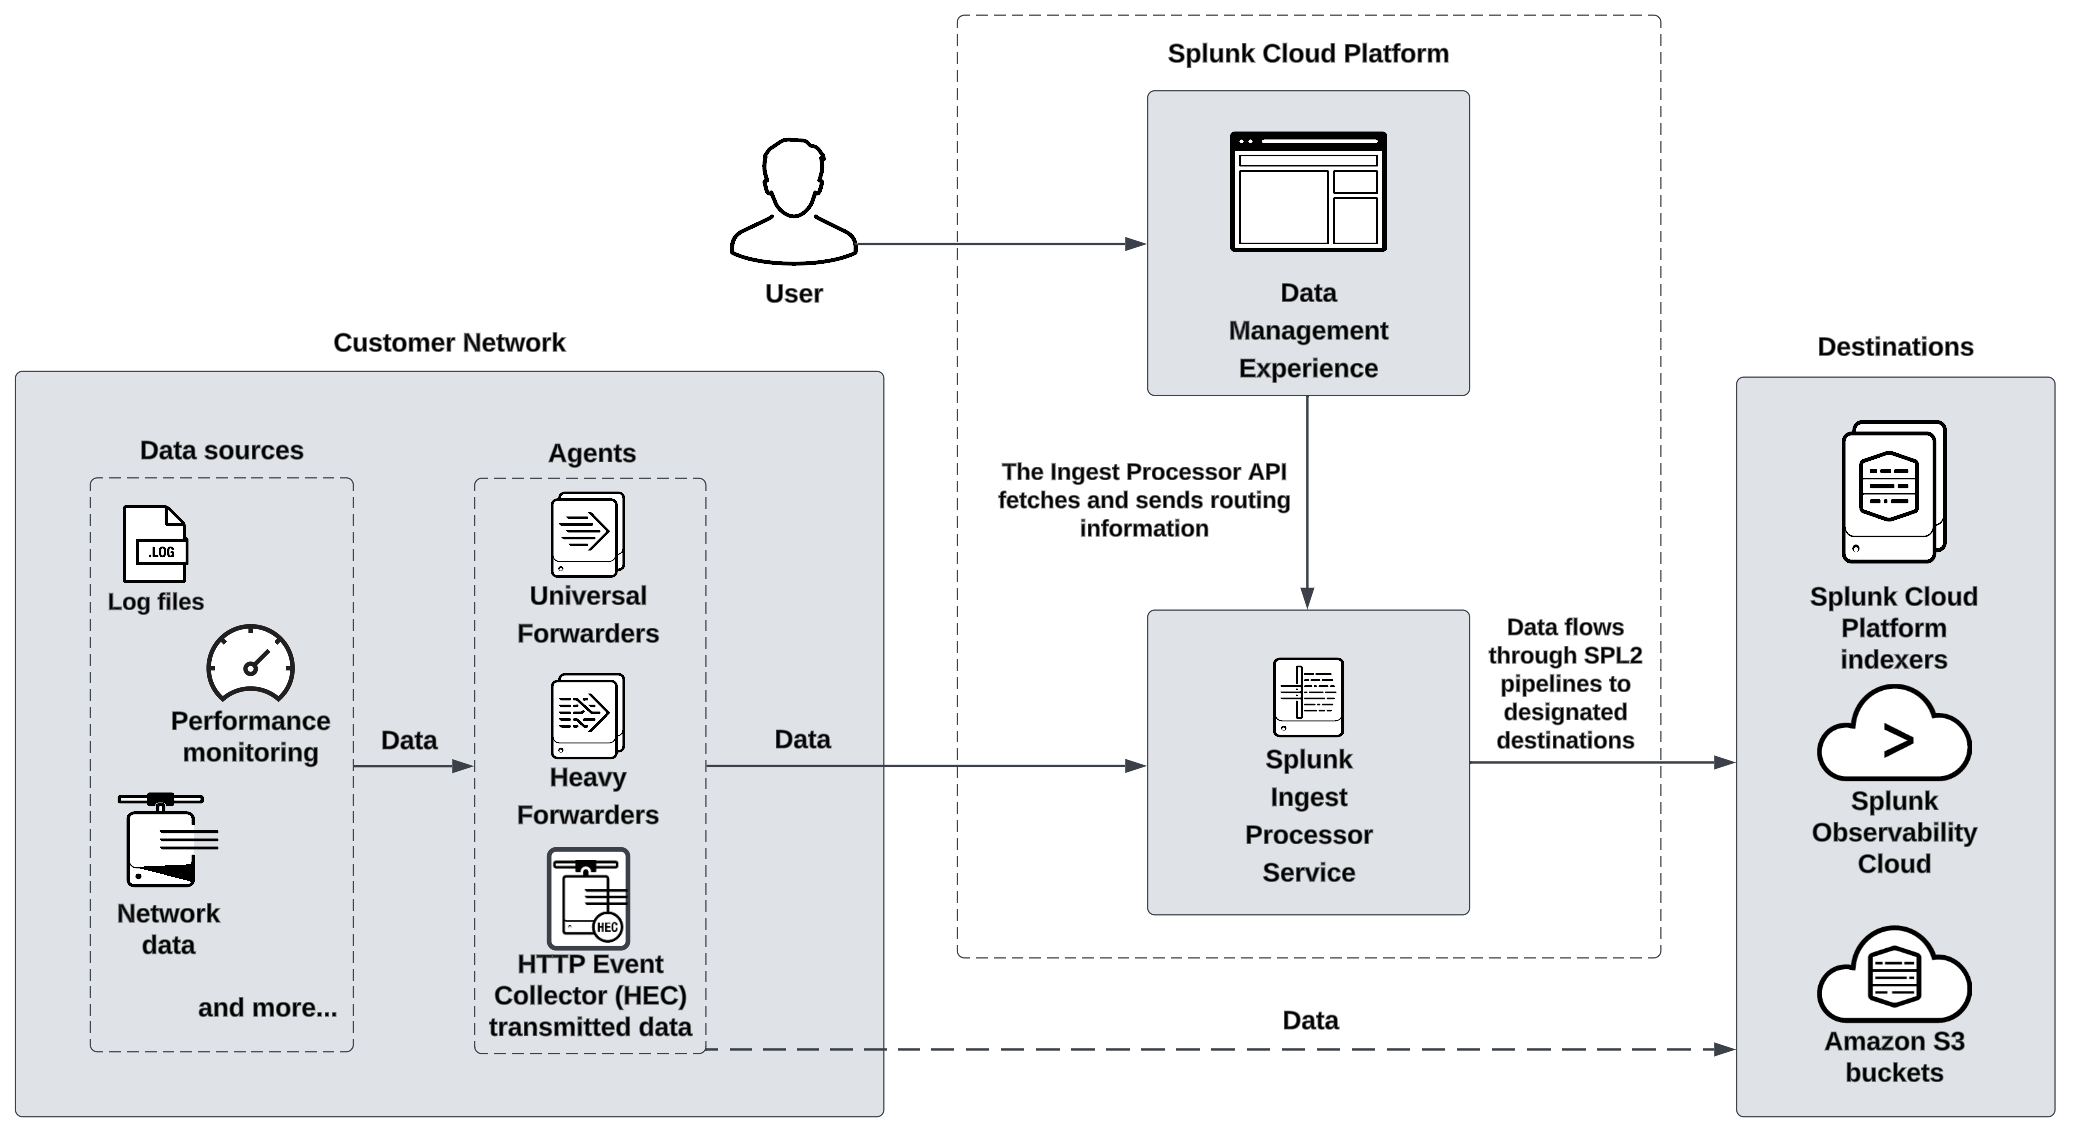
Learn how to optimize observability costs and improve MTTD by transforming logs into metrics using Splunk Ingest Processor with hands-on exercises in Splunk Observability Cloud.
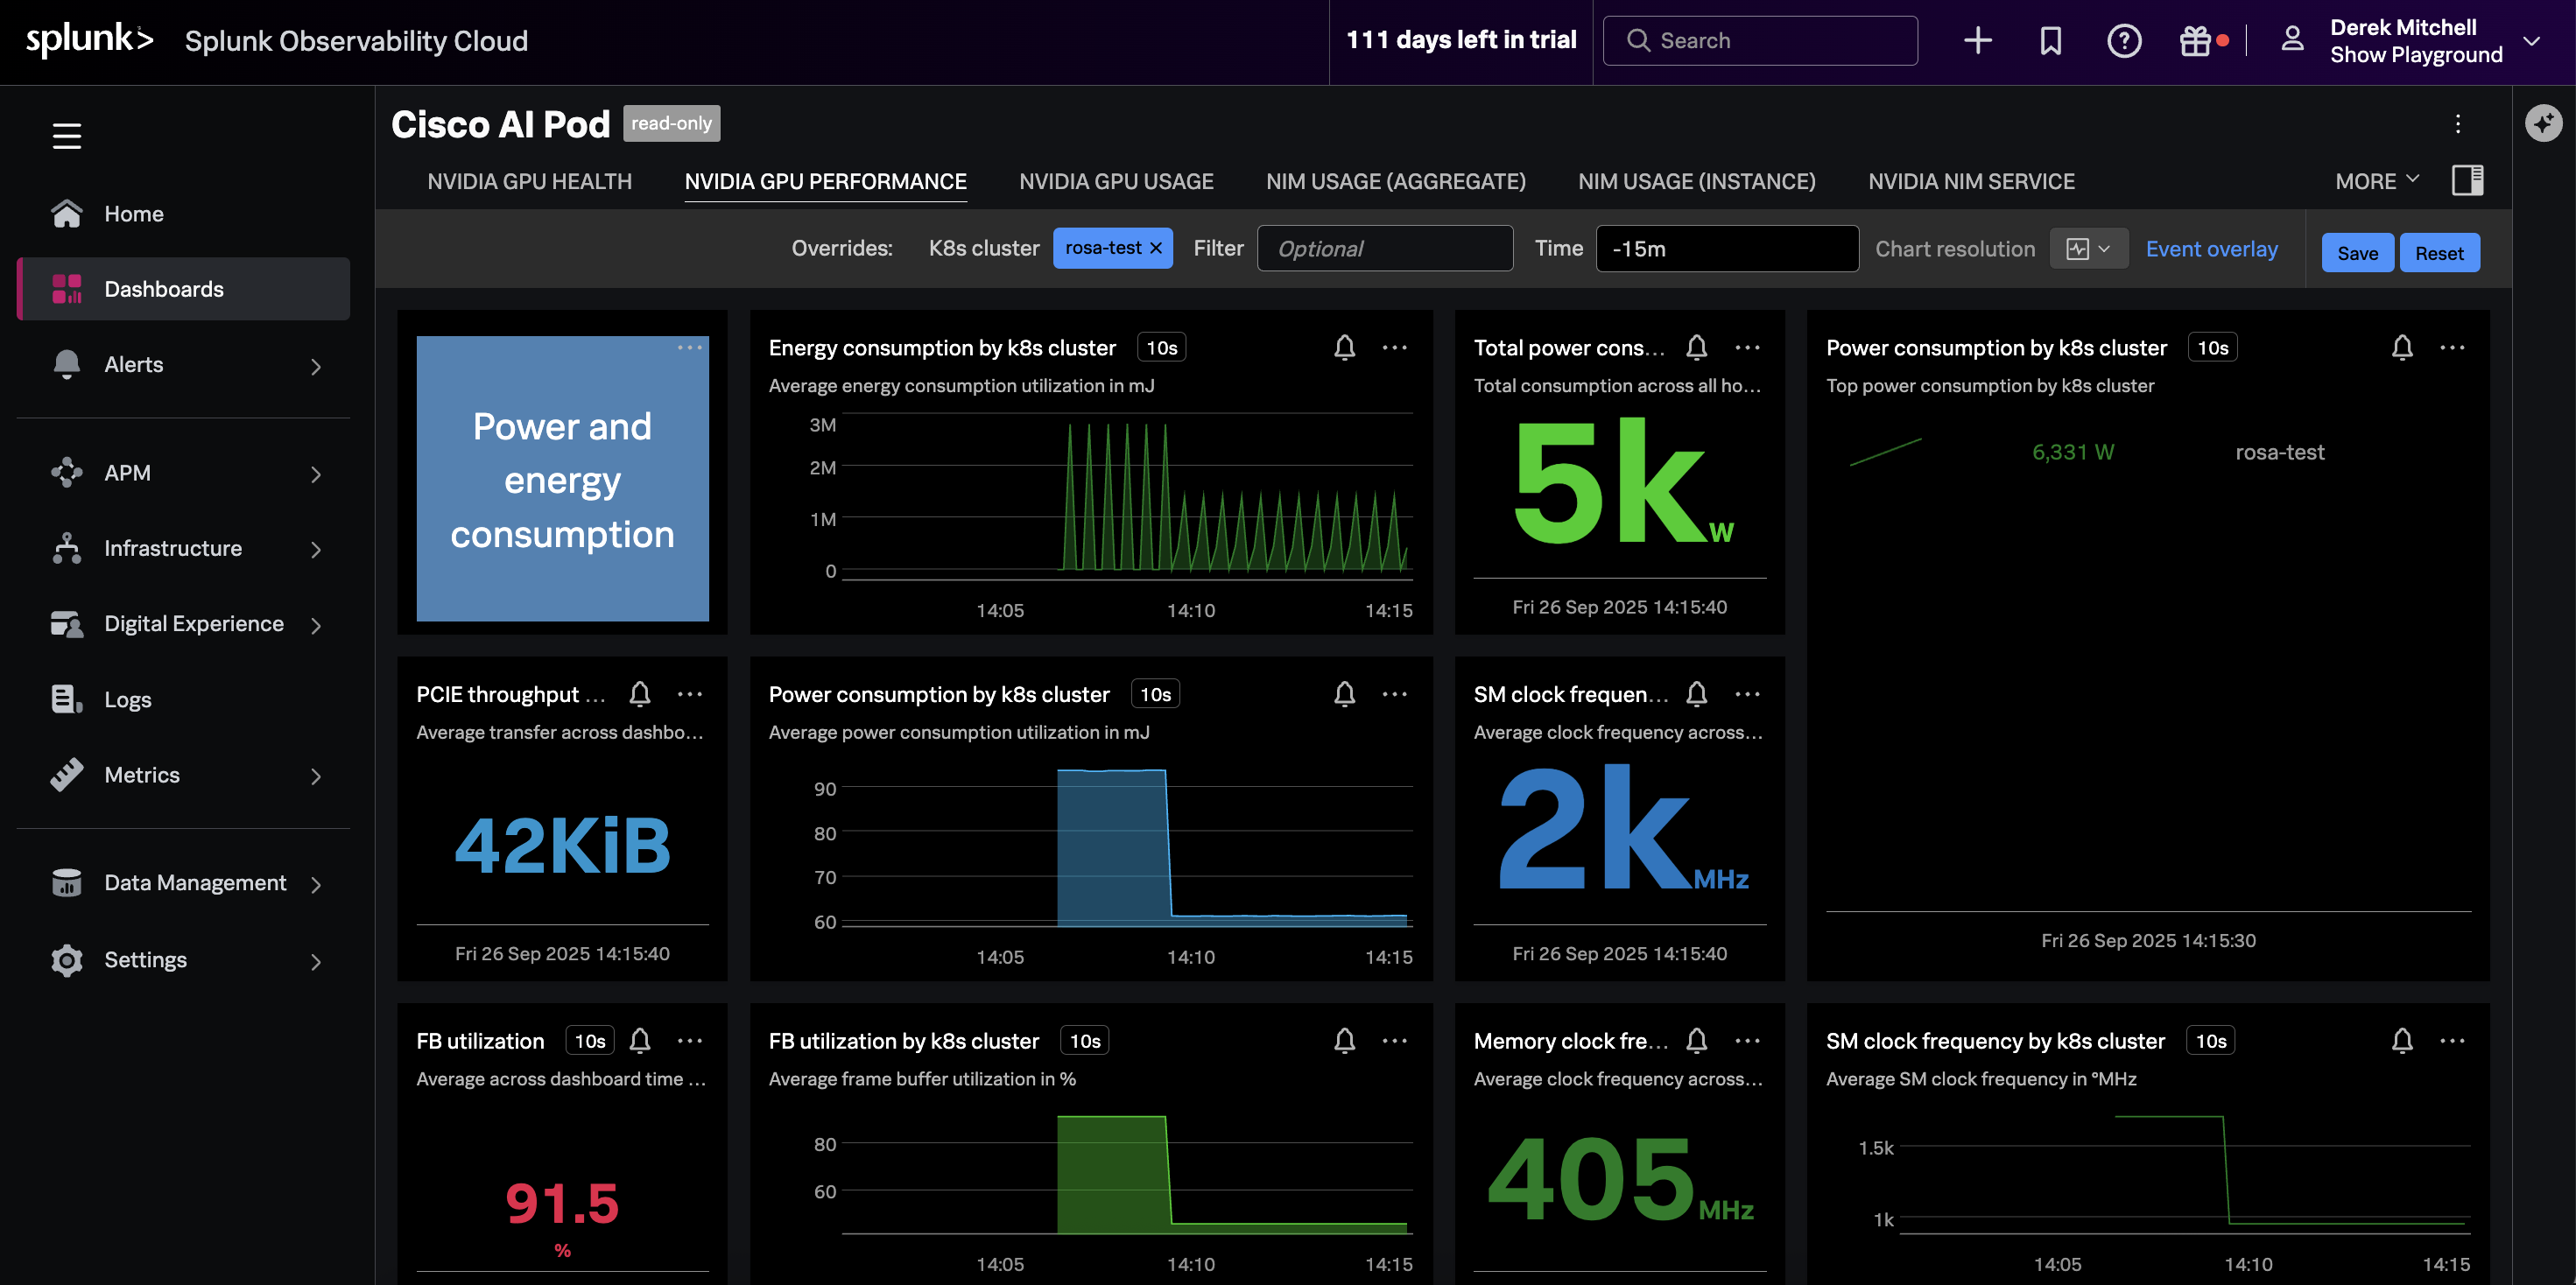
This hands-on workshop demonstrates how to monitor Cisco AI Pods with Splunk Observability Cloud. Learn to deploy the OpenTelemetry Collector in Red Hat OpenShift, ingest infrastructure metrics using Prometheus receivers, and configure APM to monitor Python services that interact with Large Language Models (LLMs).