APM Span
While we examine our spans, let’s look at several out-of-the-box features that you get without code modifications when using automatic discovery and configuration on top of tracing:
First, in the Waterfall Pane, make sure the customers-service:SELECT petclinic or similar span is selected as shown in the screenshot below:
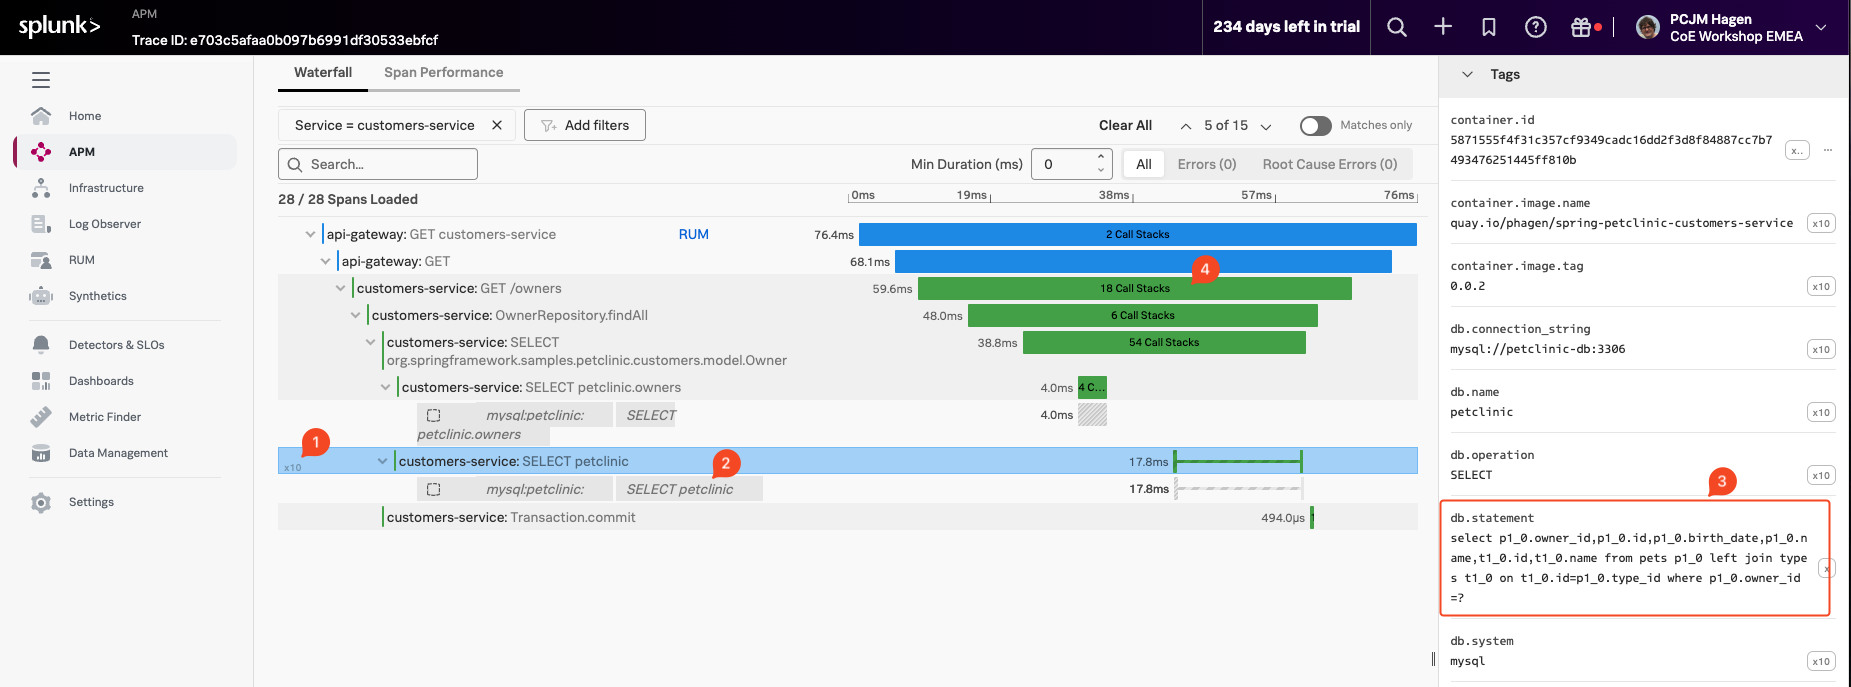
- The basic latency information is shown as a bar for the instrumented function or call. In our example above, it took 17.8 Milliseconds.
- Several similar Spans (1) are only visible if the span is repeated multiple times. In this case, there are 10 repeats in our example. You can show/hide them all by clicking on the
10xand all spans will show in order. - Inferred Services: Calls made to external systems that are not instrumented show up as a grey ‘inferred’ span. The Inferred Service or span in our example is a call to the Mysql Database
mysql:petclinic SELECT petclinic(2) as shown above. - Span Tags: In the Tag Pane, we see standard tags produced by the automatic discovery and configuration. In this case, the span is calling a Database, so it includes the
db.statementtag (3). This tag will hold the DB query statement and is used by the Database call performed during this span. This will be used by the DB-Query Performance feature. We look at DB-Query Performance in the next section. - Always-on Profiling: IF the system is configured to capture Profiling data during a Span life cycle. It will show the number of Call Stacks captured in the Spans timeline. In our example above, we see 18 Call Stacks for the
customer-service:GET /ownersSpan. (4)
We will look at Profiling in the next section.