Deploy the OpenTelemetry Collector and Customize Config
15 minutesThe first step to “getting data in” is to deploy an OpenTelemetry collector, which receives and processes telemetry data in our environment before exporting it to Splunk Observability Cloud.
We’ll be using Kubernetes for this workshop, and will deploy the collector in our K8s cluster using Helm.
What is Helm?
Helm is a package manager for Kubernetes which provides the following benefits:
- Manage Complexity
- deal with a single values.yaml file rather than dozens of manifest files
- Easy Updates
- in-place upgrades
- Rollback support
- Just use helm rollback to roll back to an older version of a release
Install the Collector using Helm
Let’s change into the correct directory and run a script to install the collector:
cd /home/splunk/workshop/tagging
./1-deploy-otel-collector.sh
"splunk-otel-collector-chart" has been added to your repositories
Hang tight while we grab the latest from your chart repositories...
...Successfully got an update from the "splunk-otel-collector-chart" chart repository
Update Complete. ⎈Happy Helming!⎈
NAME: splunk-otel-collector
LAST DEPLOYED: Mon Dec 23 18:47:38 2024
NAMESPACE: default
STATUS: deployed
REVISION: 1
NOTES:
Splunk OpenTelemetry Collector is installed and configured to send data to Splunk Observability realm us1.Note that the script may take a minute or so to run.
How did this script install the collector? It first ensured that the environment variables set in the ~./profile file are read:
Important: There is no need to run the following commands, as they were already run by the
1-deploy-otel-collector.shscript.
source ~/.profileIt then installed the splunk-otel-collector-chart Helm chart and ensured it’s up-to-date:
  helm repo add splunk-otel-collector-chart https://signalfx.github.io/splunk-otel-collector-chart
  helm repo update
And finally, it used helm install to install the collector:
  helm install splunk-otel-collector --version 0.136.0 \
  --set="splunkObservability.realm=$REALM" \
  --set="splunkObservability.accessToken=$ACCESS_TOKEN" \
  --set="clusterName=$INSTANCE-k3s-cluster" \
  --set="environment=tagging-workshop-$INSTANCE" \
  splunk-otel-collector-chart/splunk-otel-collector \
  -f otel/values.yaml
Note that the
helm installcommand references avalues.yamlfile, which is used to customize the collector configuration. We’ll explore this is more detail below.
Confirm the Collector is Running
We can confirm whether the collector is running with the following command:
kubectl get podsNAME READY STATUS RESTARTS AGE
splunk-otel-collector-agent-kfvjb 1/1 Running 0 2m33s
splunk-otel-collector-certmanager-7d89558bc9-2fqnx 1/1 Running 0 2m33s
splunk-otel-collector-certmanager-cainjector-796cc6bd76-hz4sp 1/1 Running 0 2m33s
splunk-otel-collector-certmanager-webhook-6959cd5f8-qd5b6 1/1 Running 0 2m33s
splunk-otel-collector-k8s-cluster-receiver-57569b58c8-8ghds 1/1 Running 0 2m33s
splunk-otel-collector-operator-6fd9f9d569-wd5mn 2/2 Running 0 2m33sConfirm your K8s Cluster is in O11y Cloud
In Splunk Observability Cloud, navigate to Infrastructure → Kubernetes → Kubernetes Clusters,
and then search for your Cluster Name (which is $INSTANCE-k3s-cluster):
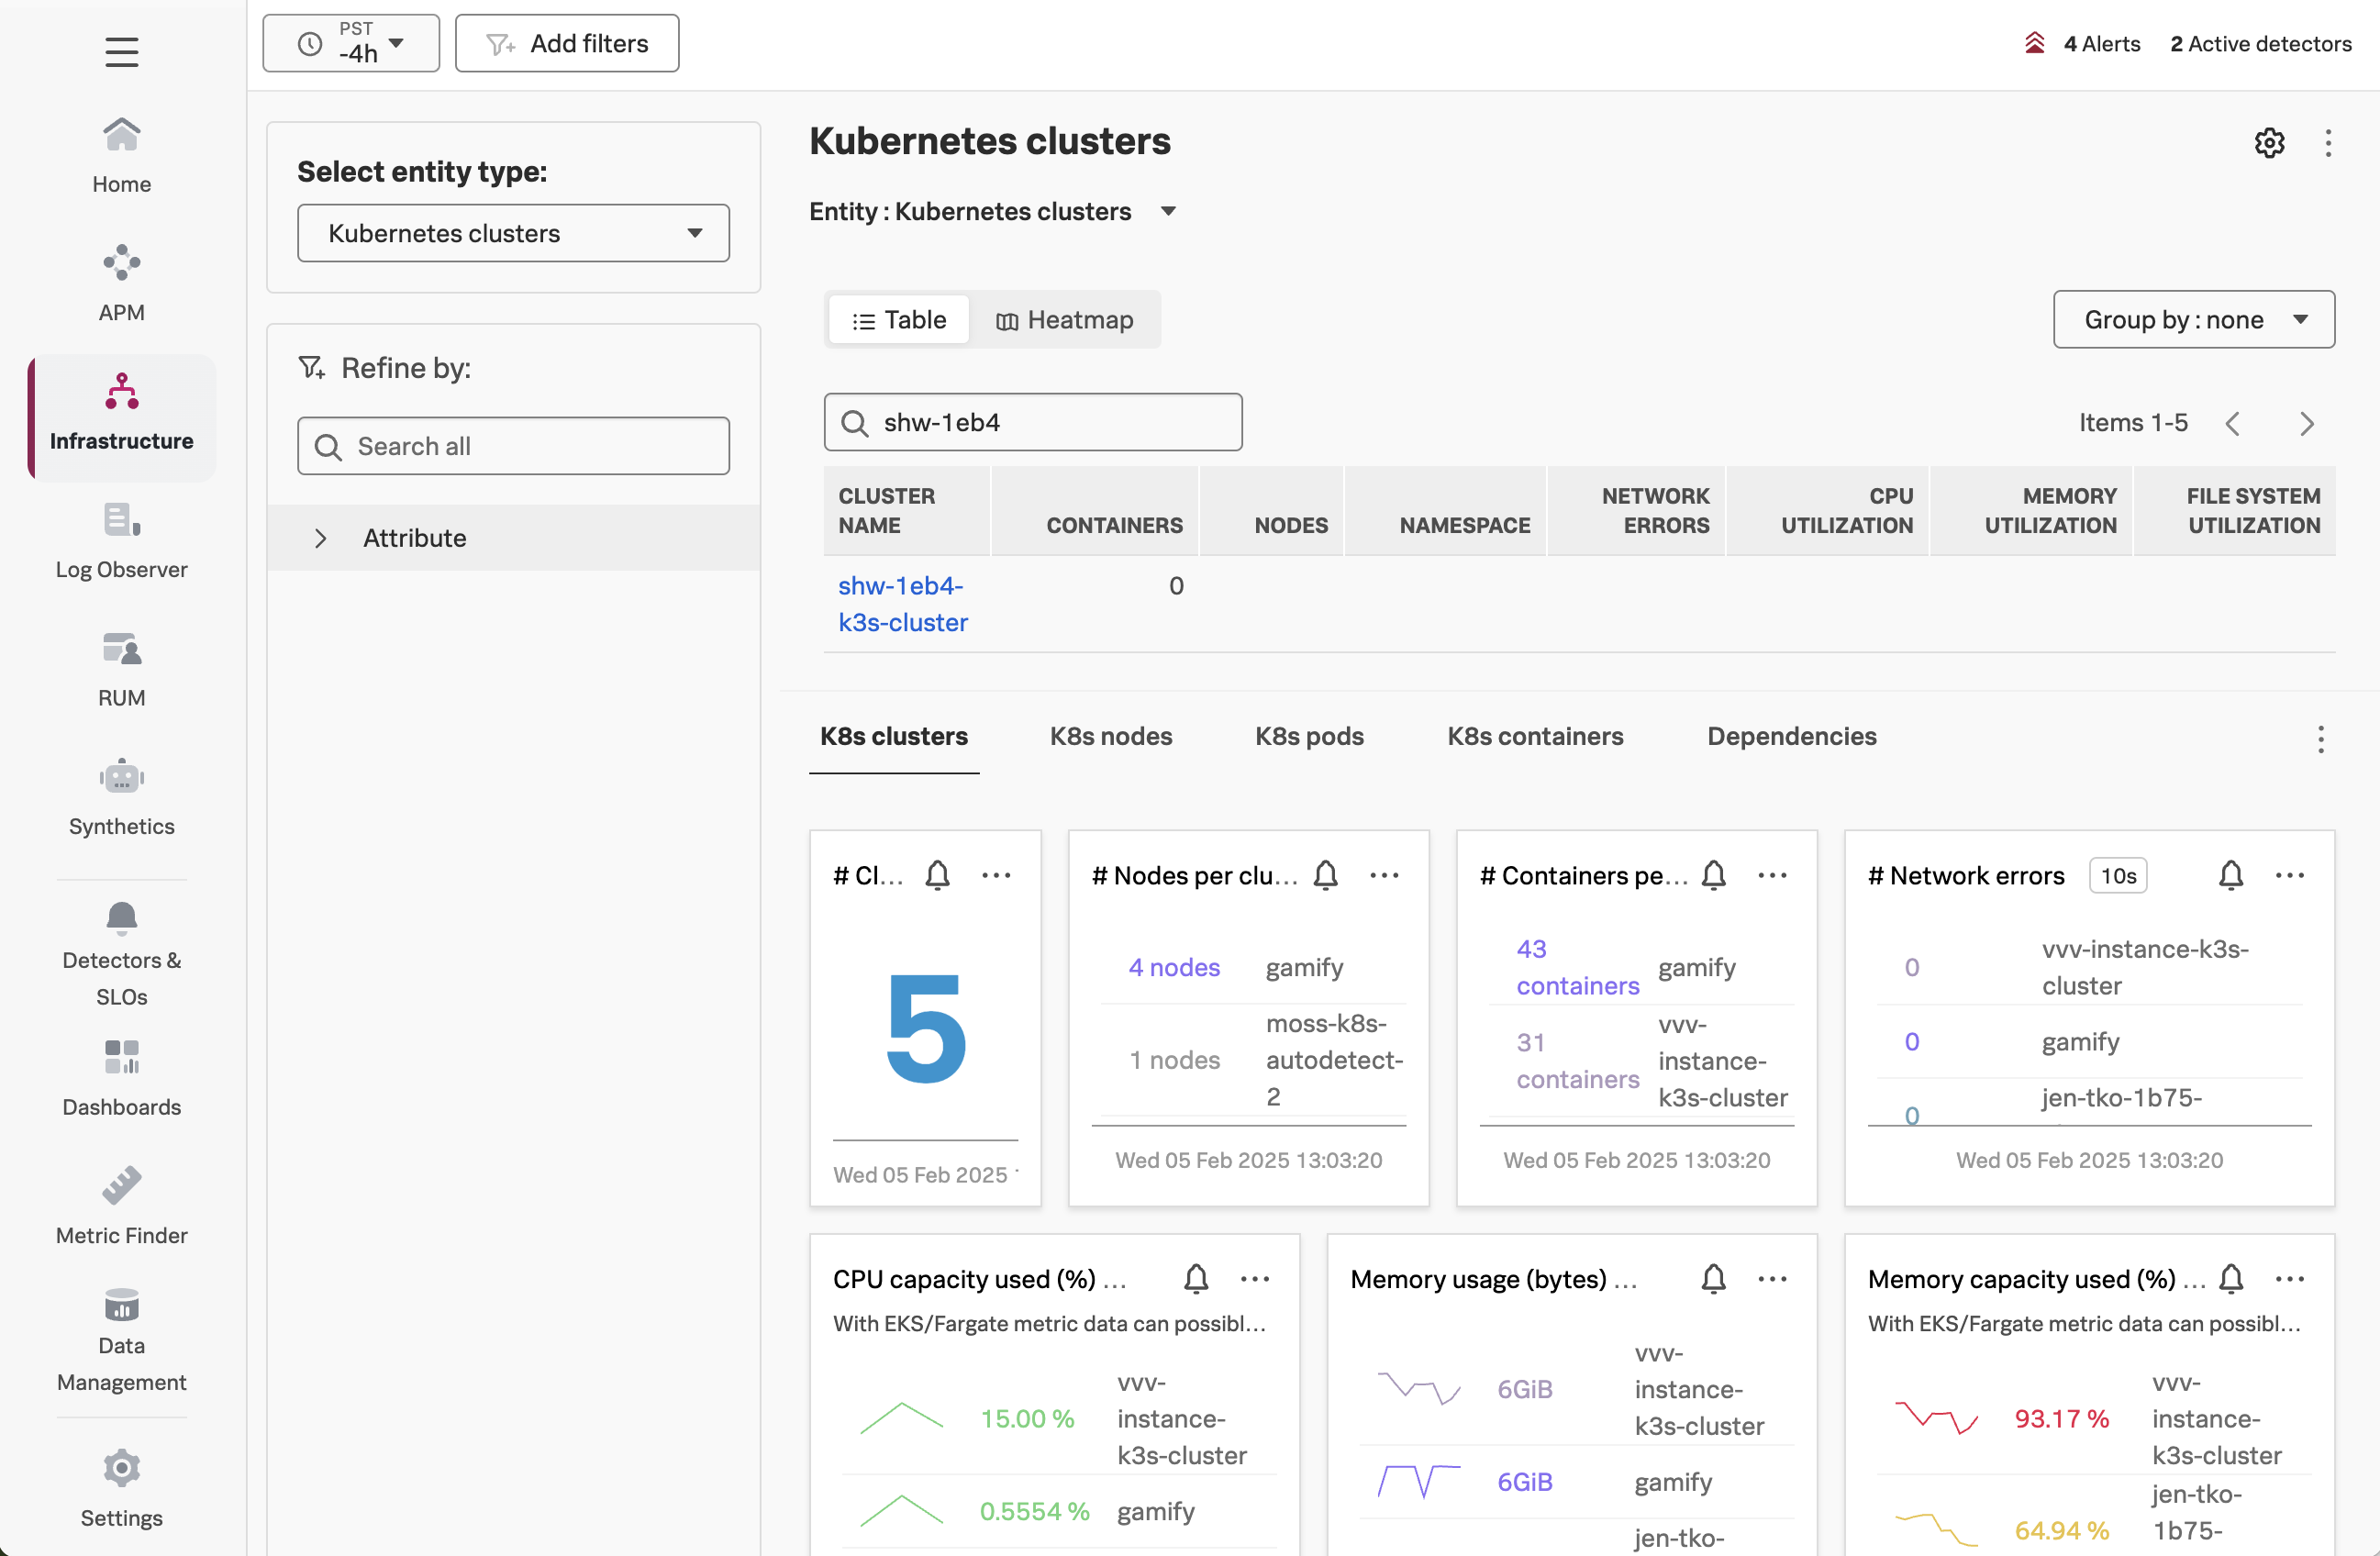
Get the Collector Configuration
Before we customize the collector config, how do we determine what the current configuration looks like?
In a Kubernetes environment, the collector configuration is stored using a Config Map.
We can see which config maps exist in our cluster with the following command:
kubectl get cm -l app=splunk-otel-collectorNAME DATA AGE
splunk-otel-collector-otel-k8s-cluster-receiver 1 3h37m
splunk-otel-collector-otel-agent 1 3h37mWe can then view the config map of the collector agent as follows:
kubectl describe cm splunk-otel-collector-otel-agentName: splunk-otel-collector-otel-agent
Namespace: default
Labels: app=splunk-otel-collector
app.kubernetes.io/instance=splunk-otel-collector
app.kubernetes.io/managed-by=Helm
app.kubernetes.io/name=splunk-otel-collector
app.kubernetes.io/version=0.113.0
chart=splunk-otel-collector-0.113.0
helm.sh/chart=splunk-otel-collector-0.113.0
heritage=Helm
release=splunk-otel-collector
Annotations: meta.helm.sh/release-name: splunk-otel-collector
meta.helm.sh/release-namespace: default
Data
====
relay:
----
exporters:
otlphttp:
headers:
X-SF-Token: ${SPLUNK_OBSERVABILITY_ACCESS_TOKEN}
metrics_endpoint: https://ingest.us1.signalfx.com/v2/datapoint/otlp
traces_endpoint: https://ingest.us1.signalfx.com/v2/trace/otlp
(followed by the rest of the collector config in yaml format) How to Update the Collector Configuration in K8s
We can customize the collector configuration in K8s using the values.yaml file.
See this file for a comprehensive list of customization options that are available in the
values.yamlfile.
Let’s look at an example.
Add the Debug Exporter
Suppose we want to see the traces that are sent to the collector. We can use the debug exporter for this purpose, which can be helpful for troubleshooting OpenTelemetry related issues.
You can use vi or nano to edit the values.yaml file. We will show an example using vi:
vi /home/splunk/workshop/tagging/otel/values.yamlAdd the debug exporter by copying and pasting the following text to the bottom of the values.yaml file:
Press ‘i’ to enter into insert mode in vi before adding the text below.
    # NEW CONTENT
    exporters:
      debug:
        verbosity: detailed
    service:
      pipelines:
        traces:
          exporters:
            - otlphttp
            - signalfx
            - debug
After these changes, the values.yaml file should include the following contents:
splunkObservability:
  profilingEnabled: true
  infrastructureMonitoringEventsEnabled: true
certmanager:
  enabled: true
operator:
  enabled: true
operatorcrds:
  install: true

agent:
  config:
    receivers:
      kubeletstats:
        insecure_skip_verify: true
        auth_type: serviceAccount
        endpoint: ${K8S_NODE_IP}:10250
        metric_groups:
          - container
          - pod
          - node
          - volume
        k8s_api_config:
          auth_type: serviceAccount
        extra_metadata_labels:
          - container.id
          - k8s.volume.type
    extensions:
      zpages:
        endpoint: 0.0.0.0:55679
    # NEW CONTENT
    exporters:
      debug:
        verbosity: detailed
    service:
      pipelines:
        traces:
          exporters:
            - otlphttp
            - signalfx
            - debug
To save your changes in vi, press the
esckey to enter command mode, then type:wq!followed by pressing theenter/returnkey.
Once the file is saved, we can apply the changes with:
cd /home/splunk/workshop/tagging

helm upgrade splunk-otel-collector  \
--set="splunkObservability.realm=$REALM" \
--set="splunkObservability.accessToken=$ACCESS_TOKEN" \
--set="clusterName=$INSTANCE-k3s-cluster" \
--set="environment=tagging-workshop-$INSTANCE" \
splunk-otel-collector-chart/splunk-otel-collector \
-f otel/values.yaml
Release "splunk-otel-collector" has been upgraded. Happy Helming!
NAME: splunk-otel-collector
LAST DEPLOYED: Mon Dec 23 19:08:08 2024
NAMESPACE: default
STATUS: deployed
REVISION: 2
NOTES:
Splunk OpenTelemetry Collector is installed and configured to send data to Splunk Observability realm us1.Whenever a change to the collector config is made via a values.yaml file, it’s helpful
to review the actual configuration applied to the collector by looking at the config map:
kubectl describe cm splunk-otel-collector-otel-agentWe can see that the debug exporter was added to the traces pipeline, as desired:
  traces:
    exporters:
    - otlphttp
    - signalfx
    - debug
We’ll explore the output of the debug exporter once we deploy an application in our cluster and start capturing traces.