Review Kubernetes Audit Logs
In this section you will review the Kubernetes Audit Logs that are being collected. You can see that the events are quite robust, which can make charting them inefficient. To address this, you will create an Ingest Pipeline in Ingest Processor that will convert these events to metrics that will be sent to Splunk Observability Cloud. This will allow you to chart the events much more efficiently and take advantage of the real-time streaming metrics in Splunk Observability Cloud.
Exercise: Create Ingest Pipeline
1. Open your Ingest Processor Cloud Stack instance using the URL provided in the Splunk Show workshop details.
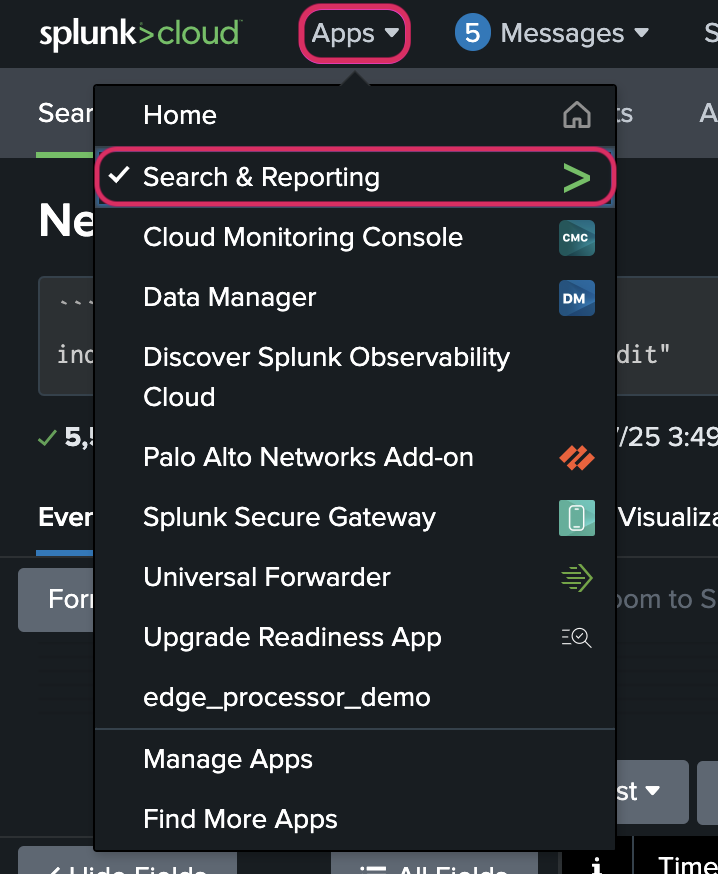
2. Navigate to Apps → Search and Reporting
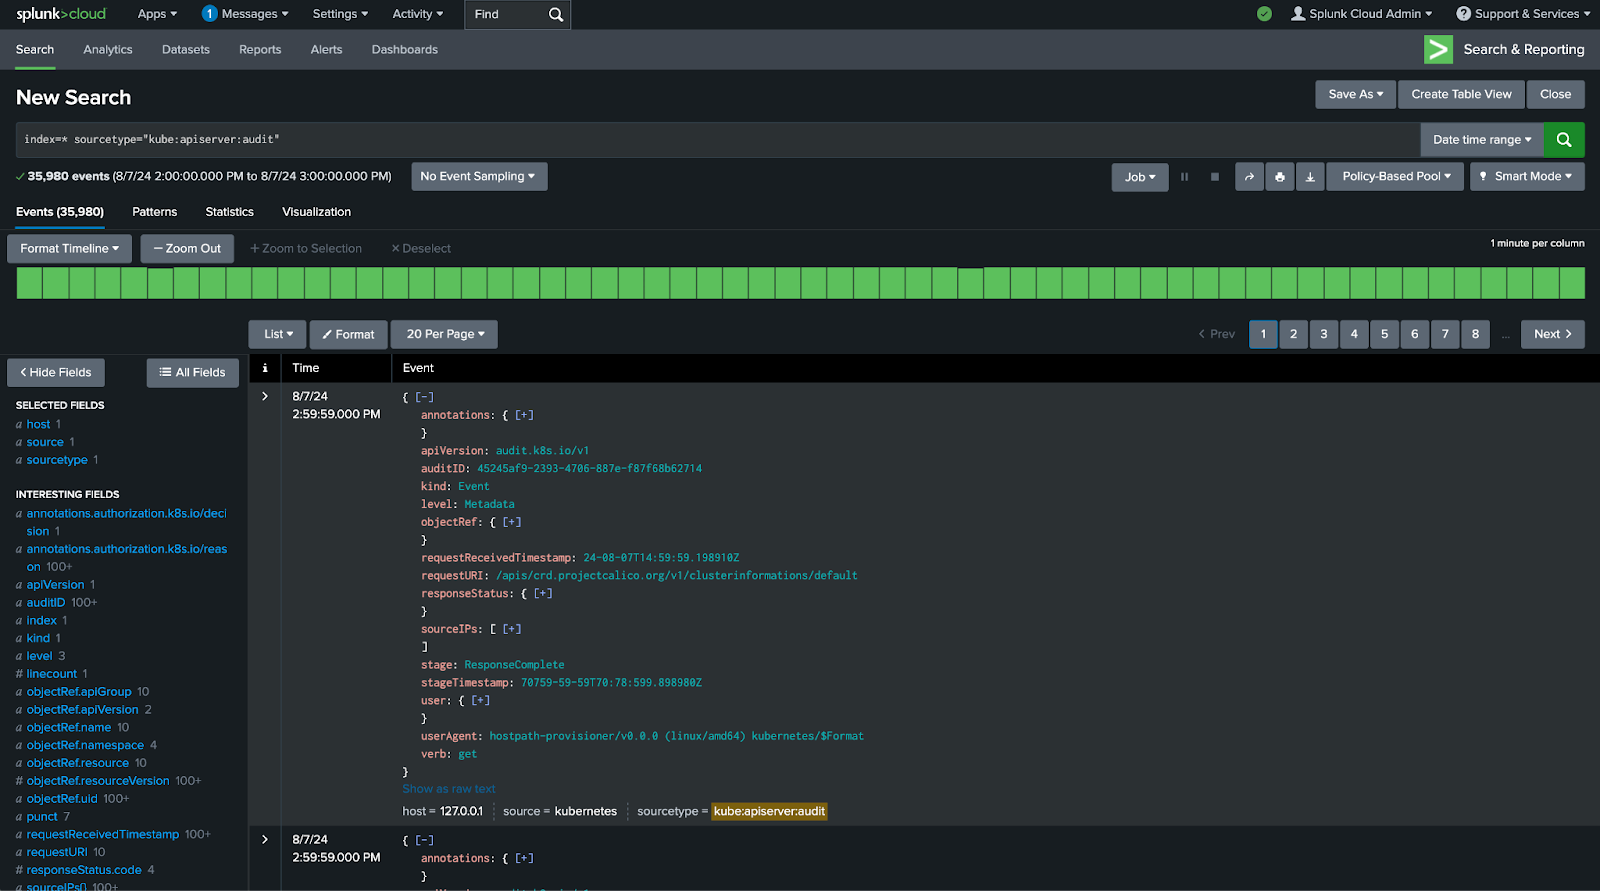
3. In the search bar, enter the following SPL search string.
Note
Make sure to replace USER_ID with the User ID provided in your Splunk Show instance information.
### Replace USER_ID with the User ID provided in your Splunk Show instance information
index=main sourcetype="kube:apiserver:audit:USER_ID"
4. Press Enter or click the green magnifying glass to run the search.
Note
You should now see the Kubernetes Audit Logs for your environment. Notice that the events are fairly robust. Explore the available fields and start to think about what information would be good candidates for metrics and dimensions. Ask yourself: What fields would I like to chart, and how would I like to be able to filter, group, or split those fields?