Create an Ingest Pipeline
In this section you will create an Ingest Pipeline which will convert Kubernetes Audit Logs to metrics which are sent to the Splunk Observability Cloud workshop organization.
Exercise: Create Ingest Pipeline
1. Open the Ingest Processor SCS Tenant using the connection details provided in the Splunk Show event.
Note
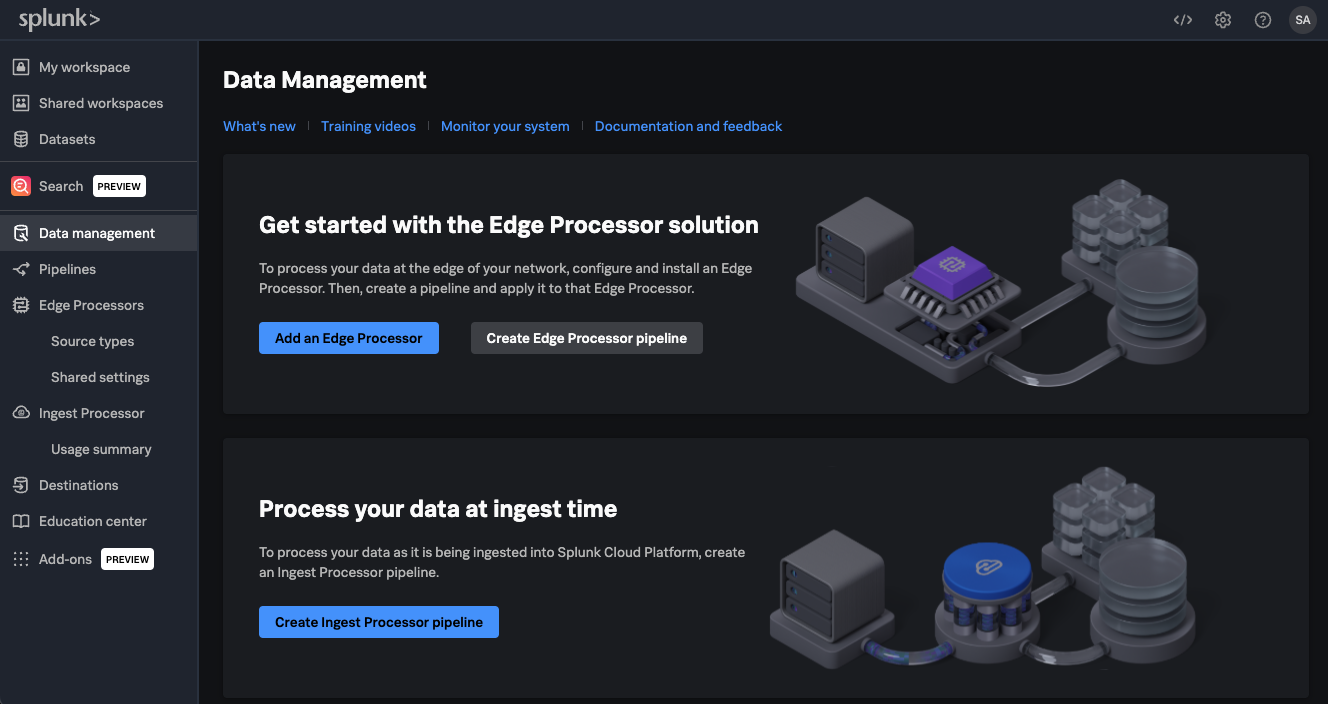
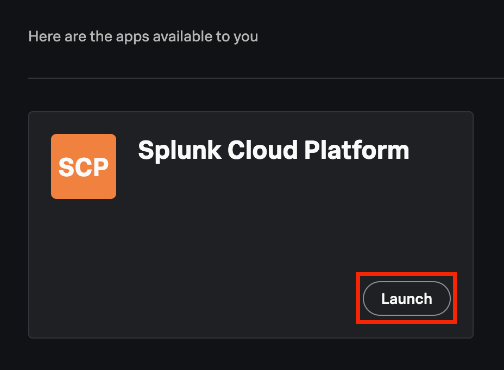
When you open the Ingest Processor SCS Tenant, if you are taken to a welcome page, click on Launch under Splunk Cloud Platform to be taken to the Data Management page where you will configure the Ingest Pipeline.
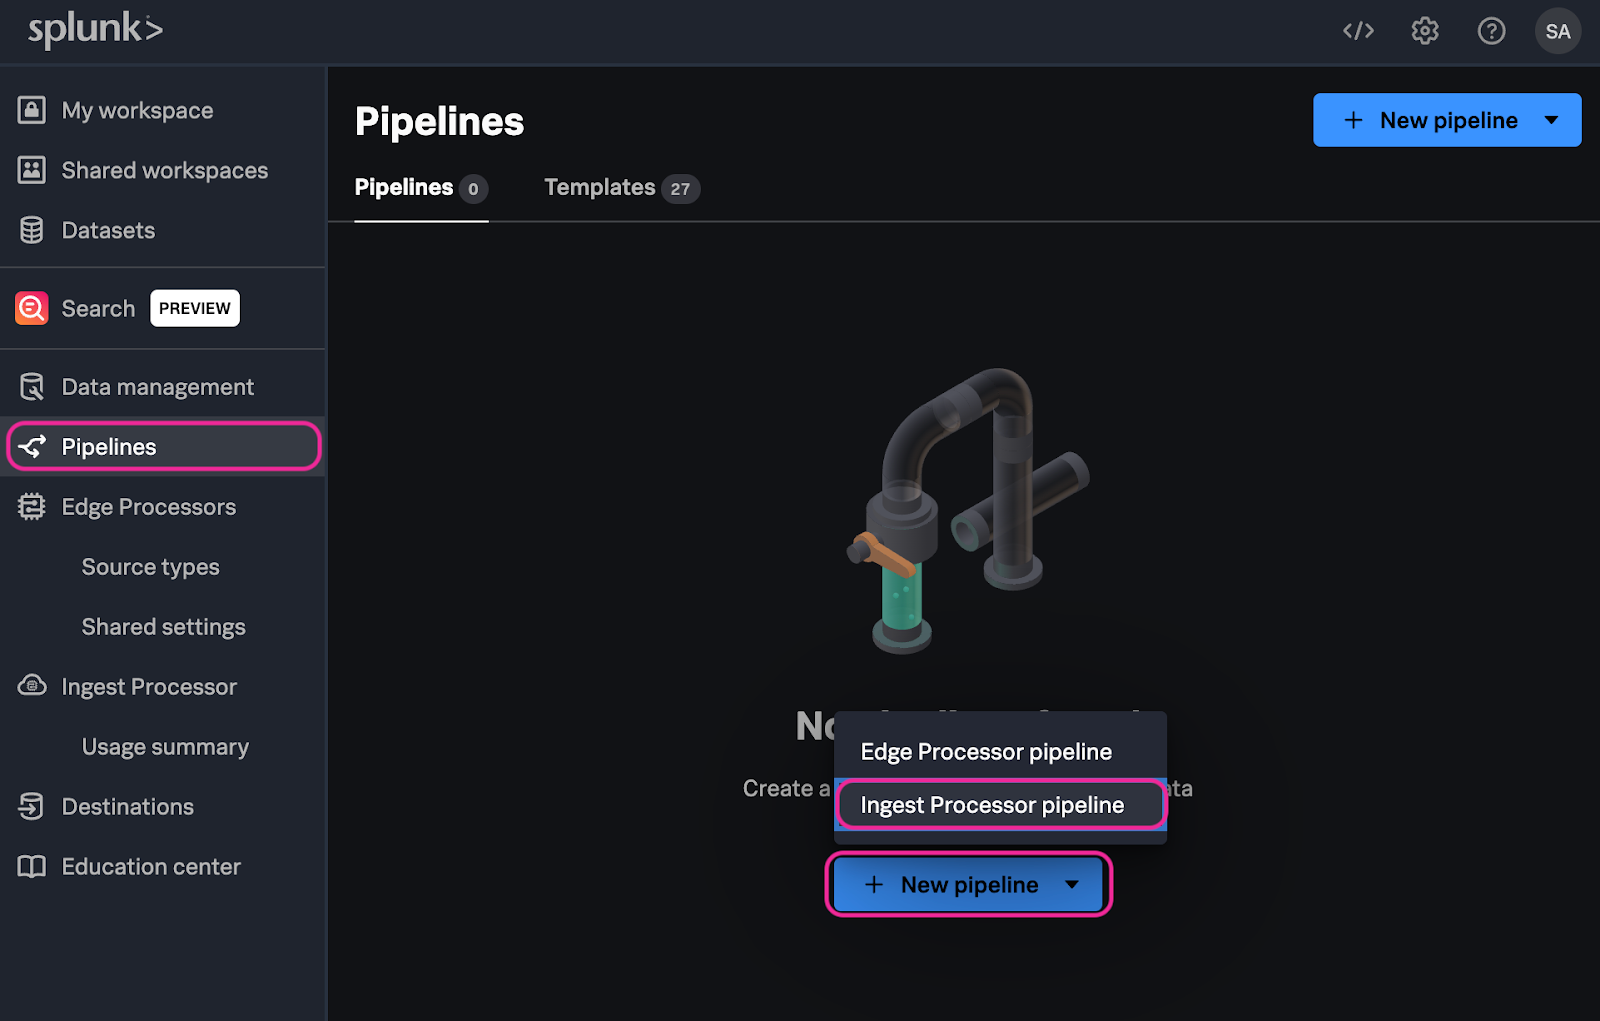
2. From the Splunk Data Management console select Pipelines → New pipeline → Ingest Processor pipeline.
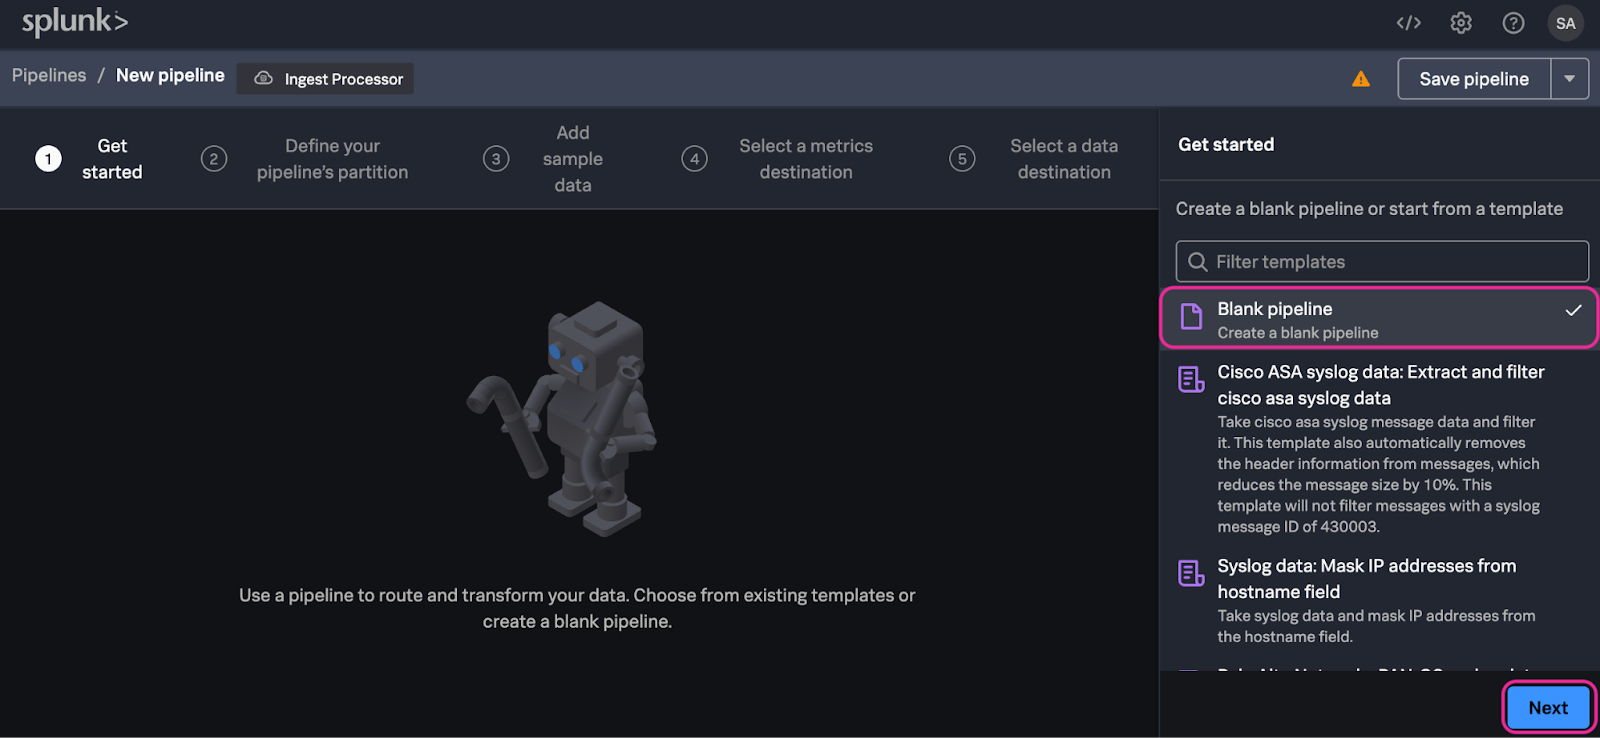
3. In the Get started step of the Ingest Processor configuration page select Blank Pipeline and click Next.
4. In the Define your pipeline’s partition step of the Ingest Processor configuration page select Partition by sourcetype. Select the = equals Operator and enter kube:apiserver:audit:USER_ID (Be sure to replace USER_ID with the User ID you were assigned) for the value. Click Apply.
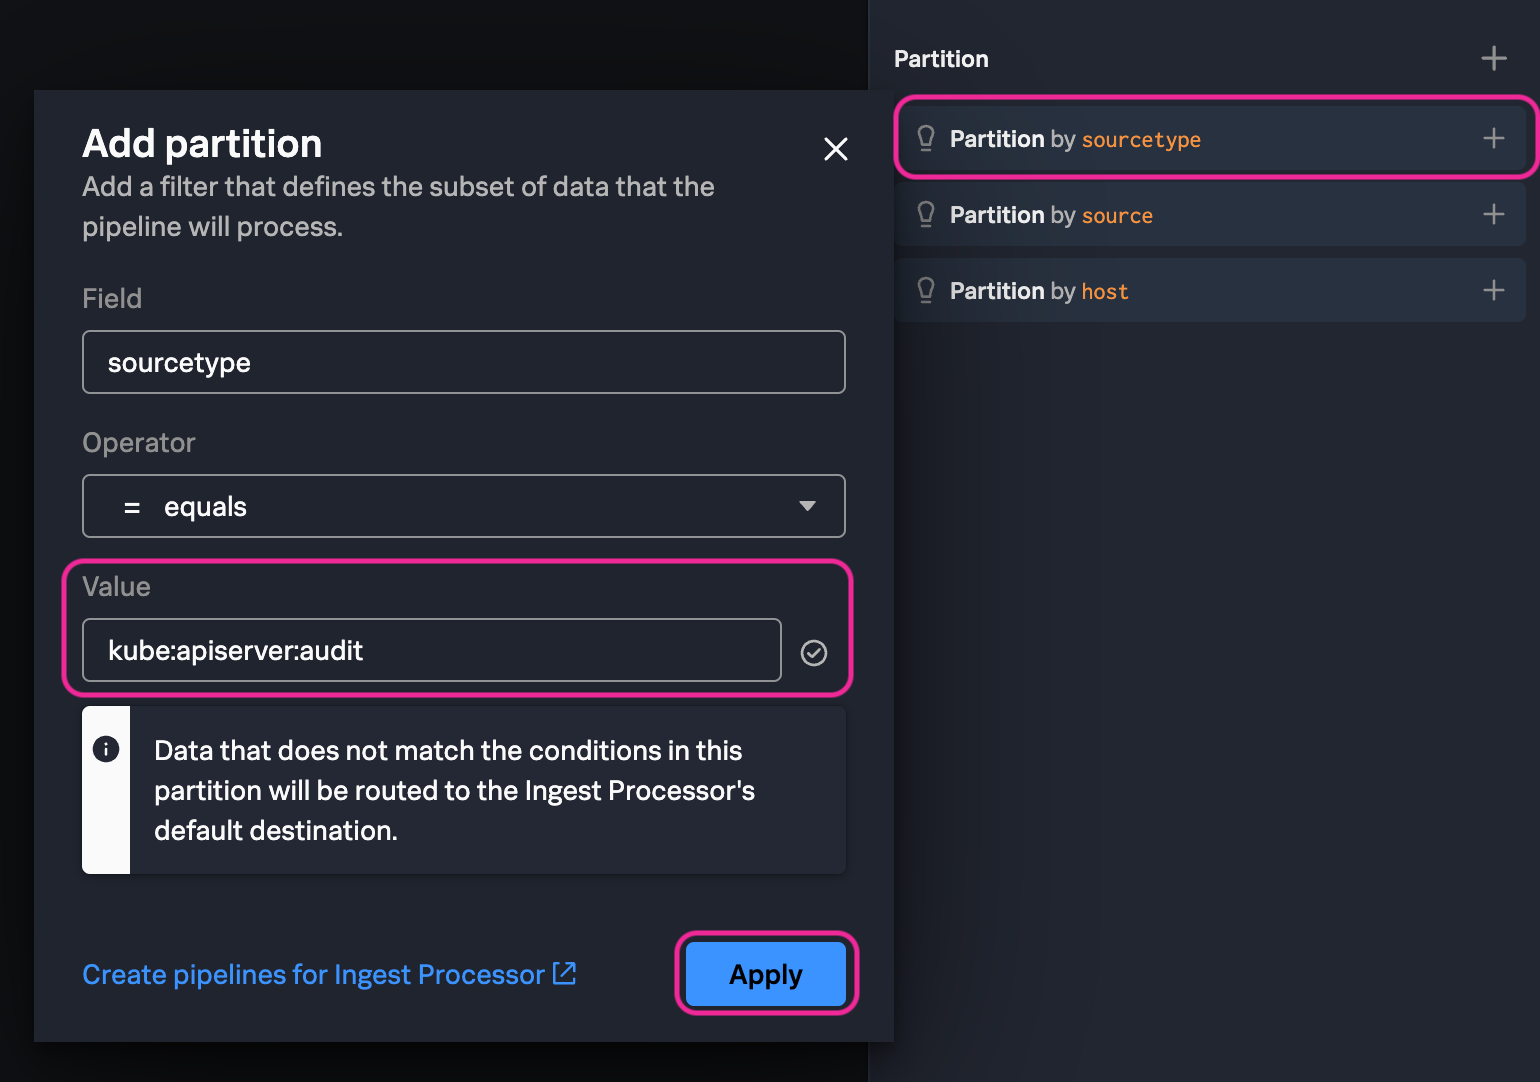
5. Click Next
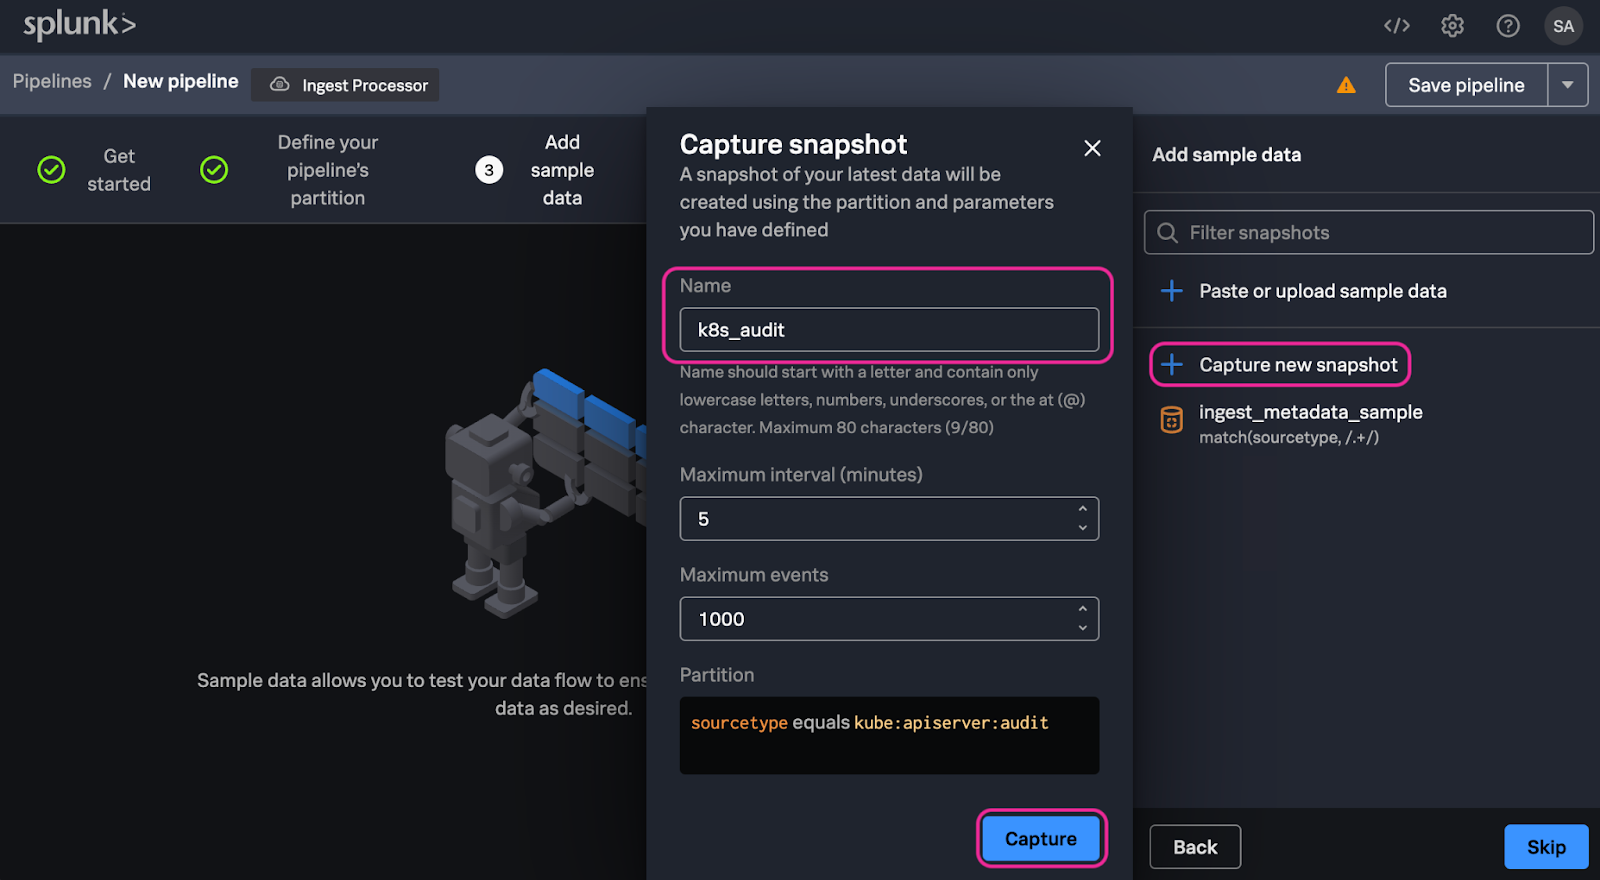
6. In the Add sample data step of the Ingest Processor configuration page select Capture new snapshot. Enter k8s_audit_USER_ID (Be sure to replace USER_ID with the User ID you were assigned) for the Snapshot name and click Capture.
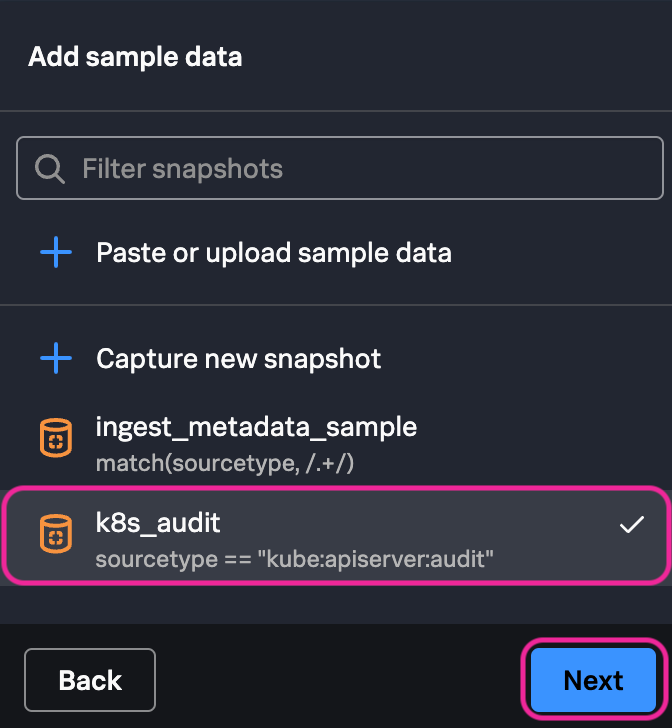
7. Make sure your newly created snapshot (k8s_audit_USER_ID) is selected and then click Next.
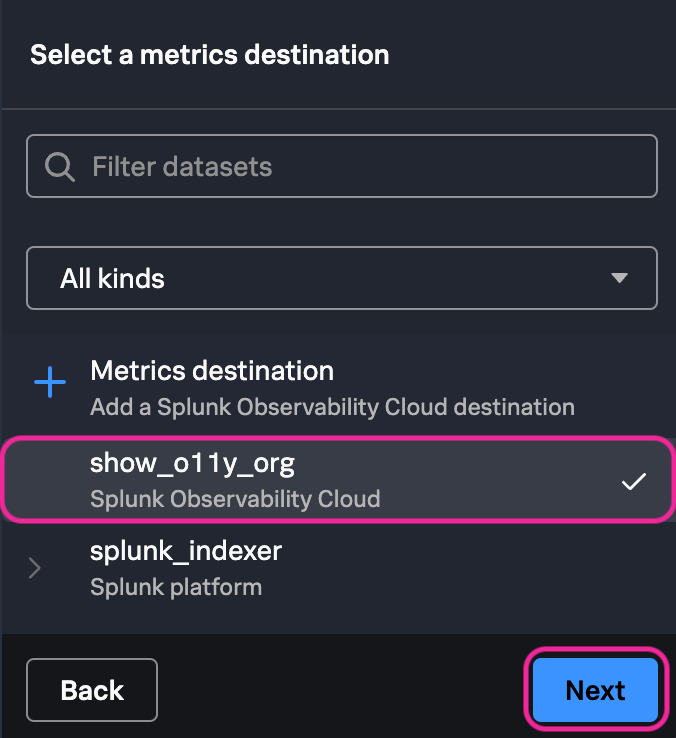
8. In the Select a metrics destination step of the Ingest Processor configuration page select show_o11y_org. Click Next.
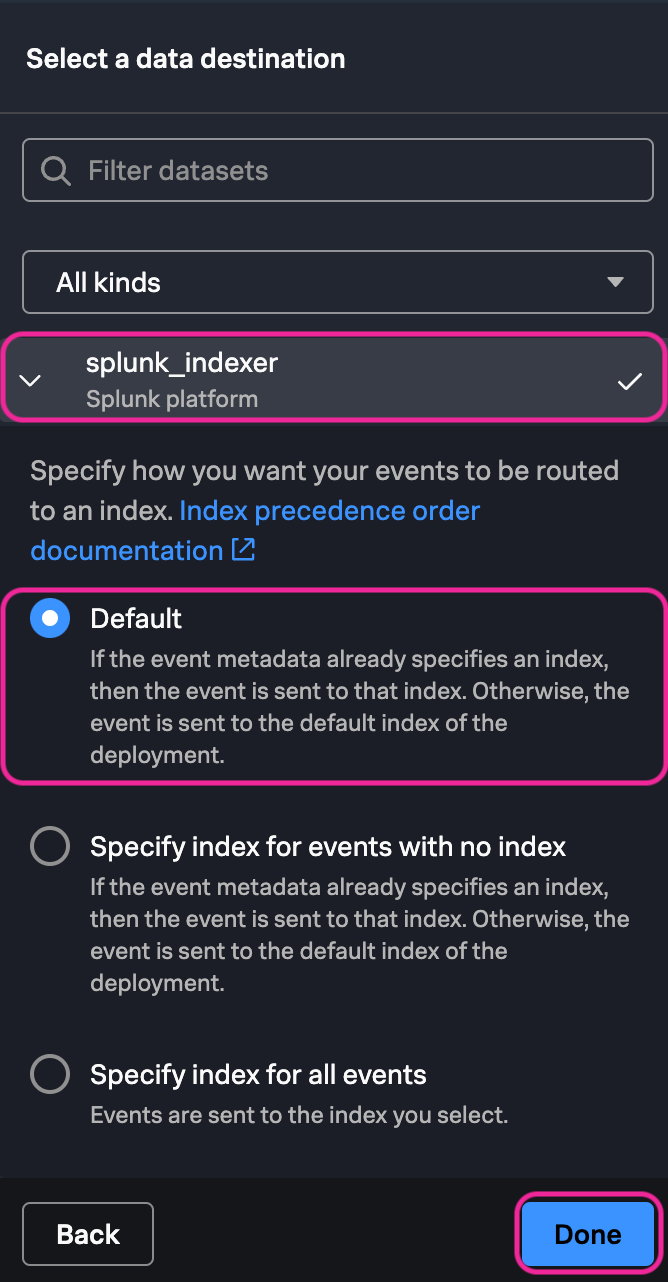
9. In the Select a data destination step of the Ingest Processor configuration page select splunk_indexer. Under Specify how you want your events to be routed to an index select Default. Click Done.
10. In the Pipeline search field replace the default search with the following.
Note
Replace UNIQUE_FIELD in the metric name with a unique value (such as your initials) which will be used to identify your metric in Observability Cloud.
/*A valid SPL2 statement for a pipeline must start with "$pipeline", and include "from $source" and "into $destination".*/
/* Import logs_to_metrics */
import logs_to_metrics from /splunk/ingest/commands
$pipeline =
| from $source
| thru [
        //define the metric name, type, and value for the Kubernetes Events
        //
        // REPLACE UNIQUE_FIELD WITH YOUR INITIALS
        //
        | logs_to_metrics name="k8s_audit_UNIQUE_FIELD" metrictype="counter" value=1 time=_time
        | into $metrics_destination
    ]
| eval index = "kube_logs"
| into $destination;
New to SPL2?
Here is a breakdown of what the SPL2 query is doing:
- First, you are importing the built-in
logs_to_metricscommand which will be used to convert the kubernetes events to metrics. - You’re using the source data, which you can see on the right is any event from the
kube:apiserver:auditsourcetype. - Now, you use the
thrucommand which writes the source dataset to the following command, in this caselogs_to_metrics. - You can see that the metric name (
k8s_audit), metric type (counter), value, and timestamp are all provided for the metric. You’re using a value of 1 for this metric because we want to count the number of times the event occurs. - Next, you choose the destination for the metric using the into
$metrics_destintationcommand, which is our Splunk Observability Cloud organization - Finally, you can send the raw log events to another destination, in this case another index, so they are retained if we ever need to access them.
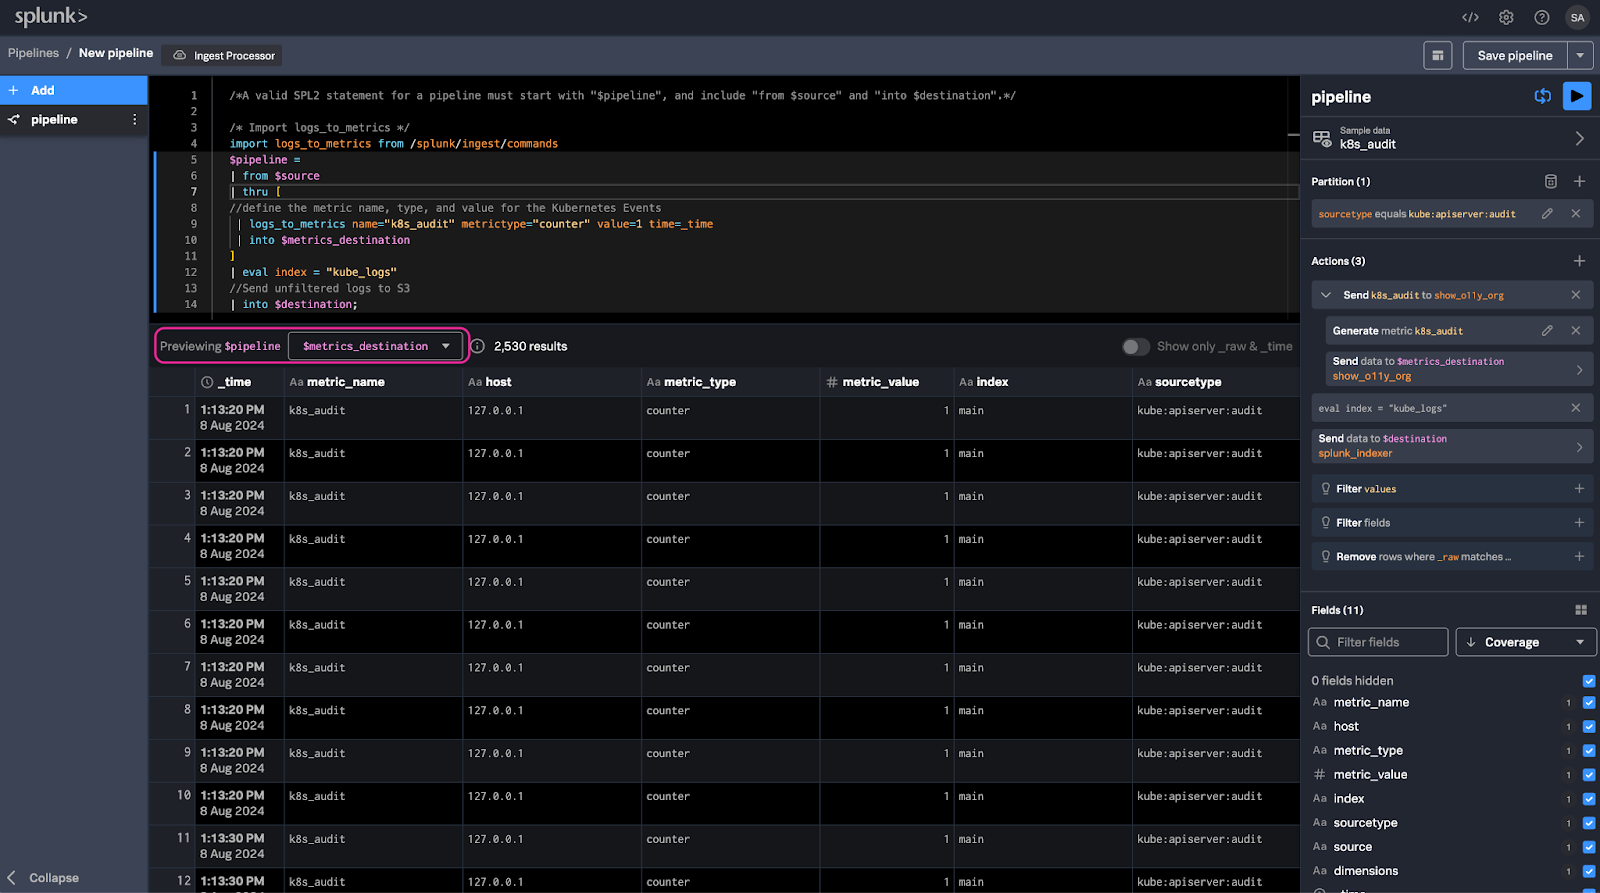
11. In the upper-right corner click the Preview button  or press CTRL+Enter (CMD+Enter on Mac). From the Previewing $pipeline dropdown select $metrics_destination. Confirm you are seeing a preview of the metrics that will be sent to Splunk Observability Cloud.
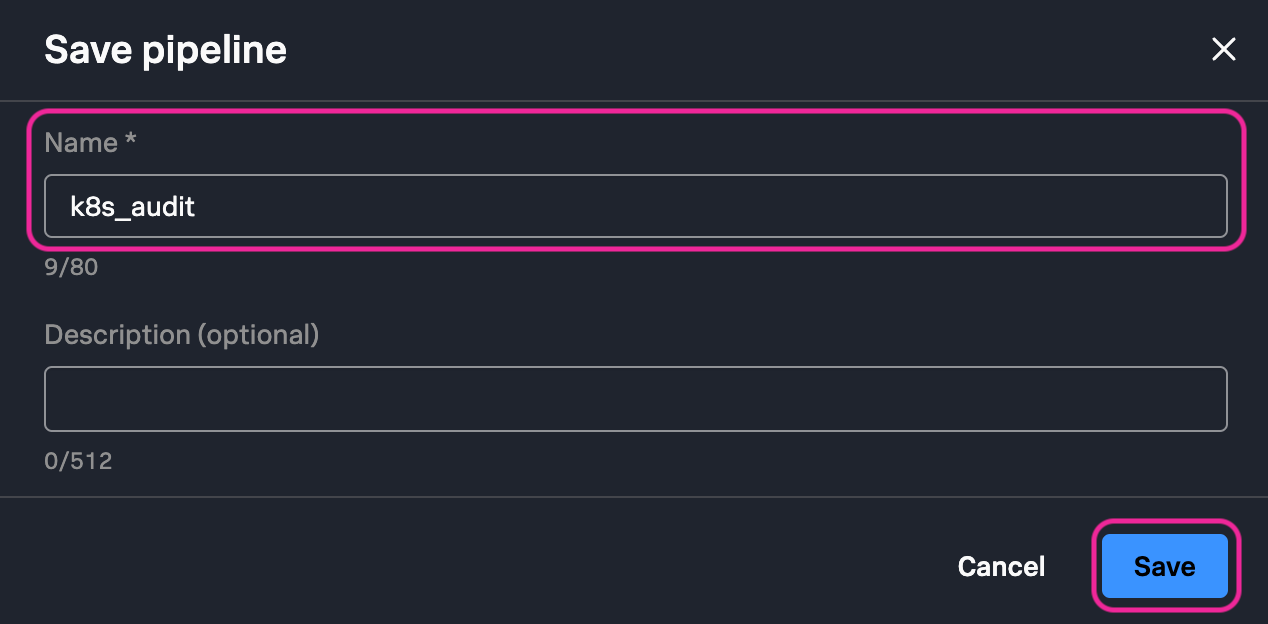
12. In the upper-right corner click the Save pipeline button  . Enter
 Kubernetes Audit Logs2Metrics USER_ID for your pipeline name and click Save.
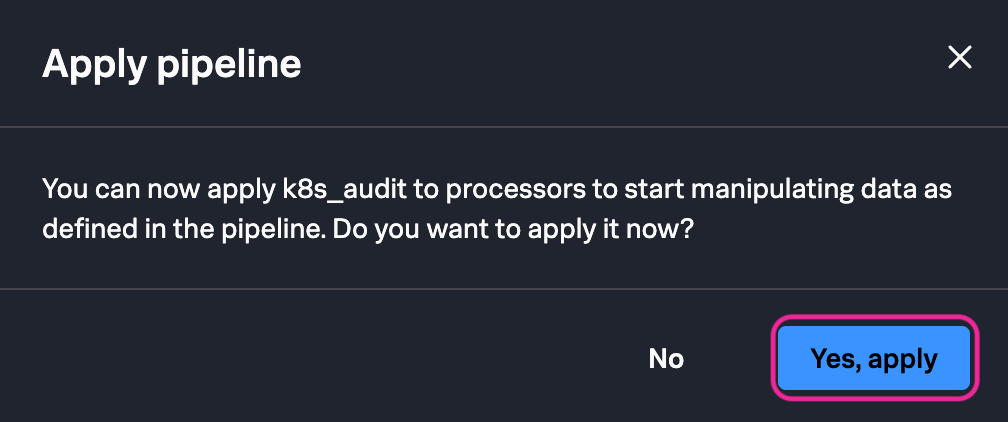
13. After clicking save you will be asked if you would like to apply the newly created pipeline. Click Yes, apply.
Note
The Ingest Pipeline should now be sending metrics to Splunk Observability Cloud. Keep this tab open as it will be used it again in the next section.
In the next step you’ll confirm the pipeline is working by viewing the metrics you just created in Splunk Observability Cloud.