Update Ingest Pipeline
Exercise: Update Ingest Pipeline
1. Navigate back to the configuration page for the Ingest Pipeline you created in the previous step.
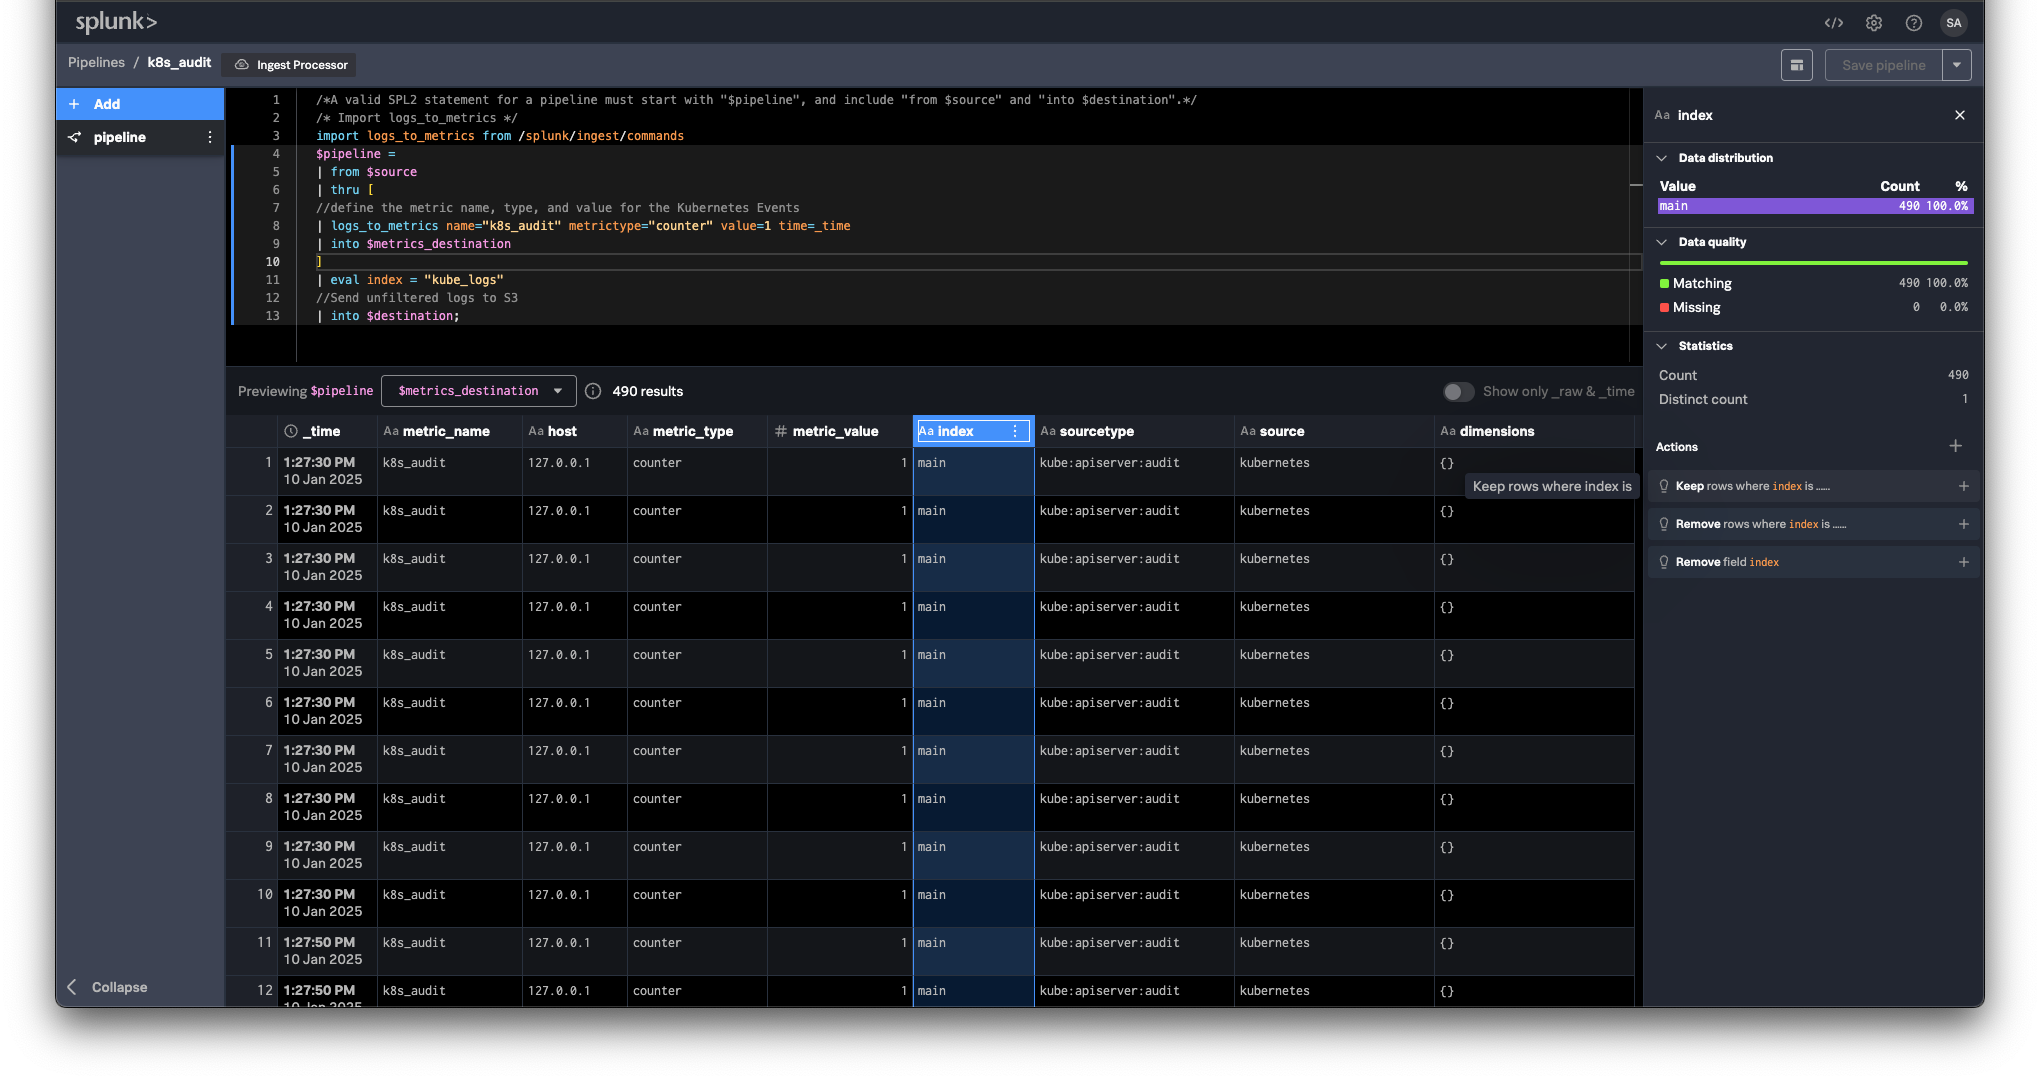
2. To add dimensions to the metric from the raw Kubernetes audit logs update the SPL2 query you created for the pipeline by replacing the logs_to_metrics portion of the query with the following:
Note
Be sure to update the metric name field (name="k8s_audit_UNIQUE_FIELD") to the name you provided in the original pipeline
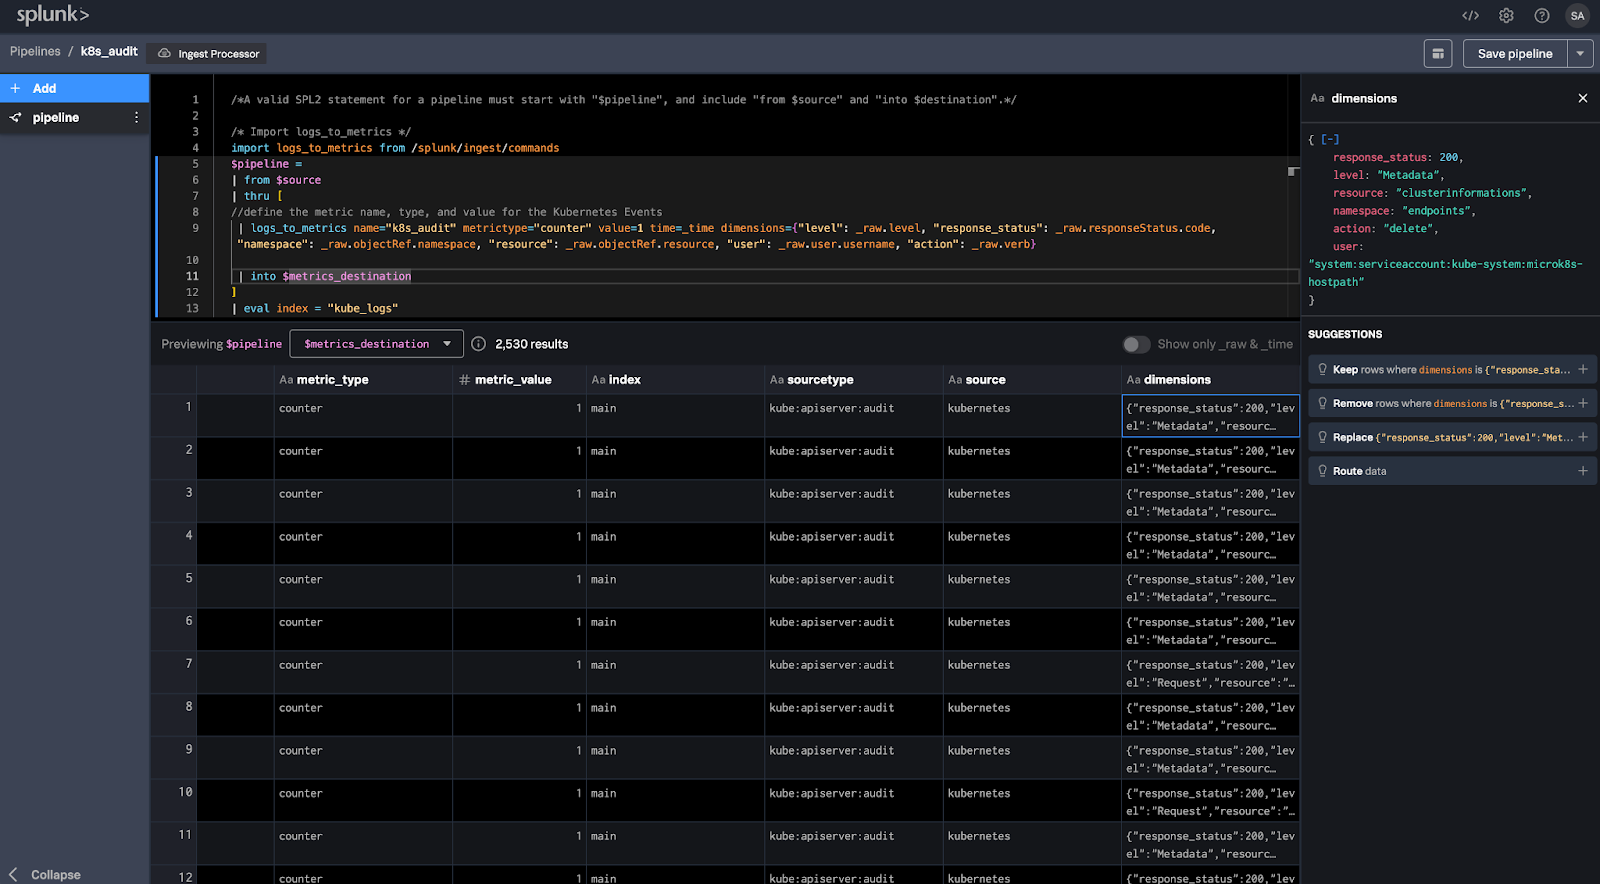
| logs_to_metrics name="k8s_audit_UNIQUE_FIELD" metrictype="counter" value=1 time=_time dimensions={"level": _raw.level, "response_status": _raw.responseStatus.code, "namespace": _raw.objectRef.namespace, "resource": _raw.objectRef.resource, "user": _raw.user.username, "action": _raw.verb}Note
Using the dimensions field in the SPL2 query you can add dimensions from the raw events to the metrics that will be sent to Splunk Observability Cloud. In this case you are adding the event response status, namespace, Kubernetes resource, user, and verb (action that was performed). These dimensions can be used to create more granular dashboards and alerts.
You should consider adding any common tags across your services so that you can take advantage of context propagation and related content in Splunk Observability Cloud.
The updated pipeline should now be the following:
/*A valid SPL2 statement for a pipeline must start with "$pipeline", and include "from $source" and "into $destination".*/
/* Import logs_to_metrics */
import logs_to_metrics from /splunk/ingest/commands
$pipeline =
| from $source
| thru [
//define the metric name, type, and value for the Kubernetes Events
//
// REPLACE UNIQUE_FIELD WITH YOUR INITIALS
//
| logs_to_metrics name="k8s_audit_UNIQUE_FIELD" metrictype="counter" value=1 time=_time dimensions={"level": _raw.level, "response_status": _raw.responseStatus.code, "namespace": _raw.objectRef.namespace, "resource": _raw.objectRef.resource, "user": _raw.user.username, "action": _raw.verb}
| into $metrics_destination
]
| eval index = "kube_logs"
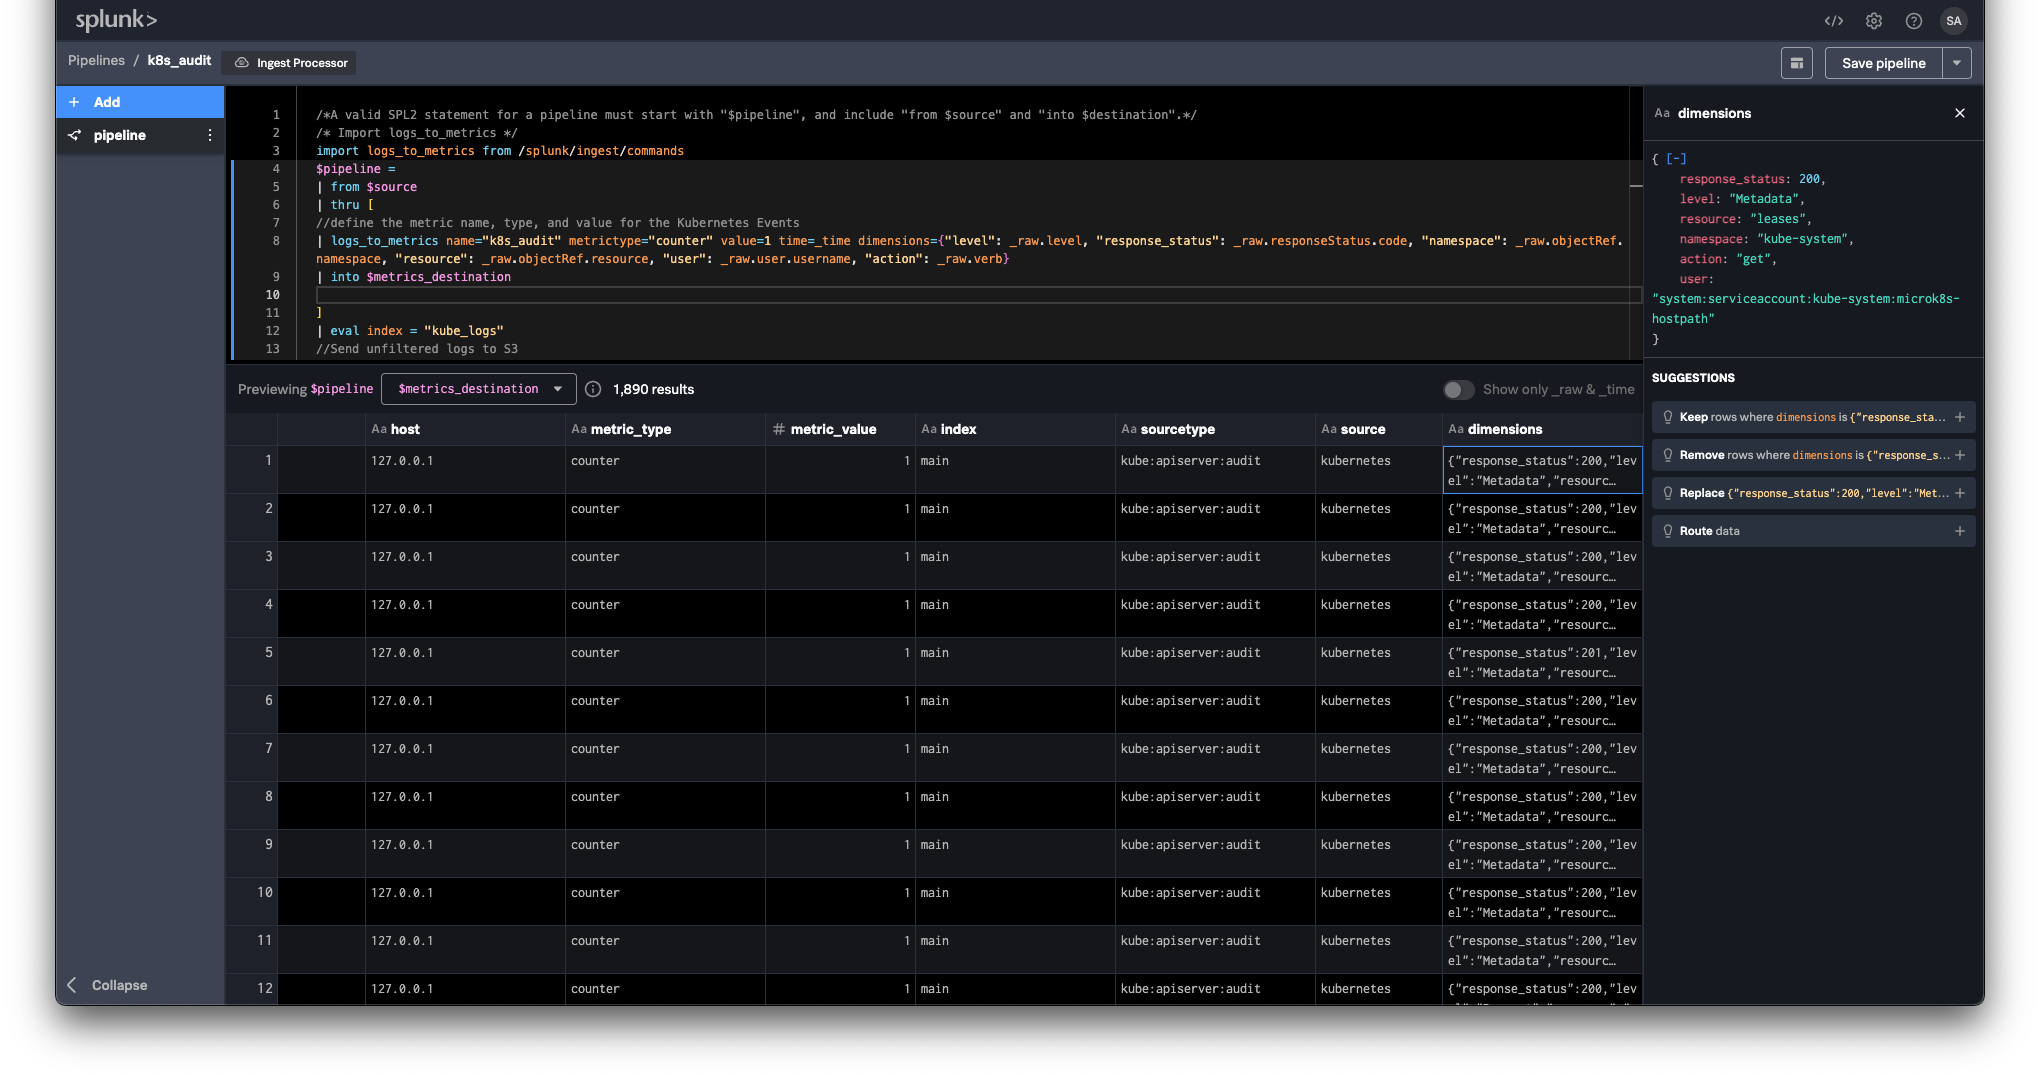
| into $destination;3. In the upper-right corner click the Preview button  or press CTRL+Enter (CMD+Enter on Mac). From the Previewing $pipeline dropdown select $metrics_destination. Confirm you are seeing a preview of the metrics that will be sent to Splunk Observability Cloud.
4. Confirm you are seeing the dimensions in the dimensions column of the preview table. You can view the entire dimensions object by clicking into the table.
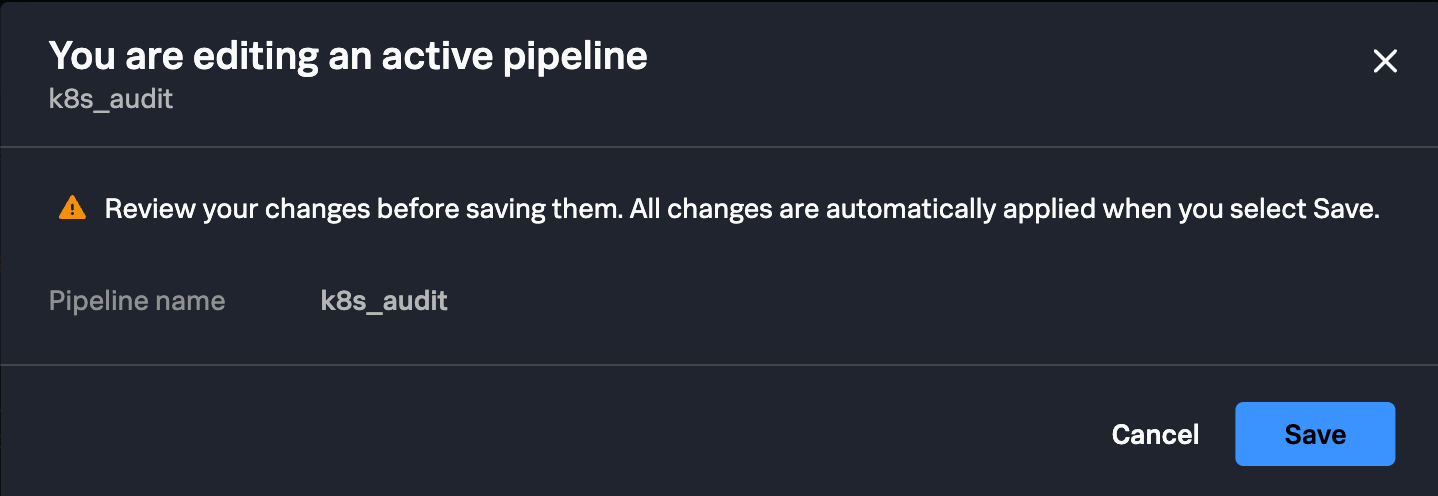
5. In the upper-right corner click the Save pipeline button  . On the “You are editing an active pipeline modal” click Save.
Note
Because this pipeline is already active, the changes you made will take effect immediately. Your metric should now be split into multiple metric timeseries using the dimensions you added.
In the next step you will create a visualization using different dimensions from the Kubernetes audit events.