Conclusion
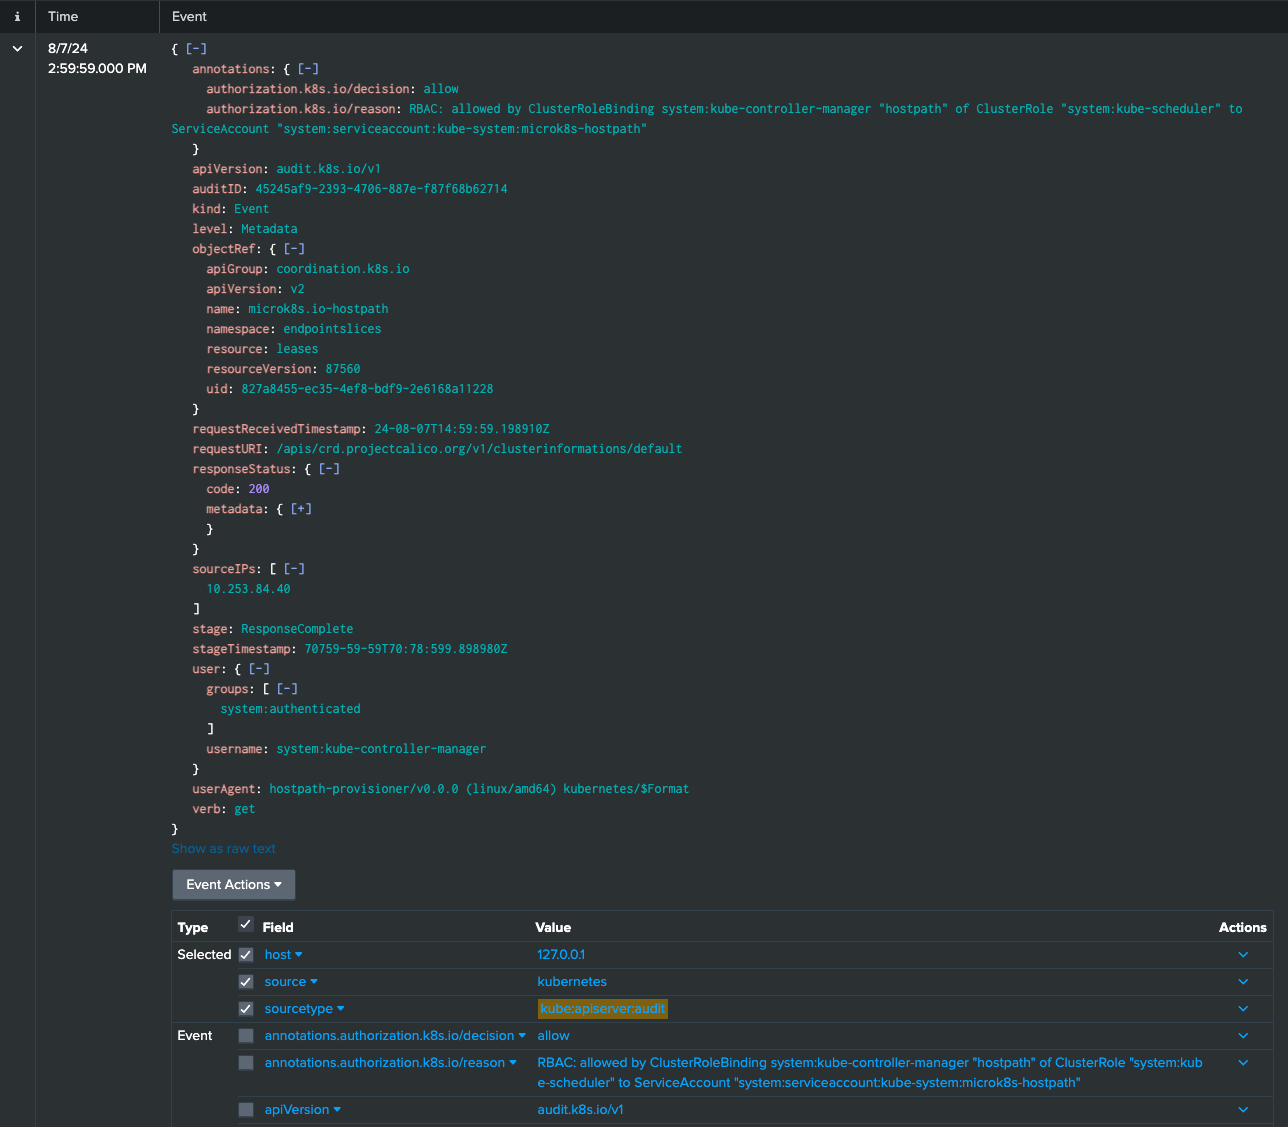
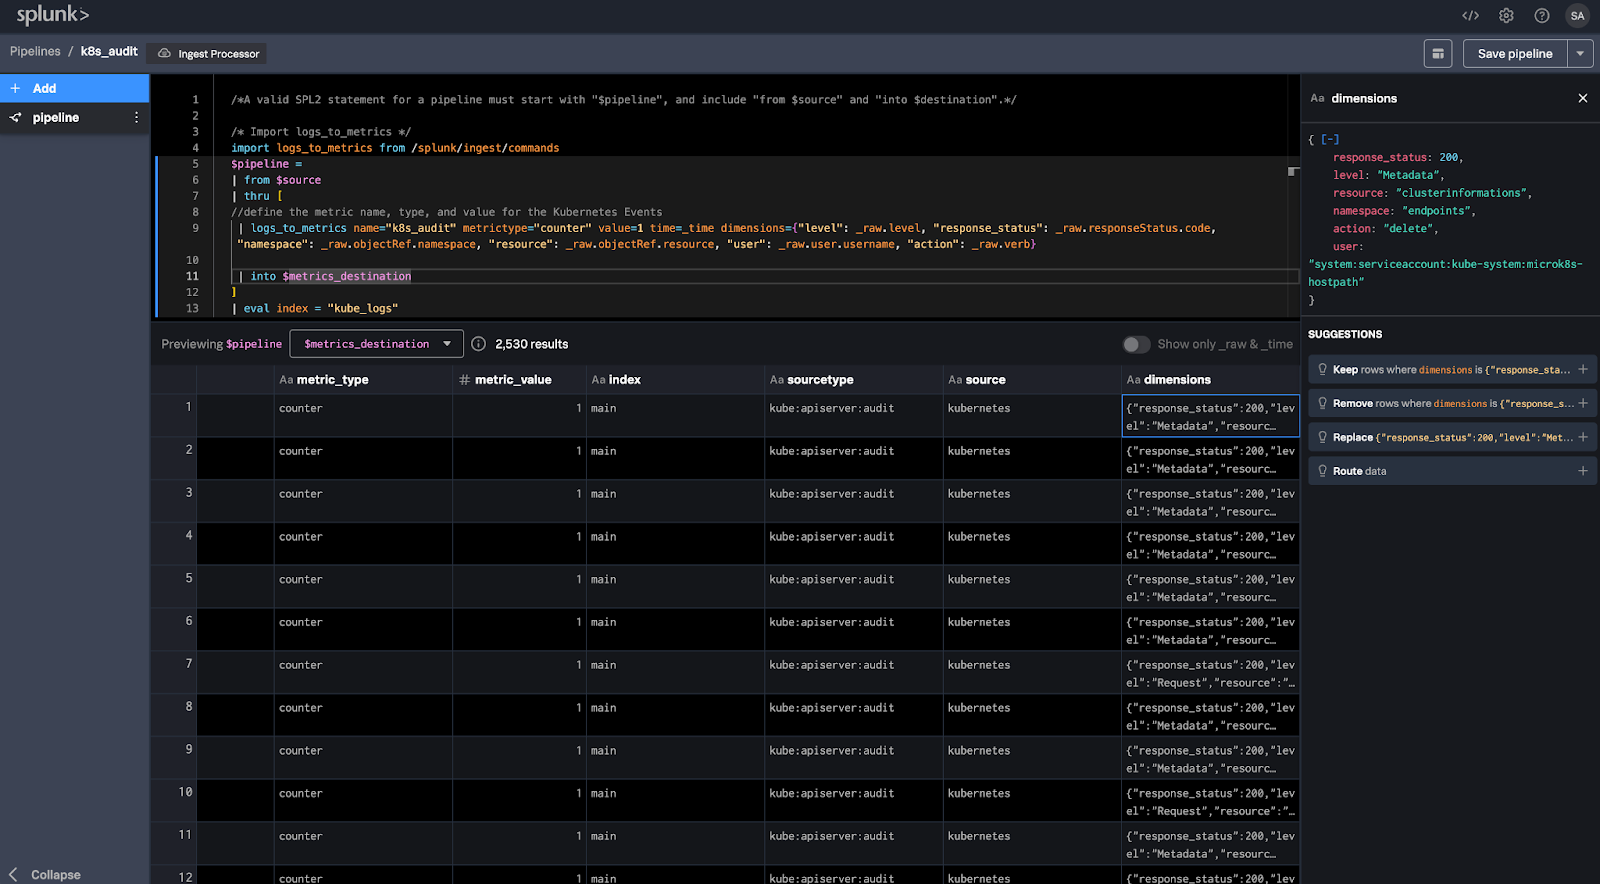
In this workshop, you walked through the entire process of optimizing Kubernetes log management by converting detailed log events into actionable metrics using Splunk Ingest Pipelines. You started by defining a pipeline that efficiently converts Kubernetes audit logs into metrics, drastically reducing the data volume while retaining critical information. You then ensured the raw log events were securely stored in S3 for long-term retention and deeper analysis.
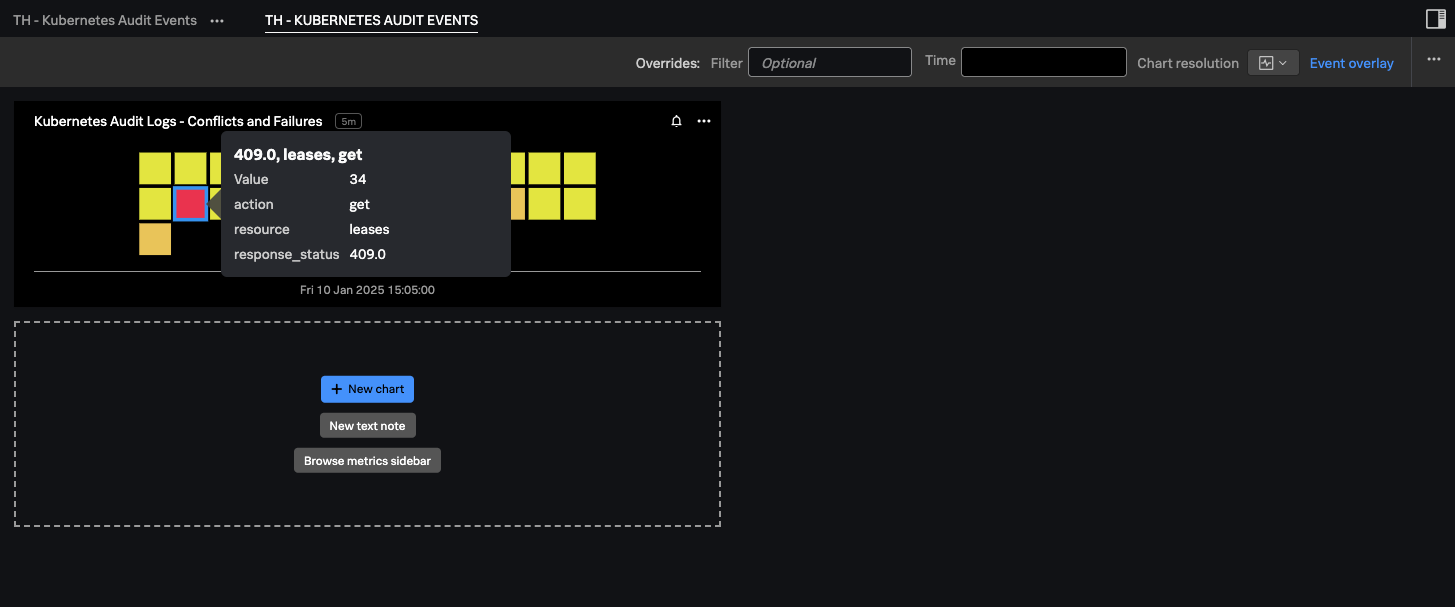
Next, you demonstrated how to enhance these metrics by adding key dimensions from the raw events, enabling us to drill down into specific actions and resources. you created a chart that filtered the metrics to focus on errors, breaking them out by resource and action. This allowed us to pinpoint exactly where issues were occurring in real-time.
The real-time architecture of Splunk Observability Cloud means that these metrics can trigger alerts the moment an issue is detected, significantly reducing the Mean Time to Detection (MTTD). Additionally, you showed how this chart can be easily saved to new or existing dashboards, ensuring ongoing visibility and monitoring of critical metrics.
The value behind this approach is clear: by converting logs to metrics using Ingest Processor, you not only streamline data processing and reduce storage costs but also gain the ability to monitor and respond to issues in real-time using Splunk Observability Cloud. This results in faster problem resolution, improved system reliability, and more efficient resource utilization, all while maintaining the ability to retain and access the original logs for compliance or deeper analysis.
Happy Splunking!