Correlate Metrics and Logs

1 minute   Author Tim Hard

Correlating infrastructure metrics and logs is often a challenging task, primarily due to inconsistencies in naming conventions across various data sources, including hosts operating on different systems. However, leveraging the capabilities of OpenTelemetry can significantly simplify this process. With OpenTelemetry’s robust framework, which offers rich metadata and attribution, metrics, traces, and logs can seamlessly correlate using standardized field names. This automated correlation not only alleviates the burden of manual effort but also enhances the overall observability of the system.

By aligning metrics and logs based on common field names, teams gain deeper insights into system performance, enabling more efficient troubleshooting, proactive monitoring, and optimization of resources. In this workshop section, we’ll explore the importance of correlating metrics with logs and demonstrate how Splunk Observability Cloud empowers teams to unlock additional value from their observability data.

Log Observer Log Observer

Last Modified Jul 23, 2025

Subsections of 4. Correlate Metrics and Logs

Correlate Metrics and Logs

5 minutes   Author Tim Hard

In this section, we’ll dive into the seamless correlation of metrics and logs facilitated by the robust naming standards offered by OpenTelemetry. By harnessing the power of OpenTelemetry within Splunk Observability Cloud, we’ll demonstrate how troubleshooting issues becomes significantly more efficient for Site Reliability Engineers (SREs) and operators. With this integration, contextualizing data across various telemetry sources no longer demands manual effort to correlate information. Instead, SREs and operators gain immediate access to the pertinent context they need, allowing them to swiftly pinpoint and resolve issues, improving system reliability and performance.

Exercise: View pod logs

The Kubernetes Pods Dashboard you created in the previous section already includes a chart that contains all of the pod logs for your Kubernetes Cluster. The log entries are split by container in this stacked bar chart. To view specific log entries perform the following steps:

  1. On the Kubernetes Pods Dashboard click on one of the bar charts. A modal will open with the most recent log entries for the container you’ve selected.

    K8s pod logs K8s pod logs

  2. Click one of the log entries.

    K8s pod log event K8s pod log event

    Here we can see the entire log event with all of the fields and values. You can search for specific field names or values within the event itself using the Search for fields bar in the event.

  3. Enter the city you configured during the application deployment

    K8s pod log field search K8s pod log field search

    The event will now be filtered to the store.location field. This feature is great for exploring large log entries for specific fields and values unique to your environment or to search for keywords like Error or Failure.

  4. Close the event using the X in the upper right corner.

  5. Click the Chart actions (three horizontal dots) on the Pod log event rate chart

  6. Click View in Log Observer

View in Log Observer View in Log Observer

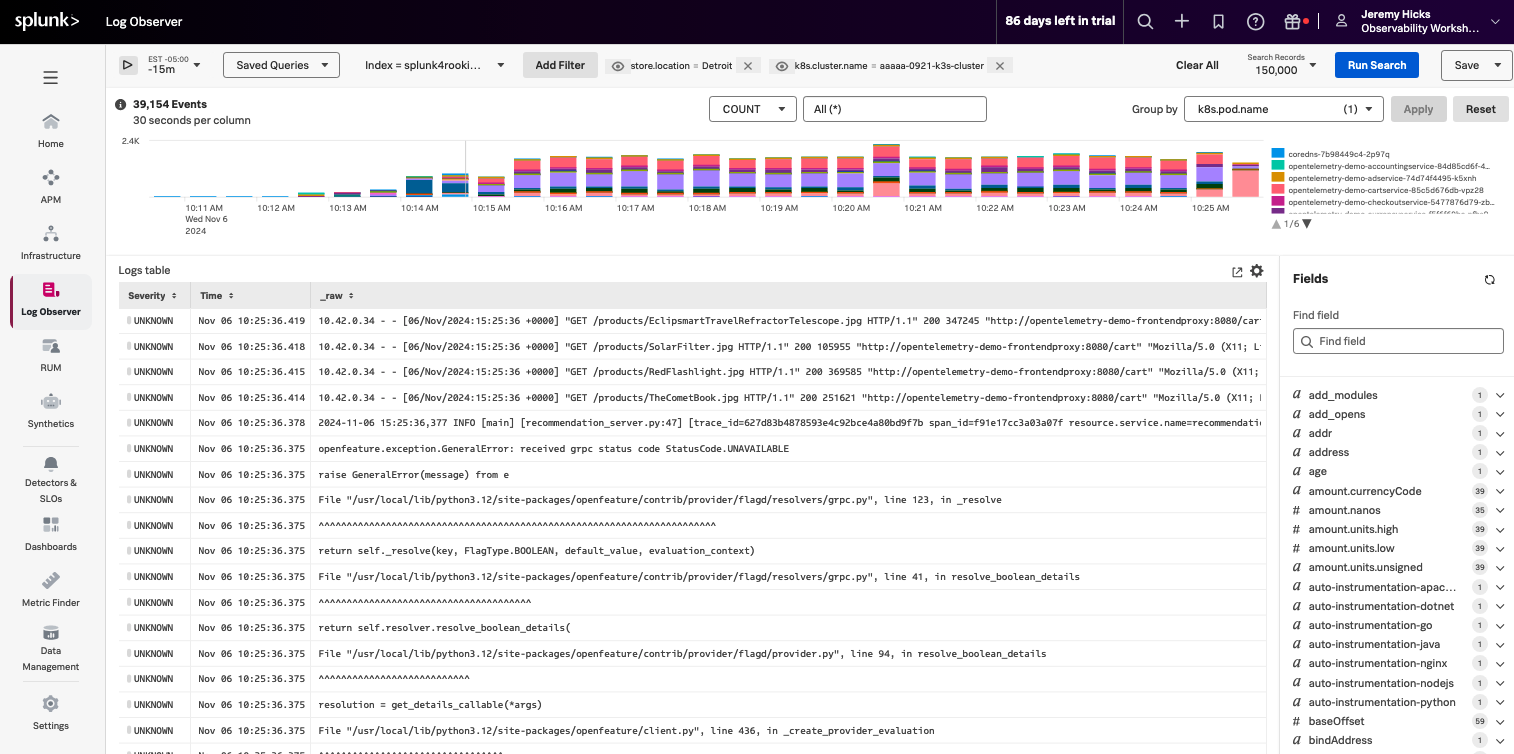
This will take us to Log Observer. In the next section, you’ll create a chart based on log events and add it to the K8s Pod Dashboard you cloned in section 3.2 Dashboard Cloning. You’ll also see how this new chart is automatically added to the mirrored dashboard you created in section 3.3 Dashboard Mirroring.

Last Modified Jul 23, 2025

Create Log-based Chart

5 minutes   Author Tim Hard

In Log Observer, you can perform codeless queries on logs to detect the source of problems in your systems. You can also extract fields from logs to set up log processing rules and transform your data as it arrives or send data to Infinite Logging S3 buckets for future use. See What can I do with Log Observer? to learn more about Log Observer capabilities.

In this section, you’ll create a chart filtered to logs that include errors which will be added to the K8s Pod Dashboard you cloned in section 3.2 Dashboard Cloning.

Exercise: Create Log-based Chart

Because you drilled into Log Observer from the K8s Pod Dashboard in the previous section, the dashboard will already be filtered to your cluster and store location using the k8s.cluster.name and store.location fields and the bar chart is split by k8s.pod.name. To filter the dashboard to only logs that contain errors complete the following steps:

Log Observer can be filtered using Keywords or specific key-value pairs.

  1. In Log Observer click Add Filter along the top.

  2. Make sure you’ve selected Fields as the filter type and enter severity in the Find a field… search bar.

  3. Select severity from the fields list.

    You should now see a list of severities and the number of log entries for each.

  4. Under Top values, hover over Error and click the = button to apply the filter.

    Log Observer: Filter errors Log Observer: Filter errors

    The dashboard will now be filtered to only log entries with a severity of Error and the bar chart will be split by the Kubernetes Pod that contains the errors. Next, you’ll save the chart on your Kubernetes Pods Dashboard.

  5. In the upper right corner of the Log Observer dashboard click Save.

  6. Select Save to Dashboard.

  7. In the Chart name field enter a name for your chart.

  8. (Optional) In the Chart description field enter a description for your chart.

    Log Observer: Save Chart Name Log Observer: Save Chart Name

  9. Click Select Dashboard and search for the name of the Dashboard you cloned in section 3.2 Dashboard Cloning.

  10. Select the dashboard in the Dashboard Group for your email address.

    Log Observer: Select Dashboard Log Observer: Select Dashboard

  11. Click OK

  12. For the Chart type select Log timeline

  13. Click Save and go to the dashboard

You will now be taken to your Kubernetes Pods Dashboard where you should see the chart you just created for pod errors.

Log Errors Chart Log Errors Chart

Because you updated the original Kubernetes Pods Dashboard, your mirrored dashboard will also include this chart as well! You can see this by clicking the mirrored version of your dashboard along the top of the Dashboard Group for your user.

Log Errors Chart Log Errors Chart

Now that you’ve seen how data can be reused across teams by cloning the dashboard, creating dashboard mirrors and how metrics can easily be correlated with logs, let’s take a look at how to create alerts so your teams can be notified when there is an issue with their infrastructure, services, or applications.