1. Splunk Observability Workshops > 
  2. Splunk4Rookies Workshops
Splunk4Rookies Workshops

Observability Cloud

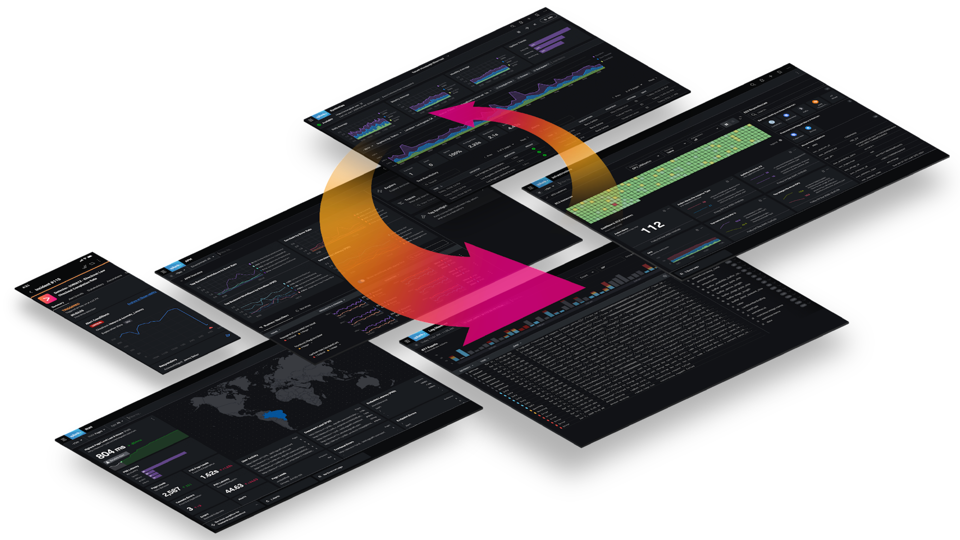
In this workshop, we will be showing how Splunk Observability Cloud provides instant visibility of the user experience – from the perspective of the front-end application to its back-end services – Letting you experience some of the most compelling product features and differentiators of Splunk Observability Cloud.

Financial Services Observability Cloud

This workshop, tailored for the Financial Services sector, will demonstrate how Splunk Observability Cloud delivers real-time insights into user experience, spanning from front-end applications to back-end services. You'll explore key product features and unique advantages that set Splunk Observability Cloud apart.

Last Modified Sep 29, 2025

  • Home


    • Splunk4Rookies Workshops
      • Observability Cloud
        • 1. Workshop Overview
        • 2. OpenTelemetry
        • 3. UI - Quick Tour
          • 1. Getting Started
            • 1.1 Home Page
          • 2. RUM Overview
            • 2.1 RUM Home Page
          • 3. APM Overview
            • 3.1 APM Home Page
          • 4. Log Observer Overview
            • 4.1 Log Observer Home Page
          • 5. Synthetics Overview
            • 5.1 Synthetics Home Page
          • 6. Infrastructure Overview
        • 4. Shopping at the Online Boutique
        • 5. Splunk RUM
          • 1. RUM Dashboard
          • 2. Tag Spotlight
          • 3. Session Replay
          • 4. User Sessions
        • 6. Splunk APM
          • 1. APM Explore
          • 2. APM Service View
          • 3. APM Tag Spotlight
          • 4. APM Service Breakdown
          • 5. APM Trace Analyzer
          • 6. APM Waterfall
        • 7. Splunk Log Observer
          • 1. Log Filtering
          • 2. Viewing Log Entries
          • 3. Log Timeline Chart
          • 4. Log View Chart
        • 8. Splunk Synthetics
          • 1. Synthetics Dashboard
          • 2. Synthetics Test Detail
          • 3. Synthetics to APM
          • 4. Synthetics Detector
        • 9. Service Health Dashboard
          • 1. Enhancing the Dashboard
          • 2. Adding a Custom Chart
        • 10. Workshop Wrap-up
          • 1. Key Takeaways
      • Financial Services Observability Cloud
        • 1. Workshop Overview
        • 2. OpenTelemetry
        • 3. UI - Quick Tour
          • 1. Getting Started
            • 1.1 Home Page
          • 2. APM Overview
            • 2.1 APM Home Page
          • 3. Log Observer Overview
            • 3.1 Log Observer Home Page
          • 4. Infrastructure Overview
        • 4. Splunk APM
          • 1. APM Explore
          • 2. APM Service View
          • 3. APM Tag Spotlight
          • 4. APM Service Breakdown
          • 5. APM Trace Analyzer
          • 6. APM Waterfall
        • 5. Splunk Log Observer
          • 1. Log Filtering
          • 2. Viewing Log Entries
          • 3. Log Timeline Chart
          • 4. Log View Chart
        • 6. Service Health Dashboard
          • 1. Enhancing the Dashboard
          • 2. Adding a Custom Chart
        • 7. Workshop Wrap-up
          • 1. Key Takeaways
    • Splunk4Ninjas Workshops
      • Automatic Discovery Workshops
        • PetClinic Monolith Workshop
          • 1. OpenTelemetry Collector
          • 2. Building PetClinic
          • 3. Automatic Discovery
          • 3. Real User Monitoring
          • 4. Log Observer
        • PetClinic Kubernetes Workshop
          • 1. Architecture
          • 2. Preparation
            • 1. Deploy OpenTelemetry Collector
            • 2. Deploy PetClinic Application
          • 3. Verify Cluster Metrics
          • 4. Automatic discovery and configuration
            • 1. Patching the Deployment
            • 2. Viewing APM Data
          • 5. APM Features
            • 1. APM Service Map
            • 2. APM Trace
            • 3. APM Spans
            • 4. Service Centric View
          • 6. Advanced Features
            • 1. Always-On Profiling
            • 2. Trace Waterfall
            • 3. Database Query Performance
          • 7. Log Observer
            • 1. Viewing the Logs
            • 2. Related Content
          • 8. Real User Monitoring
            • 1. Verify RUM Data
            • 2. Follow RUM Traces
            • 3. RUM Waterfall
          • 9. Workshop Wrap-up
      • Horizontal Pod Autoscaling
        • 1. Deploy the OTel Collector
        • 2. Kubernetes Navigator
        • 3. Deploying PHP/Apache
        • 4. Fix PHP/Apache Issue
        • 5. Deploy Load Generator
        • 6. Setup HPA
      • OpenTelemetry Collector Workshops
        • OpenTelemetry Collector Concepts
          • 1. Installation
            • 1.1 Confirm Installation
          • 2. Extensions
            • 2.1 Health Check
            • 2.2 Performance Profiler
            • 2.3 zPages
          • 3. Receivers
            • 1. Host Metrics
            • 2. Prometheus
            • 3. Other Receivers
          • 4. Processors
            • 4.1 Batch
            • 4.2 Resource Detection
            • 4.3 Attributes
          • 5. Exporters
            • 5.1 OTLP HTTP
          • 6. Service
            • 6.1 Host Metrics
            • 6.2 Prometheus
            • 6.3 Resource Detection
            • 6.4 Attributes
            • 6.5 OTLP HTTP
          • 7. Visualisation
          • 8. Develop
            • 8.1 Project Setup
            • 8.2 Configuration
            • 8.3 Component Review
            • 8.4 Designing the Metrics
            • 8.5 Building Business Logic
        • Advanced OpenTelemetry Collector
          • Pre-requisites
          • 1. Agent Configuration
            • 1.1 Gateway Configuration
            • 1.2 Validate & Test Configuration
          • 2. Building Resilience
            • 2.1 Configuration
            • 2.2 Setup environment
            • 2.3 Simulate Failure
            • 2.4 Recovery
          • 3. Dropping Spans
            • 3.1 Configuration
            • 3.2 Test Filter Processor
          • 4. Sensitive Data
            • 4.1 Configuration
            • 4.2 Test Attribute Processor
            • 4.3 Test Redaction Processor
          • 5. Transform Data
            • 5.1 Configuration
            • 5.2 Setup Environment
            • 5.3 Test Transform Processor
          • 6. Routing Data
            • 6.1 Routing Configuration
            • 6.2 Pipeline Configuration
            • 6.3 Test Routing Connector
          • 7. Count & Sum Connector
            • 7.1 Test Count Connector
            • 7.2 Sum Connector
            • 7.3 Test Sum Connector
          • 8. Wrap-up
      • Splunk Synthetic Scripting
        • 1. Real Browser Test
          • 1.1 Recording a test
          • 1.2 Create Real Browser Test
          • 1.3 Import JSON
          • 1.4 Settings
          • 1.5 Advanced Settings
          • 1.6 Edit test steps
          • 1.7 View test results
        • 2. API Test
          • 1.1 Global Variables
          • 1.2 Create new API test
          • 1.3 Authentication Request
          • 1.4 Search Request
          • 1.5 View Results
      • Lambda Tracing
        • 1. Setup
        • 2. Auto-Instrumentation
        • 3. Lambda Traces in Splunk APM
        • 4. Manual Instrumentation
        • 5. Redeploying Lambda Functions
        • 6. Updated Lambdas in Splunk APM
        • 7. Conclusion
      • Dashboard Workshop
        • 1. Dashboards
          • 1.01. Sample Data
          • 1.02. Exploring Charts
          • 1.04. Editing Charts
          • 1.04. Saving Charts
          • 1.05. Create New Chart
          • 1.06. Filters & Analytics
          • 1.07. TimeShift & Formula's
          • 1.08. Signalflow
          • 1.09. Adding more charts
          • 1.10 Notes and layout
      • Hands-On OpenTelemetry, Docker, and K8s
        • 1. Connect to EC2 Instance
        • 2. Deploy the OpenTelemetry Collector
        • 3. Deploy a .NET Application
        • 4. Instrument a .NET Application with OpenTelemetry
        • 5. Dockerize the Application
        • 6. Add Instrumentation to Dockerfile
        • 7. Install the OpenTelemetry Collector in K8s
        • 8. Deploy Application to K8s
        • 9. Customize the OpenTelemetry Collector Configuration
        • 10. Troubleshoot OpenTelemetry Collector Issues
        • 11. Summary
      • Solving Problems with O11y Cloud
        • 1. Connect to EC2 Instance
        • 2. Deploy the OpenTelemetry Collector and Customize Config
        • 3. Deploy the Sample Application and Instrument with OpenTelemetry
        • 4. Create a Troubleshooting MetricSet
        • 5. Troubleshoot a Problem Using Tag Spotlight
        • 6. Summary
      • Ingest Processor for Observability Cloud
        • 1. Getting Started
          • 1.1 How to connect to your workshop environment
        • 2. How Ingest Processor Works
        • 3. Create an Ingest Pipeline
          • 3.1 Login to Splunk Cloud
          • 3.2 Review Kubernetes Audit Logs
          • 3.3 Create an Ingest Pipeline
          • 3.4 Confirm Metrics in Observability Cloud
        • 4. Update Pipeline and Visualize Metrics
          • 4.1 Update Ingest Pipeline
          • 4.2 Visualize Kubernetes Audit Event Metrics
        • 5. Conclusion
    • Scenarios
      • Optimize Cloud Monitoring
        • 1. Getting Started
          • 1.1 Access AWS/EC2 Instance
          • 1.2 Deploy OpenTelemetry Demo Application
        • 2. Standardize Data Collection
          • 2.1 What Are Tags?
          • 2.2 Adding Context With Tags
        • 3. Reuse Content Across Teams
          • 3.1 Infrastructure Navigators
          • 3.2 Dashboard Cloning
          • 3.3 Dashboard Mirroring
        • 4. Correlate Metrics and Logs
          • 4.1 Correlate Metrics and Logs
          • 4.2 Create Log-based Chart
        • 5. Improve Timeliness of Alerts
          • 5.1 Create Custom Detector
        • 6. Conclusion
      • Debug Problems in Microservices
        • Tagging Workshop
          • 1. Build the Sample Application
          • 2. What are Tags?
          • 3. Capture Tags with OpenTelemetry
            • 1. Capture Tags - Java
            • 2. Capture Tags - Python
          • 4. Explore Trace Data
          • 5. Index Tags
          • 6. Use Tags for Troubleshooting
          • 7. Use Tags for Monitoring
            • 1. ...with Dashboards
            • 2. ...with Alerting
            • 3. ...with SLOs
          • 8. Summary
        • Profiling Workshop
          • 1 Build the Sample Application
          • 2 Troubleshoot Game Startup
          • 3 Enable AlwaysOn Profiling
          • 4 Fix Application Startup Slowness
          • 5 Fix In Game Slowness
          • 6 Summary
      • Optimize End User Experiences
        • Synthetics
          • 1. Uptime Test
            • 1.1 Creating a test
            • 1.2 Understanding results
          • 2. API Test
            • 2.1 Global Variables
            • 2.2 Create new API test
            • 2.3 Authentication Request
            • 2.4 Search Request
            • 2.5 View Results
          • 3. Browser Test
        • RUM
          • 1. Overview
          • 2. RUM instrumentation
          • 3. RUM Landing Page
          • 4. Browser Application Summary
          • 5. Analyzing RUM Metrics
          • 6. Using Tag Spotlight
          • 7. Analyzing RUM Sessions
        • Advanced Synthetics
          • 1. Record a test
          • 2. Create a Browser Test
          • 3. Import JSON
          • 4. Settings
          • 5. Advanced Settings
          • 6. Edit test steps
          • 7. View test results
        • Frontend Dashboards
          • 1. Copying and editing charts
          • 2. Event overlay
        • Detectors
          • 1. Test Detectors
          • 2. RUM Detectors
          • 3. Chart Detectors
        • Summary
    • Resources
      • Dimension, Properties and Tags
      • OpenTelemetry Tagging
      • SPLUNK ARCADE - PLAY. LEARN. OBSERVE!
      • Local Hosting
        • Local Hosting with Multipass
        • Local Hosting with OrbStack
        • Local Hosting with Proxmox
        • Running Demo-in-a-Box
    • Unsupported Field Workshops
      • Splunk IM
        • 1. Access AWS/EC2 Instance
        • 2. Get Data In
          • 2.1 Deploy NGINX
        • 3. Dashboards
          • 3.1 Editing charts
          • 3.2 Saving charts
          • 3.3 Using Filters & Formulas
          • 3.4 SignalFlow
          • 3.5 Adding more charts
          • 3.6 Notes and layout
        • 4. Detectors
          • 4.1 Creating a Muting Rule
        • 5. Monitoring as Code
        • 6. Service Bureau
          • 6.1 Teams
          • 6.2 Control Usage
      • NodeJS Zero-Config Workshop
        • 1. Deploy OpenTelemetry Demo
        • 2. Installing the Collector
        • 3. Frontend Service
        • 4. Payment Service
        • 5. Code Profiling
        • 6. Logs
      • GDI (OTel & UF)
        • 1. Getting Started
        • 2. Deployment
        • 3. Code to Kubernetes
        • 4. Instrumentation
        • 5. UF Deployment
      • Splunk OnCall
        • 1. Getting Started
          • 1.1 Teams
          • 1.2 Rotations
          • 1.3 Escalation Policies
          • 1.4 Routing Keys
        • 2. Incident Lifecycle
          • 2.1 Create Incidents
          • 2.2 Manage Incidents
    More
    • GitHub Repository
    • OpenTelemetry
    • Twitter

    •  
    •  
    •  

    © 2005 - 2025 Splunk Inc. All rights reserved.