Deploy the OpenTelemetry Collector
10 minutesNow that our OpenShift cluster is up and running, let’s deploy the OpenTelemetry Collector, which gathers metrics, logs, and traces from the infrastructure and applications running in the cluster, and sends the resulting data to Splunk Observability Cloud.
Deploy the OpenTelemetry Collector
First, we’ll create a new project for the collector and switch to that project:
oc new-project otel Ensure Helm is installed:
sudo apt-get install curl gpg apt-transport-https --yes
curl -fsSL https://packages.buildkite.com/helm-linux/helm-debian/gpgkey | gpg --dearmor | sudo tee /usr/share/keyrings/helm.gpg > /dev/null
echo "deb [signed-by=/usr/share/keyrings/helm.gpg] https://packages.buildkite.com/helm-linux/helm-debian/any/ any main" | sudo tee /etc/apt/sources.list.d/helm-stable-debian.list
sudo apt-get update
sudo apt-get install helm
Add the Splunk OpenTelemetry Collector for Kubernetes’ Helm chart repository:
helm repo add splunk-otel-collector-chart https://signalfx.github.io/splunk-otel-collector-chartEnsure the repository is up-to-date:
helm repo updateReview the file named ./otel-collector/otel-collector-values.yaml as we’ll be using it
to install the OpenTelemetry collector.
Set environment variables to configure the Splunk environment you’d like the collector to send data to:
export ENVIRONMENT_NAME=<which environment to send data to for Splunk Observability Cloud>
export SPLUNK_ACCESS_TOKEN=<your access token for Splunk Observability Cloud>
export SPLUNK_REALM=<your realm for Splunk Observability Cloud i.e. us0, us1, eu0, etc.>
export SPLUNK_HEC_URL=<HEC endpoint to send logs to Splunk platform i.e. https://<hostname>:443/services/collector/event>
export SPLUNK_HEC_TOKEN=<HEC token to send logs to Splunk platform>
export SPLUNK_INDEX=<name of index to send logs to in Splunk platform>
Then install the collector using the following command:
helm install splunk-otel-collector \
  --set="clusterName=$CLUSTER_NAME" \
  --set="environment=$ENVIRONMENT_NAME" \
  --set="splunkObservability.accessToken=$SPLUNK_ACCESS_TOKEN" \
  --set="splunkObservability.realm=$SPLUNK_REALM" \
  --set="splunkPlatform.endpoint=$SPLUNK_HEC_URL" \
  --set="splunkPlatform.token=$SPLUNK_HEC_TOKEN" \
  --set="splunkPlatform.index=$SPLUNK_INDEX" \
  -f ./otel-collector/otel-collector-values.yaml \
  -n otel \
  splunk-otel-collector-chart/splunk-otel-collector
Run the following command to confirm that all of the collector pods are running:
oc get pods
NAME READY STATUS RESTARTS AGE
splunk-otel-collector-agent-58rwm 1/1 Running 0 6m40s
splunk-otel-collector-agent-8dndr 1/1 Running 0 6m40s
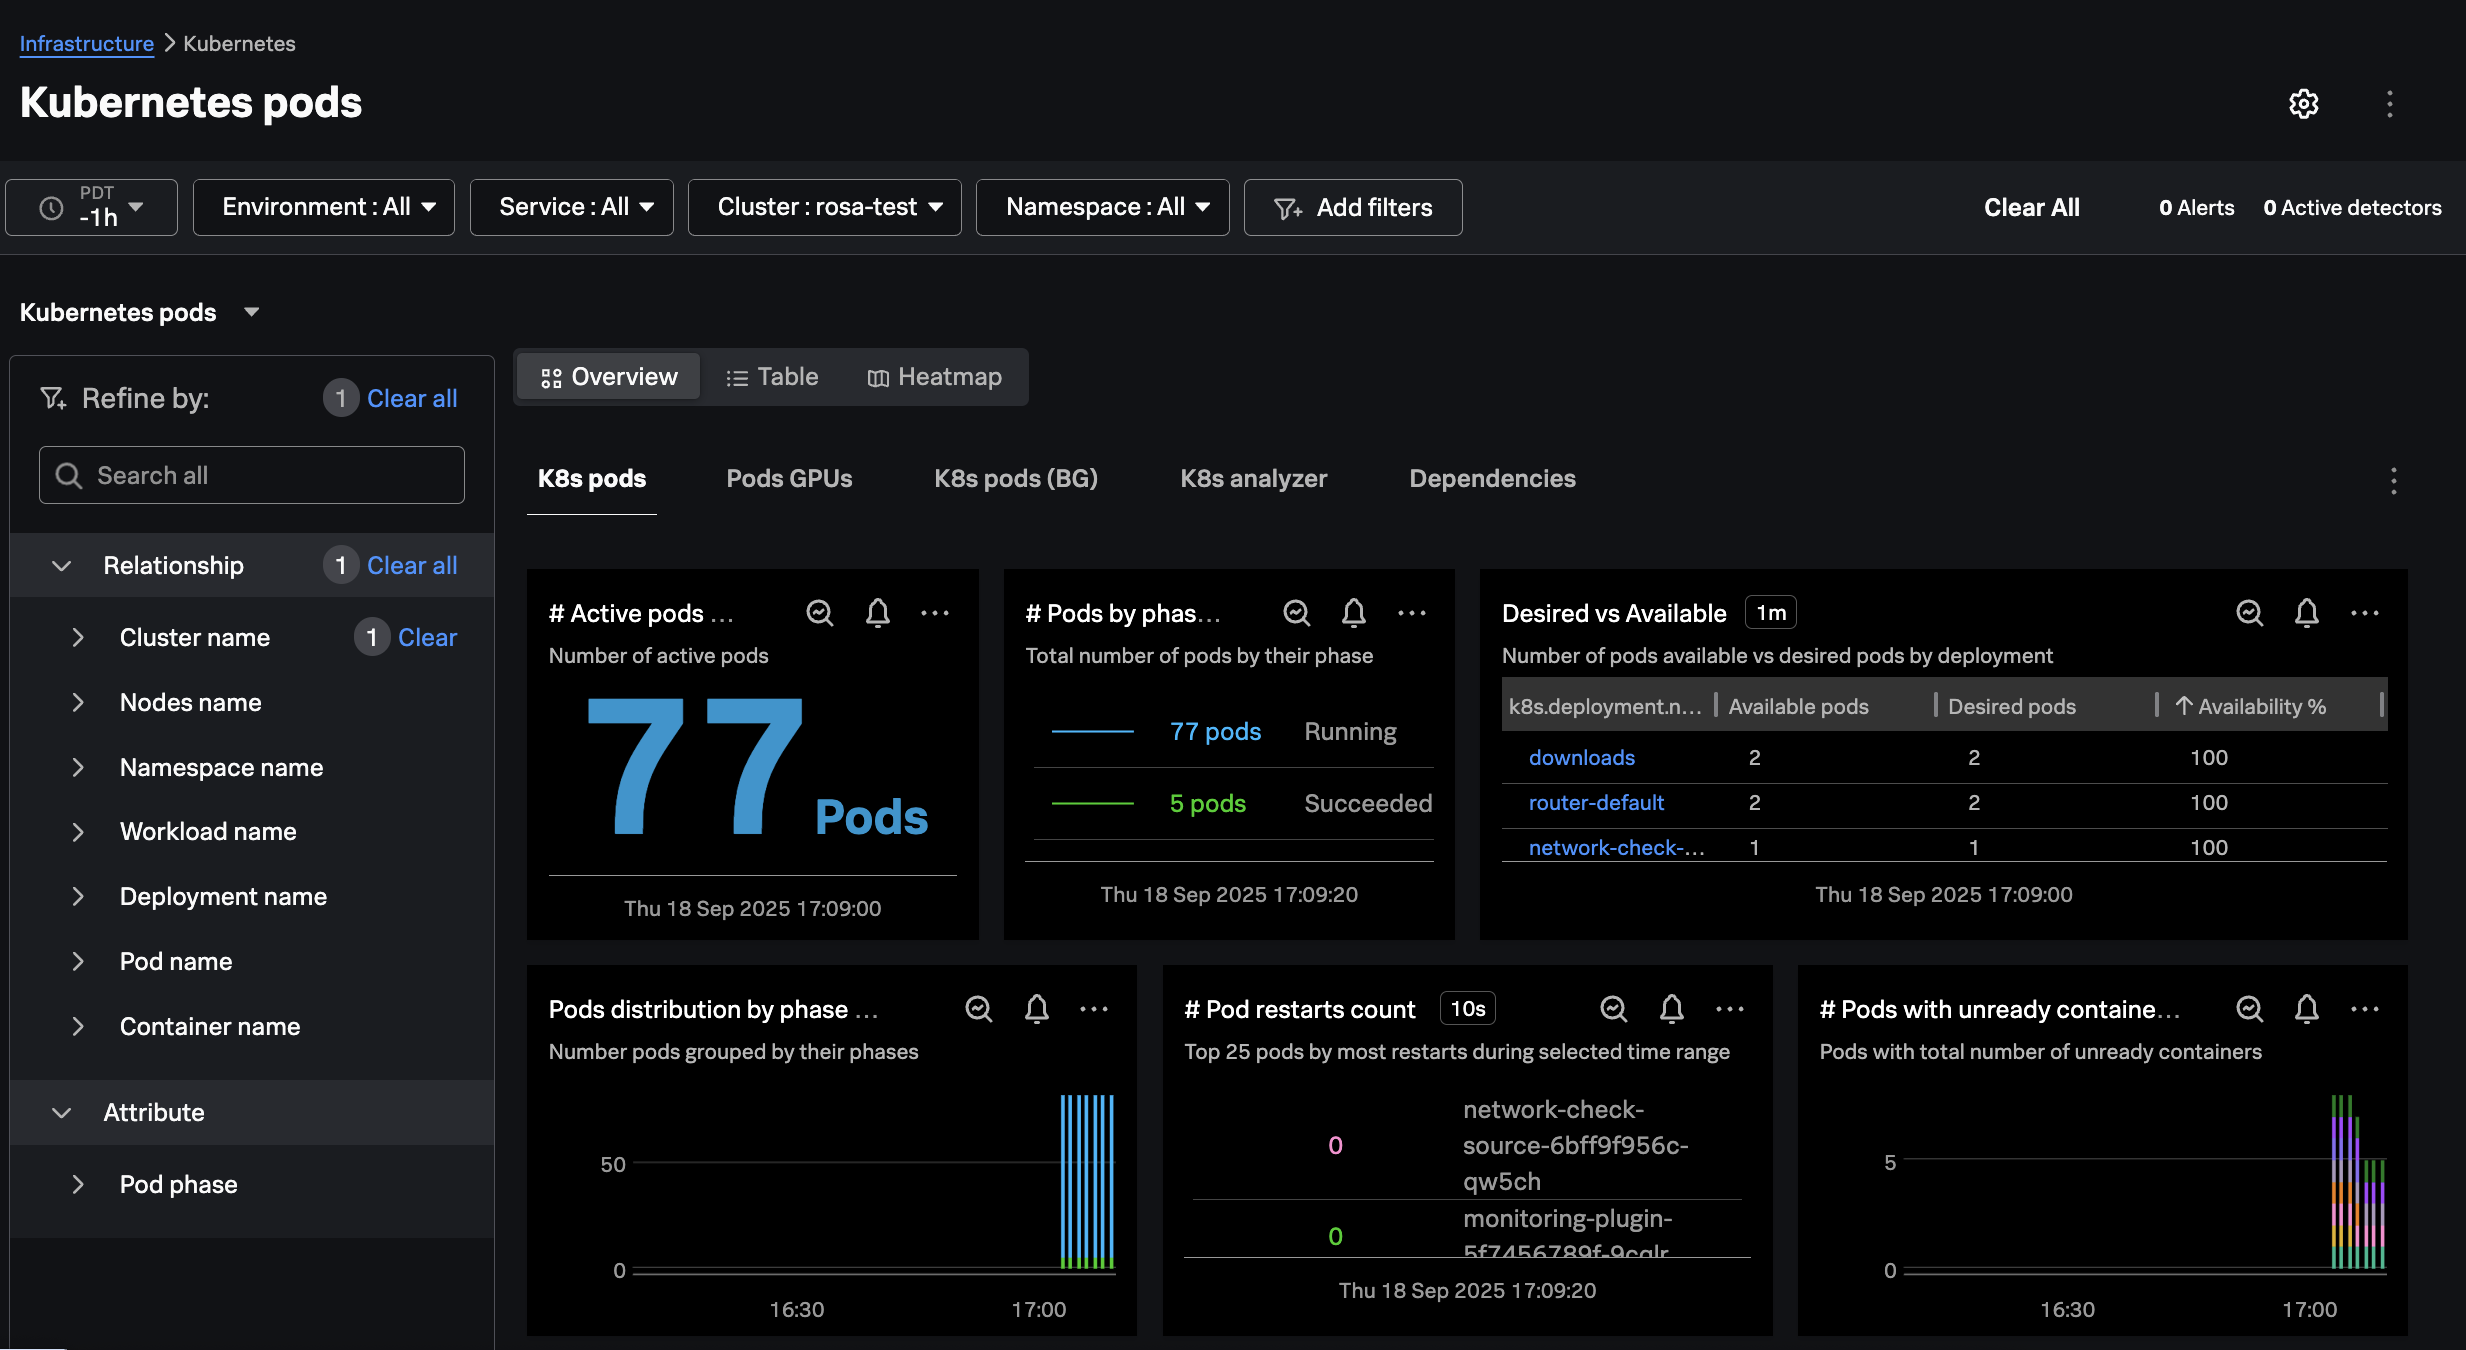
splunk-otel-collector-k8s-cluster-receiver-7b7f5cdc5b-rhxsj 1/1 Running 0 6m40sConfirm that you can see the cluster in Splunk Observability Cloud by navigating to Infrastructure Monitoring -> Kubernetes -> Kubernetes Pods and then filtering on your cluster name: