Configure the Prometheus Receiver
10 minutesNow that our LLM is up and running, we’ll add the Prometheus receiver to our OpenTelemetry collector to gather metrics from it.
Capture the NVIDIA DCGM Exporter metrics
The NVIDIA DCGM exporter is running in our OpenShift cluster. It exposes GPU metrics that we can send to Splunk.
To do this, let’s customize the configuration of the collector by editing the
otel-collector-values.yaml file that we used earlier when deploying the collector.
Add the following content, just below the kubeletstats section:
      receiver_creator/nvidia:
        # Name of the extensions to watch for endpoints to start and stop.
        watch_observers: [ k8s_observer ]
        receivers:
          prometheus/dcgm:
            config:
              config:
                scrape_configs:
                  - job_name: gpu-metrics
                    scrape_interval: 10s
                    static_configs:
                      - targets:
                          - '`endpoint`:9400'
            rule: type == "pod" && labels["app"] == "nvidia-dcgm-exporter"
This tells the collector to look for pods with a label of app=nvidia-dcgm-exporter.
And when it finds a pod with this label, scrape the /v1/metrics endpoint using port 9400.
To ensure the receiver is used, we’ll need to add a new pipeline to the otel-collector-values.yaml file
as well.
Add the following code to the bottom of the file:
    service:
      pipelines:
        metrics/nvidia-metrics:
          exporters:
            - signalfx
          processors:
            - memory_limiter
            - batch
            - resourcedetection
            - resource
          receivers:
            - receiver_creator/nvidia
Before applying the changes, let’s add one more Prometheus receiver in the next section.
Capture the NVIDIA NIM metrics
The meta-llama-3-2-1b-instruct LLM that we just deployed with NVIDIA NIM also
includes a Prometheus endpoint that we can scrape with the collector. Let’s add the
following to the otel-collector-values.yaml file, just below the receiver we added earlier:
          prometheus/nim-llm:
            config:
              config:
                scrape_configs:
                  - job_name: nim-for-llm-metrics
                    scrape_interval: 10s
                    metrics_path: /v1/metrics
                    static_configs:
                      - targets:
                          - '`endpoint`:8000'
            rule: type == "pod" && labels["app"] == "meta-llama-3-2-1b-instruct"
This tells the collector to look for pods with a label of app=meta-llama-3-2-1b-instruct.
And when it finds a pod with this label, scrape the /v1/metrics endpoint using port 8000.
There’s no need to make changes to the pipeline, as this receiver will already be picked up
as part of the receiver_creator/nvidia receiver.
Add a Filter Processor
Prometheus endpoints can expose a large number of metrics, sometimes with high cardinality.
Let’s add a filter processor that defines exactly what metrics we want to send to Splunk. Specifically, we’ll send only the metrics that are utilized by a dashboard chart or an alert detector.
Add the following code to the otel-collector-values.yaml file, after the exporters section
but before the receivers section:
    processors:
      filter/metrics_to_be_included:
        metrics:
          # Include only metrics used in charts and detectors
          include:
            match_type: strict
            metric_names:
              - DCGM_FI_DEV_FB_FREE
              - DCGM_FI_DEV_FB_USED
              - DCGM_FI_DEV_GPU_TEMP
              - DCGM_FI_DEV_GPU_UTIL
              - DCGM_FI_DEV_MEM_CLOCK
              - DCGM_FI_DEV_MEM_COPY_UTIL
              - DCGM_FI_DEV_MEMORY_TEMP
              - DCGM_FI_DEV_POWER_USAGE
              - DCGM_FI_DEV_SM_CLOCK
              - DCGM_FI_DEV_TOTAL_ENERGY_CONSUMPTION
              - DCGM_FI_PROF_DRAM_ACTIVE
              - DCGM_FI_PROF_GR_ENGINE_ACTIVE
              - DCGM_FI_PROF_PCIE_RX_BYTES
              - DCGM_FI_PROF_PCIE_TX_BYTES
              - DCGM_FI_PROF_PIPE_TENSOR_ACTIVE
              - generation_tokens_total
              - go_info
              - go_memstats_alloc_bytes
              - go_memstats_alloc_bytes_total
              - go_memstats_buck_hash_sys_bytes
              - go_memstats_frees_total
              - go_memstats_gc_sys_bytes
              - go_memstats_heap_alloc_bytes
              - go_memstats_heap_idle_bytes
              - go_memstats_heap_inuse_bytes
              - go_memstats_heap_objects
              - go_memstats_heap_released_bytes
              - go_memstats_heap_sys_bytes
              - go_memstats_last_gc_time_seconds
              - go_memstats_lookups_total
              - go_memstats_mallocs_total
              - go_memstats_mcache_inuse_bytes
              - go_memstats_mcache_sys_bytes
              - go_memstats_mspan_inuse_bytes
              - go_memstats_mspan_sys_bytes
              - go_memstats_next_gc_bytes
              - go_memstats_other_sys_bytes
              - go_memstats_stack_inuse_bytes
              - go_memstats_stack_sys_bytes
              - go_memstats_sys_bytes
              - go_sched_gomaxprocs_threads
              - gpu_cache_usage_perc
              - gpu_total_energy_consumption_joules
              - http.server.active_requests
              - num_request_max
              - num_requests_running
              - num_requests_waiting
              - process_cpu_seconds_total
              - process_max_fds
              - process_open_fds
              - process_resident_memory_bytes
              - process_start_time_seconds
              - process_virtual_memory_bytes
              - process_virtual_memory_max_bytes
              - promhttp_metric_handler_requests_in_flight
              - promhttp_metric_handler_requests_total
              - prompt_tokens_total
              - python_gc_collections_total
              - python_gc_objects_collected_total
              - python_gc_objects_uncollectable_total
              - python_info
              - request_finish_total
              - request_success_total
              - system.cpu.time
              - e2e_request_latency_seconds
              - time_to_first_token_seconds
              - time_per_output_token_seconds
              - request_prompt_tokens
              - request_generation_tokens
Ensure this processor is included in the pipeline we added earlier to the bottom of the file:
    service:
      pipelines:
        metrics/nvidia-metrics:
          exporters:
            - signalfx
          processors:
            - memory_limiter
            - filter/metrics_to_be_included
            - batch
            - resourcedetection
            - resource
          receivers:
            - receiver_creator/nvidia
Verify Changes
Before applying the configuration changes to the collector, take a moment to compare the
contents of your modified otel-collector-values.yaml file with the otel-collector-values-with-nvidia.yaml file.
Update your file as needed to ensure the contents match. Remember that indentation is important
for yaml files, and needs to be precise.
Update the OpenTelemetry Collector Config
Now we can update the OpenTelemetry collector configuration by running the following Helm command:
helm upgrade splunk-otel-collector \
  --set="clusterName=$CLUSTER_NAME" \
  --set="environment=$ENVIRONMENT_NAME" \
  --set="splunkObservability.accessToken=$SPLUNK_ACCESS_TOKEN" \
  --set="splunkObservability.realm=$SPLUNK_REALM" \
  --set="splunkPlatform.endpoint=$SPLUNK_HEC_URL" \
  --set="splunkPlatform.token=$SPLUNK_HEC_TOKEN" \
  --set="splunkPlatform.index=$SPLUNK_INDEX" \
  -f ./otel-collector/otel-collector-values.yaml \
  -n otel \
  splunk-otel-collector-chart/splunk-otel-collector
Confirm Metrics are Sent to Splunk
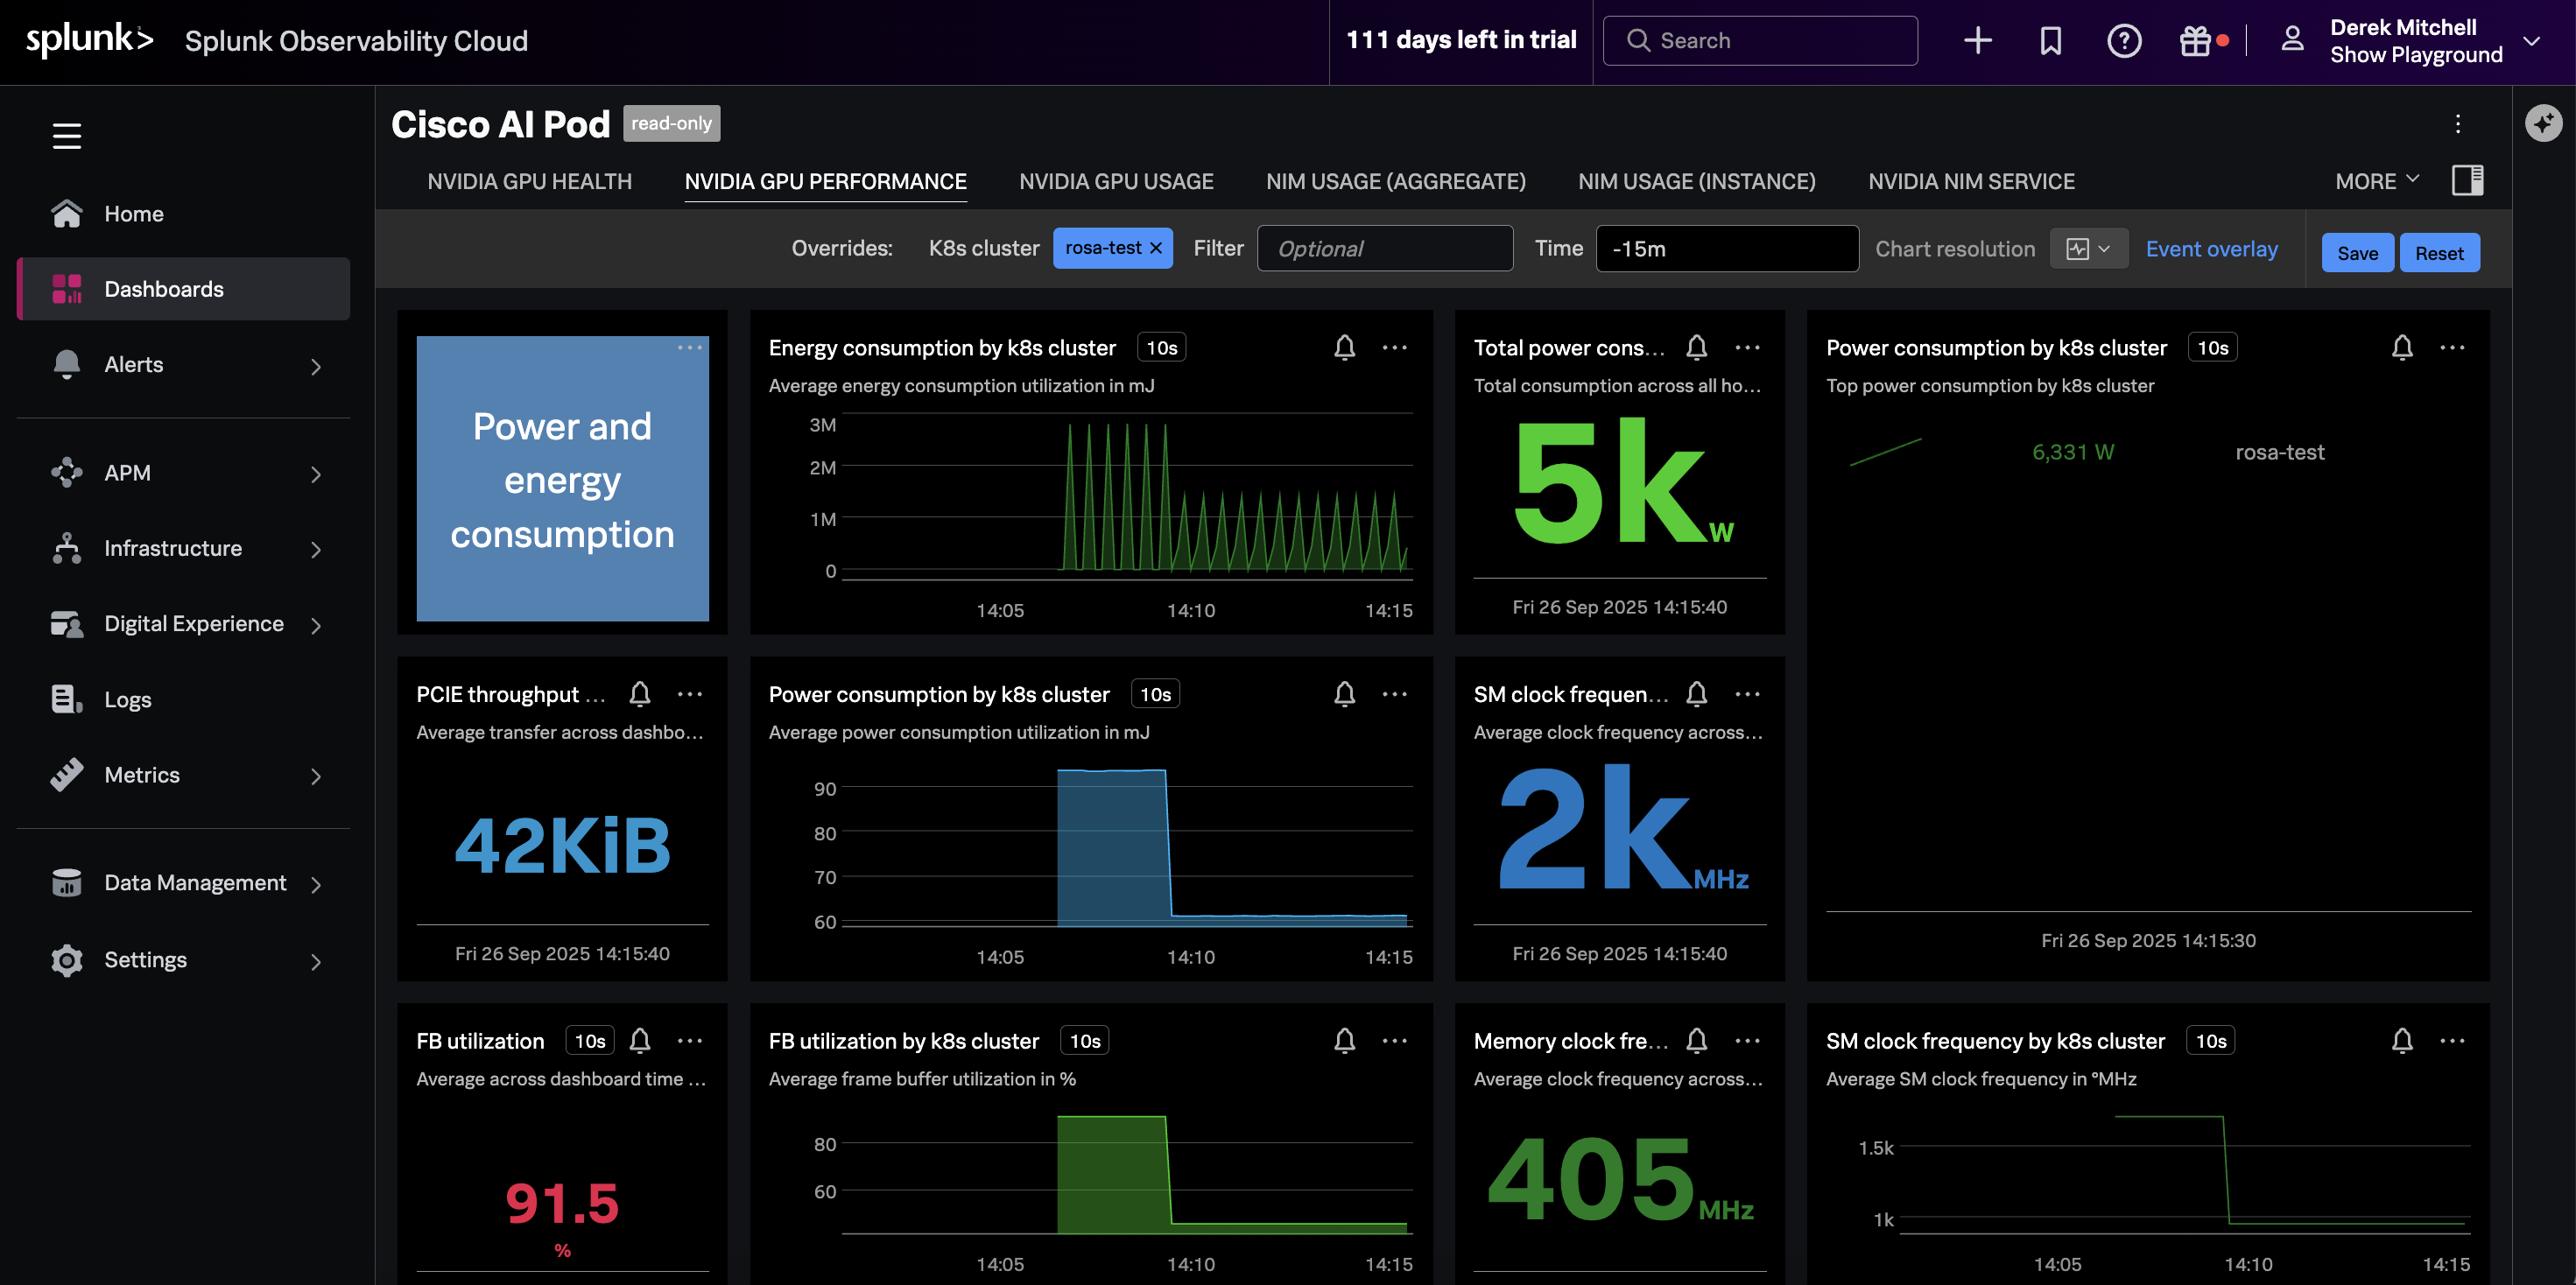
Navigate to the Cisco AI Pod dashboard in Splunk Observability Cloud. Ensure it’s filtered on your OpenShift cluster name, and that the charts are populated as in the following example: