Deploy the Vector Database
10 minutesIn this step, we’ll deploy a vector database to the OpenShift cluster and populate it with test data.
What is a Vector Database?
A vector database stores and indexes data as numerical “vector embeddings,” which capture the semantic meaning of information like text or images. Unlike traditional databases, they excel at similarity searches, finding conceptually related data points rather than exact matches.
How is a Vector Database Used?
Vector databases play a key role in a pattern called Retrieval Augmented Generation (RAG), which is widely used by applications that leverage Large Language Models (LLMs).
The pattern is as follows:
- The end-user asks a question to the application
- The application takes the question and calculates a vector embedding for it
- The app then performs a similarity search, looking for related documents in the vector database
- The app then takes the original question and the related documents, and sends it to the LLM as context
- The LLM reviews the context and returns a response to the application
Deploy a Vector Database
For the workshop, we’ll deploy an open-source vector database named Weaviate.
First, add the Weaviate helm repo that contains the Weaviate helm chart:
helm repo add weaviate https://weaviate.github.io/weaviate-helm
helm repo update
The weaviate/weaviate-values.yaml file includes the configuration we’ll use to deploy
the Weviate vector database.
We’ve set the following environment variables to TRUE, to ensure Weaviate exposes
metrics that we can scrape later with the Prometheus receiver:
  PROMETHEUS_MONITORING_ENABLED: true
  PROMETHEUS_MONITORING_GROUP: true
Review Weaviate documentation to explore additional customization options available.
Let’s create a new namespace:
oc create namespace weaviateRun the following command to allow Weaviate to run a privileged container:
Note: this approach is not recommended for production environments
oc adm policy add-scc-to-user privileged -z default -n weaviateThen deploy Weaviate:
helm upgrade --install \
  "weaviate" \
  weaviate/weaviate \
  --namespace "weaviate" \
  --values ./weaviate/weaviate-values.yaml
Capture Weaviate Metrics with Prometheus
Now that Weaviate is installed in our OpenShift cluster, let’s modify the OpenTelemetry collector configuration to scrape Weaviate’s Prometheus metrics.
To do so, let’s add an additional Prometheus receiver creator section
to the otel-collector-values.yaml file:
      receiver_creator/weaviate:
        # Name of the extensions to watch for endpoints to start and stop.
        watch_observers: [ k8s_observer ]
        receivers:
          prometheus/weaviate:
            config:
              config:
                scrape_configs:
                  - job_name: weaviate-metrics
                    scrape_interval: 10s
                    static_configs:
                      - targets:
                          - '`endpoint`:2112'
            rule: type == "pod" && labels["app"] == "weaviate"
We’ll need to ensure that Weaviate’s metrics are added to the filter/metrics_to_be_included filter
processor configuration as well:
    processors:
      filter/metrics_to_be_included:
        metrics:
          # Include only metrics used in charts and detectors
          include:
            match_type: strict
            metric_names:
              - DCGM_FI_DEV_FB_FREE
              - ...
              - object_count
              - vector_index_size
              - vector_index_operations
              - vector_index_tombstones
              - vector_index_tombstone_cleanup_threads
              - vector_index_tombstone_cleanup_threads
              - requests_total
              - objects_durations_ms_sum
              - objects_durations_ms_count
              - batch_delete_durations_ms_sum
              - batch_delete_durations_ms_count
We also want to add a Resource processor to the configuration file, with the following configuration:
      resource/weaviate:
        attributes:
          - key: weaviate.instance.id
            from_attribute: service.instance.id
            action: insert
This processor takes the service.instance.id property on the Weaviate metrics
and copies it into a new property called weaviate.instance.id. This is done so
that we can more easily distinguish Weaviate metrics from other metrics that use
service.instance.id, which is a standard OpenTelemetry property used in
Splunk Observability Cloud.
We’ll need to add a new metrics pipeline for Weaviate metrics as well (we
need to use a separate pipeline since we don’t want the weaviate.instance.id
metric to be added to non-Weaviate metrics):
        metrics/weaviate:
          exporters:
            - signalfx
          processors:
            - memory_limiter
            - filter/metrics_to_be_included
            - resource/weaviate
            - batch
            - resourcedetection
            - resource
          receivers:
            - receiver_creator/weaviate
Before applying the configuration changes to the collector, take a moment to compare the
contents of your modified otel-collector-values.yaml file with the
otel-collector-values-with-weaviate.yaml file.
Update your file as needed to ensure the contents match. Remember that indentation is important
for yaml files, and needs to be precise.
Now we can update the OpenTelemetry collector configuration by running the following Helm command:
helm upgrade splunk-otel-collector \
--set="clusterName=$CLUSTER_NAME" \
--set="environment=$ENVIRONMENT_NAME" \
--set="splunkObservability.accessToken=$SPLUNK_ACCESS_TOKEN" \
--set="splunkObservability.realm=$SPLUNK_REALM" \
--set="splunkPlatform.endpoint=$SPLUNK_HEC_URL" \
--set="splunkPlatform.token=$SPLUNK_HEC_TOKEN" \
--set="splunkPlatform.index=$SPLUNK_INDEX" \
-f ./otel-collector/otel-collector-values.yaml \
-n otel \
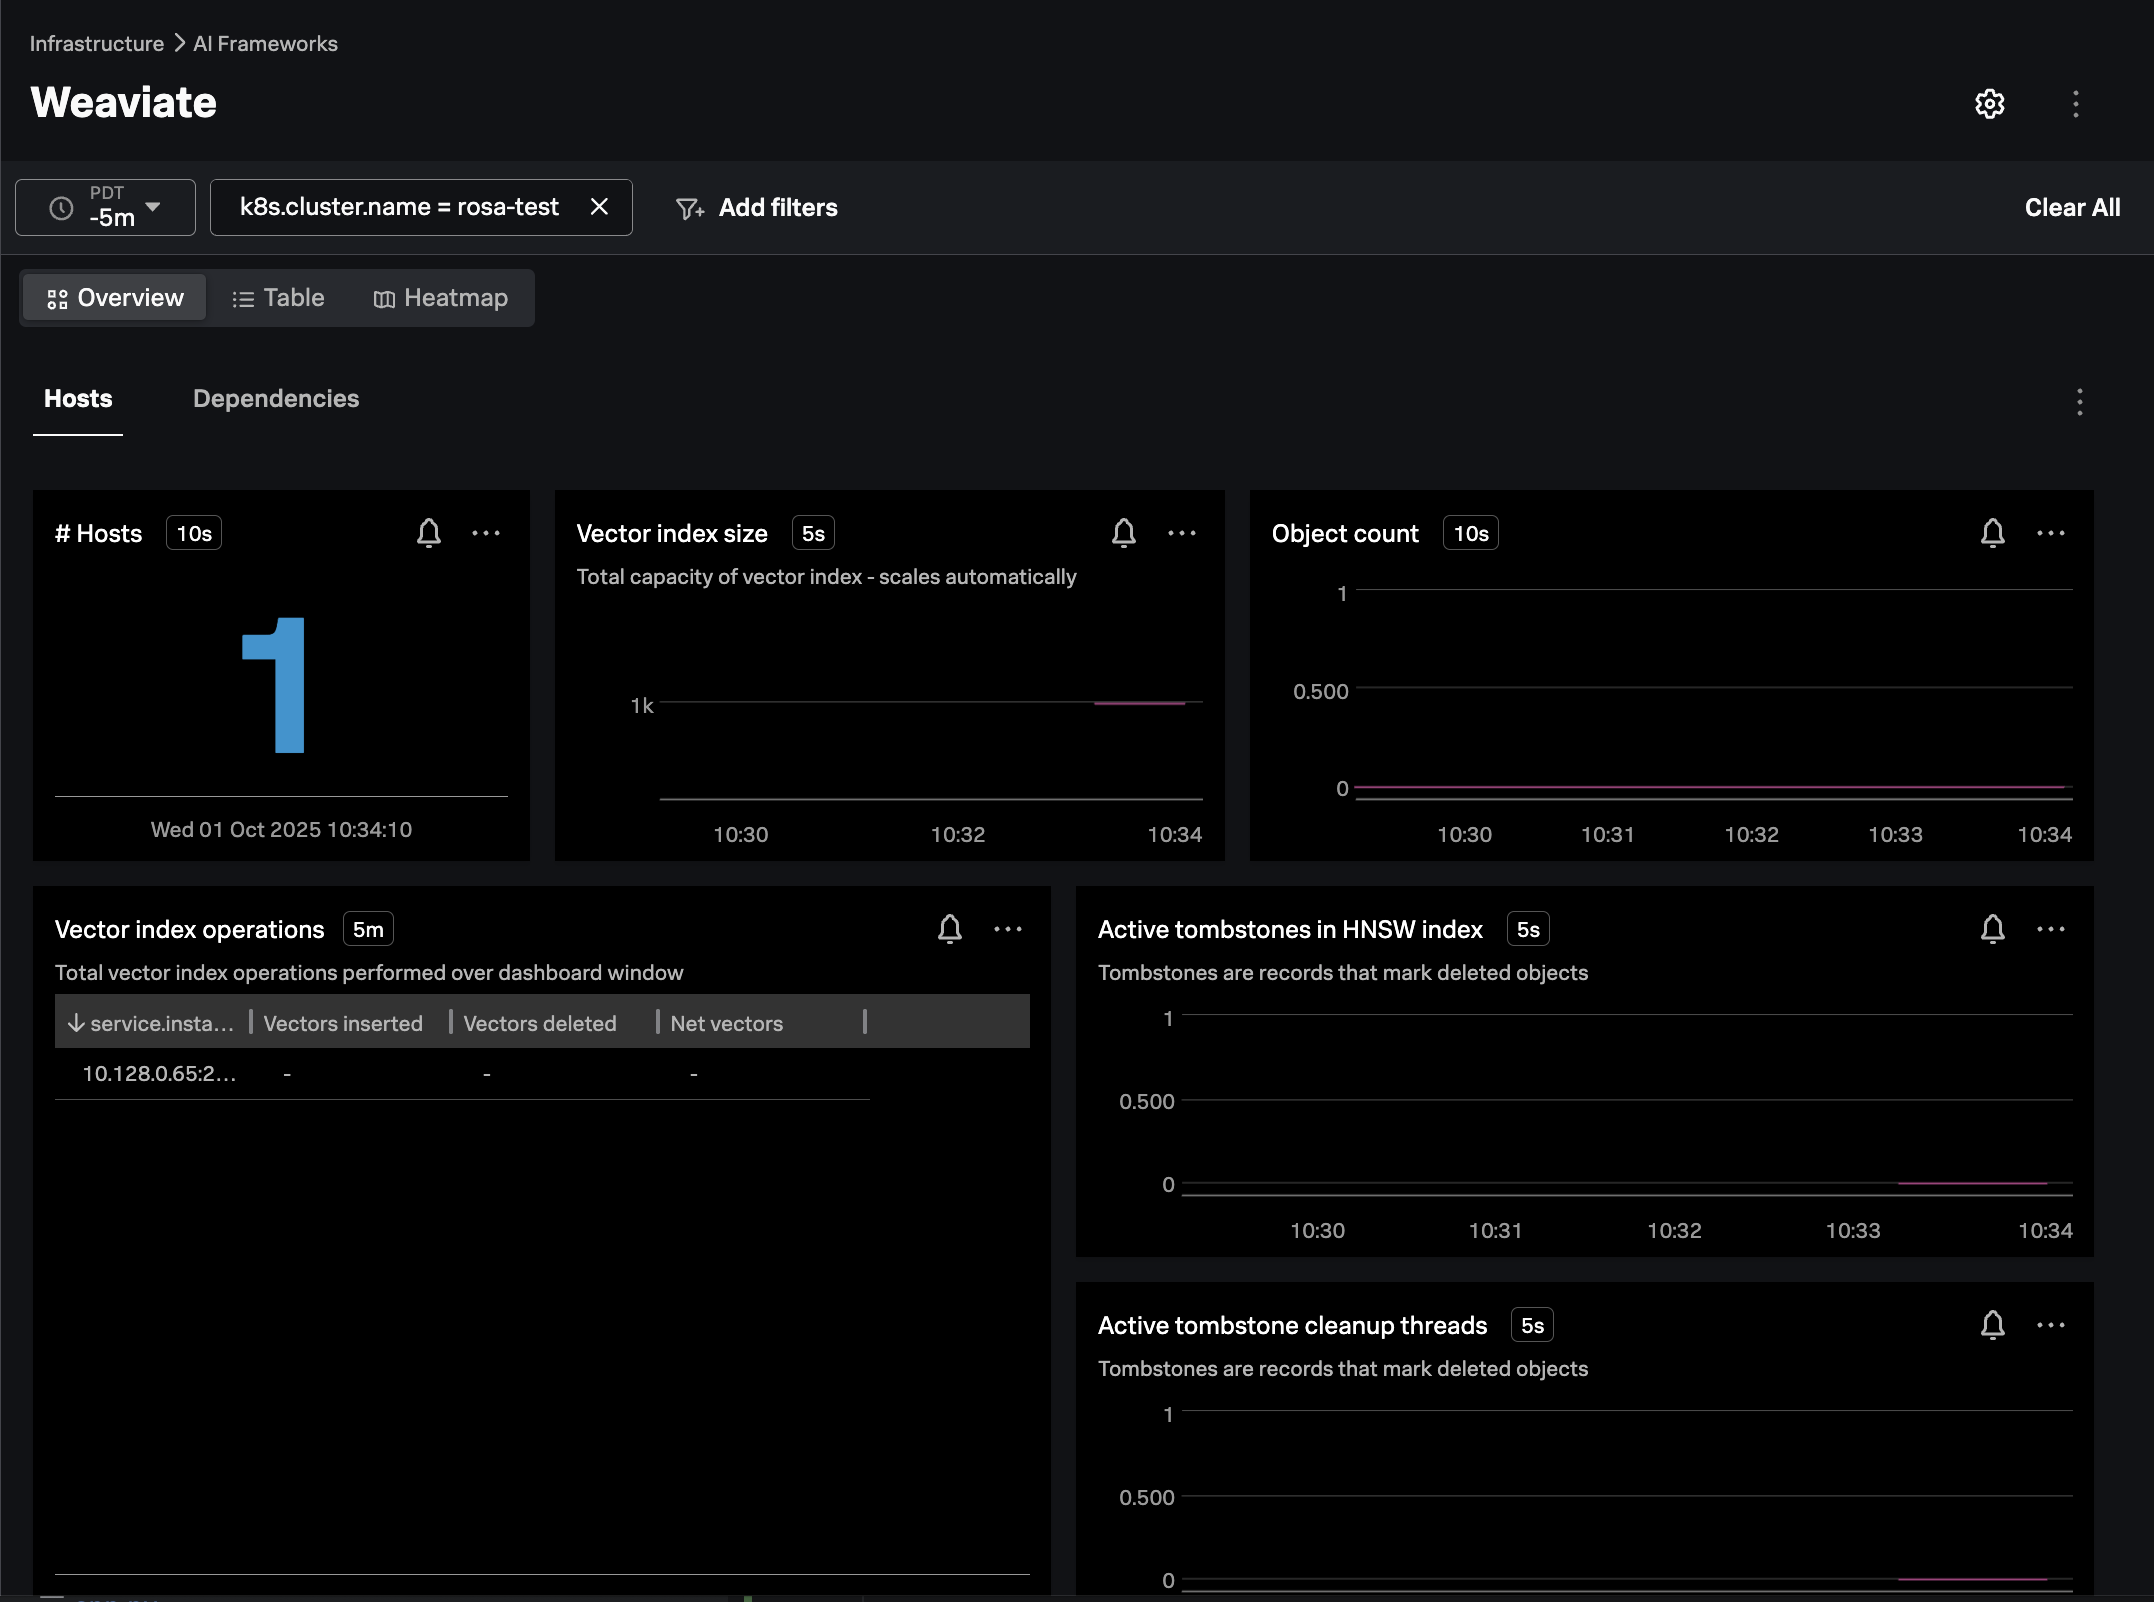
splunk-otel-collector-chart/splunk-otel-collectorIn Splunk Observability Cloud, navigate to Infrastructure -> AI Frameworks -> Weaviate.
Filter on the k8s.cluster.name of interest, and ensure the navigator is populated as in the
following example:
Populate the Vector Database
Now that Weaviate is up and running, and we’re capturing metrics from it, let’s add some data to it that we’ll use in the next part of the workshop with a custom application.
The application used to do this is based on LangChain Playbook for NeMo Retriever Text Embedding NIM.
Per the configuration in ./load-embeddings/k8s-job.yaml, we’re going to load
a datasheet for the NVIDIA H200 Tensor Core GPU
into our vector database.
This document includes information about NVIDIA’s H200 GPUs that our large language model isn’t trained on. And in the next part of the workshop, we’ll build an application that uses an LLM to answer questions using the context from this document, which will be loaded into the vector database.
We’ll deploy a Kubernetes Job to our OpenShift cluster to load the embeddings. A Kubernetes Job is used rather than a Pod to ensure that this process runs only once:
oc create namespace llm-app
oc apply -f ./load-embeddings/k8s-job.yaml
Note: to build a Docker image for the Python application that loads the embeddings into Weaviate, we executed the following commands:
cd workshop/cisco-ai-pods/load-embeddings
docker build --platform linux/amd64 -t derekmitchell399/load-embeddings:1.0 .
docker push derekmitchell399/load-embeddings:1.0