Overview
Splunk for OT Security is designed to work to help Splunk Enterprise Security customers understand more about their OT environments and create end-to-end security visibility across both OT and IT systems. In addition, customers under NERC CIP regulations will be able to leverage Splunk's platform to ensure compliance and auditing requirements. Splunk for OT Security focuses around extending the current capabilities of Splunk Enterprise Security in two primary areas explained below.
Providing Asset Context
While Splunk Enterprise Security provides existing dashboards and capabilities around understanding Assets, OT systems often require additional context and investigation before action is possible. Splunk for OT Security extends Splunk Enterprise Security's Asset & Identity Framework to include additional important fields such as site, role of machines, and location within ISA 99 models.
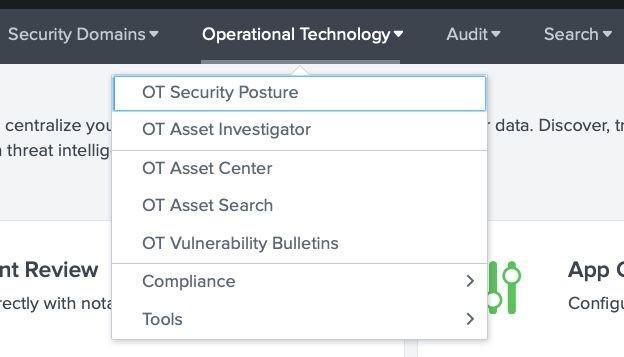
Dashboards that cover these areas can be found via the Operational Technology navigation menu item as shown here:
Extended Dashboards and Investigative Capabilities
While in most cases Splunk for OT Security will be integrated in a combined Security Operations Center for both IT and OT, specific views into the OT environment can help an analyst understand current security posture. This includes specific views around security posture, OT assets, as well as vulnerabilities in OT Environments. In addition, OT assets are now integrated directly with Splunk Enterprise Security existing dashboards, reports, and incident management capabilities.
For example, OT assets can be tagged in the Asset and Identity Framework directly to produce a list of incidents related to OT Assets and Identities. This is shown here by simply putting in the word *ot* into the search criteria to produce a list of OT incidents which can be reviewed.
Incident Review Example
Dashboard Content
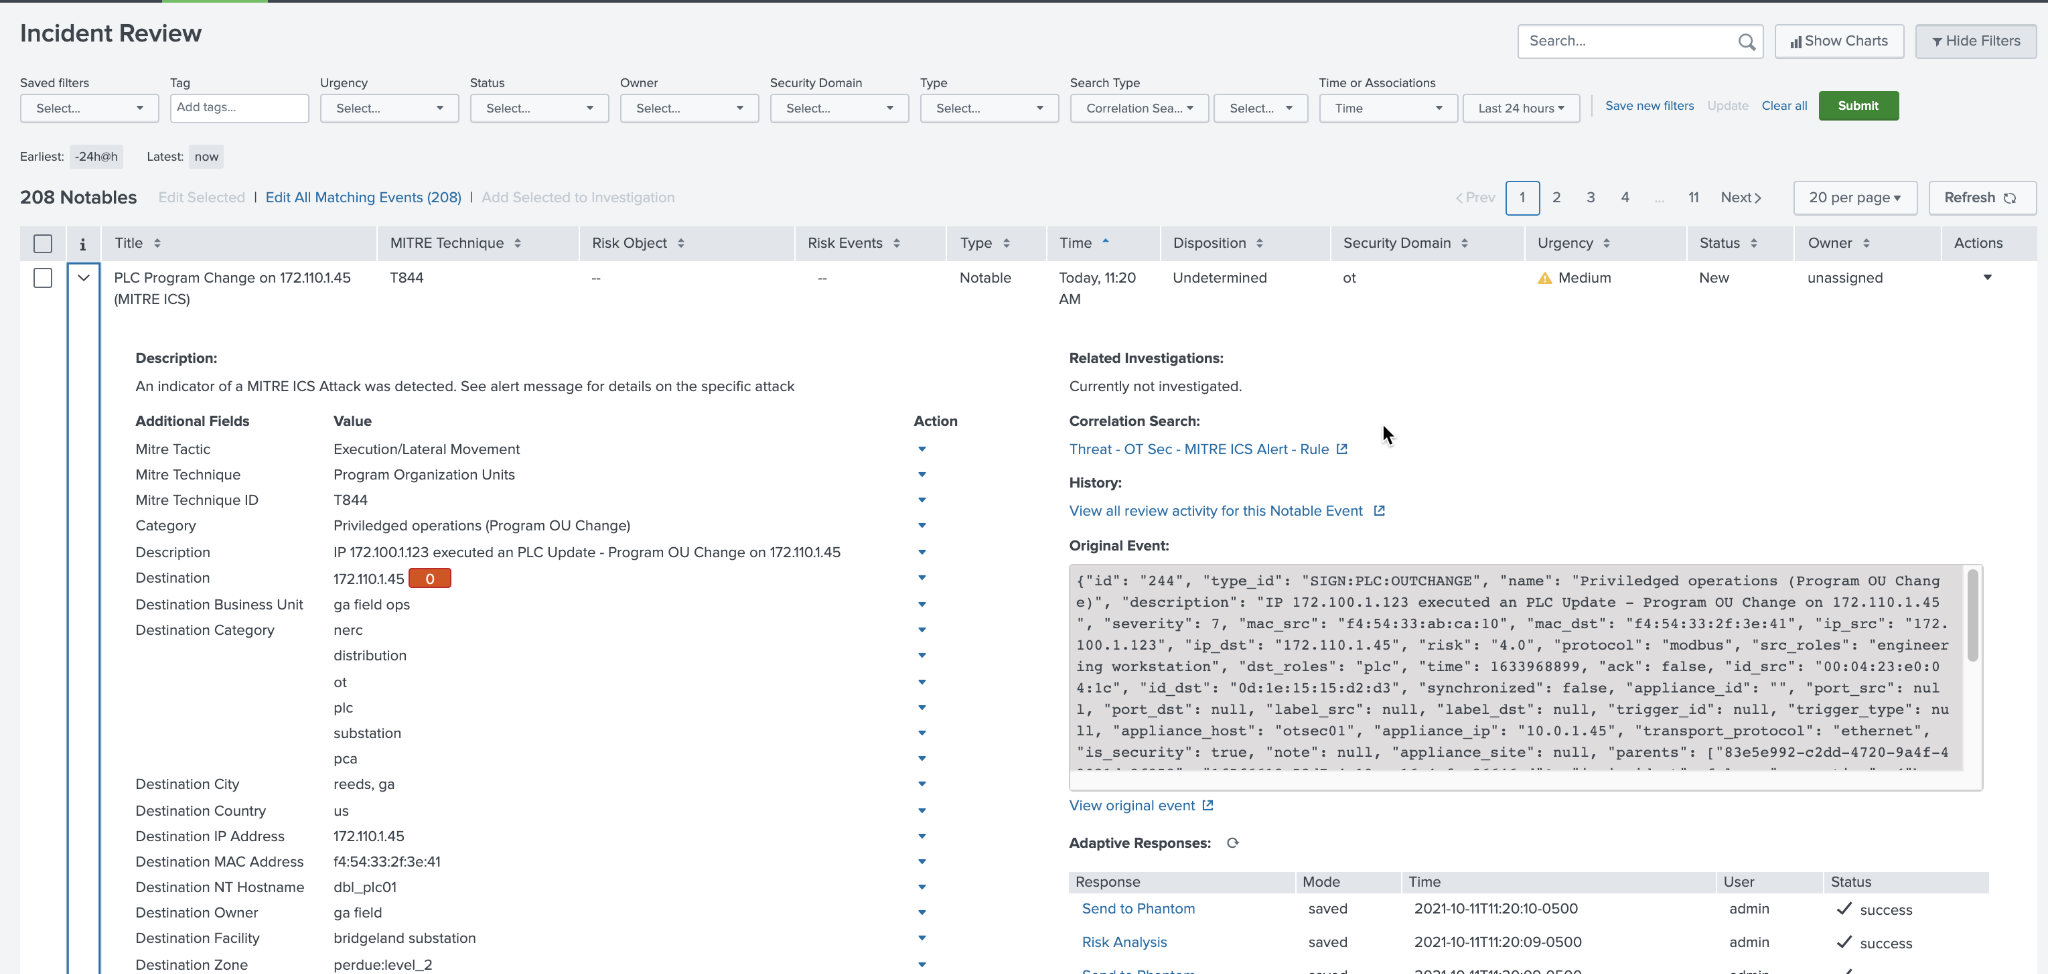
As a result of extending the Asset and Identity Framework, any field such as site, environment, or classification can now be used as a filter by specifying a tag in the filter criteria.
OT Security Posture
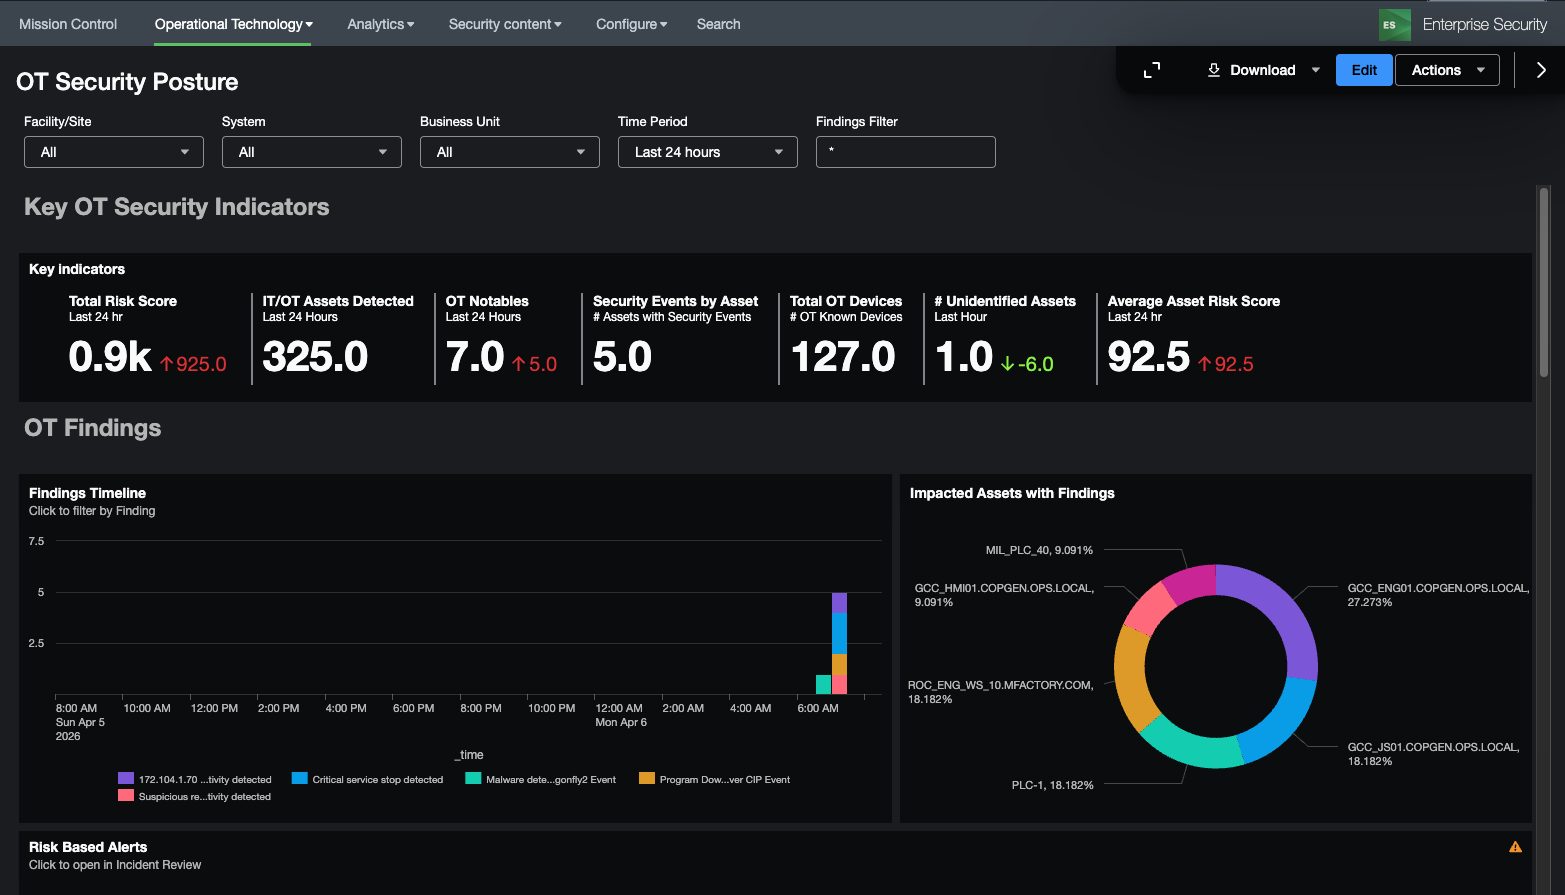
The OT Security Posture dashboard is designed to provide a high level overview of an organization\'s security posture for their OT environment. New Key Performance Indicators (KPI's) have been created that focus around the health and risk of OT security operations. Notable security events are also pre-filtered and include both existing correlation rules as well as new MITRE ICS ATT&CK correlation rules. Drilling down on a notable allows the security analysis to start an investigation within ES easily.
OT Security Posture Example (OT Security Posture):
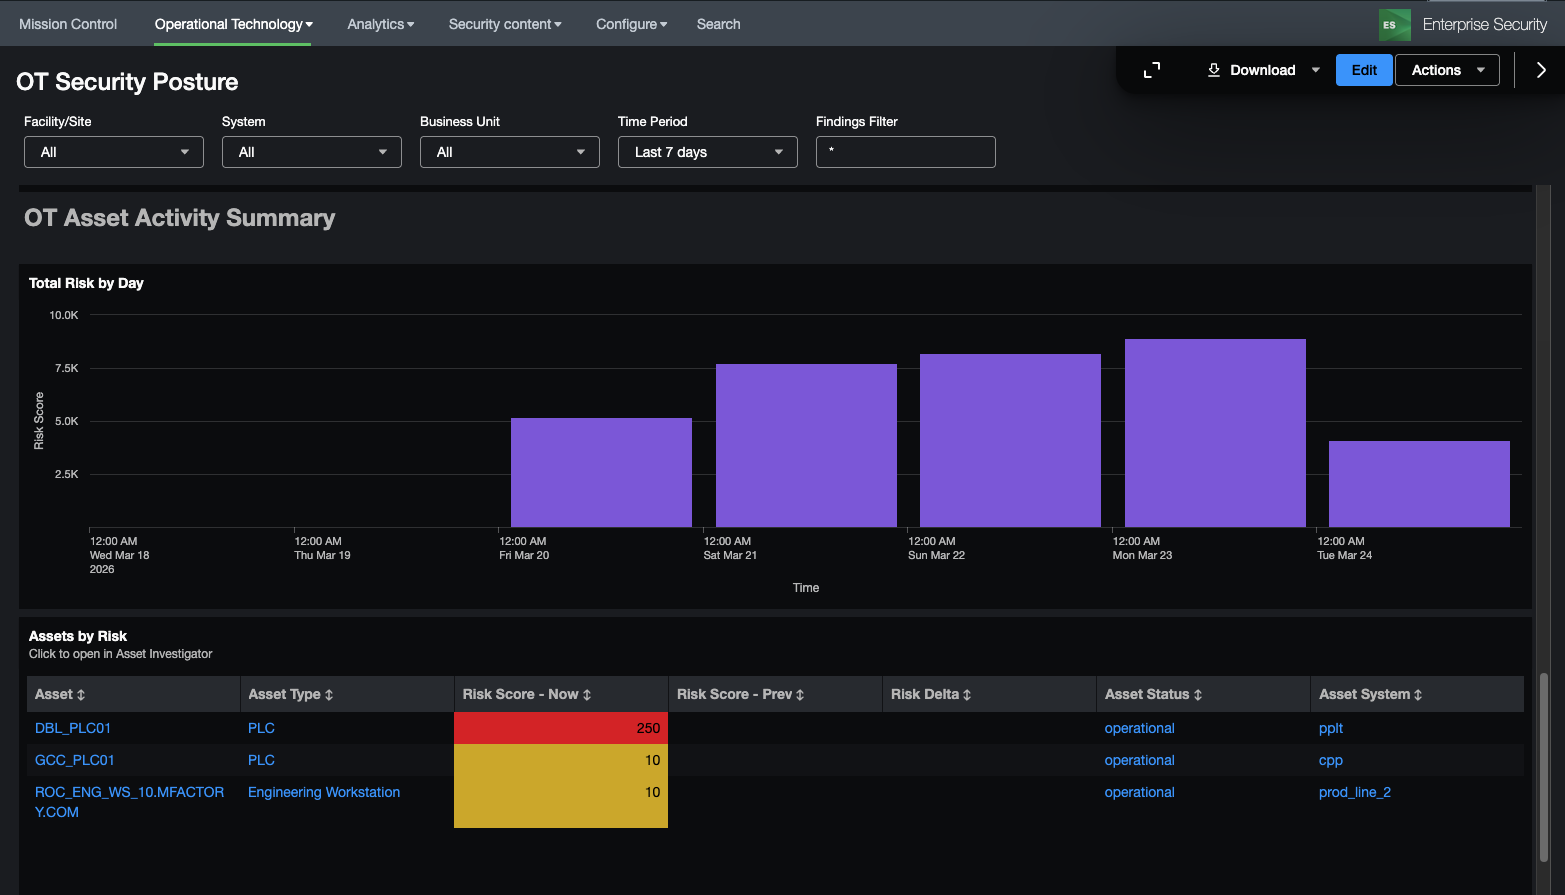
In addition, OT Asset Activity is summarized below so that the security analyst can understand how asset's network behavior might be changing or how their risk is changing over time. Additional filters at the top of the dashboard allow panels below to view details for specific sites, systems, or business units.
OT Asset Activity Example (OT Security Posture):
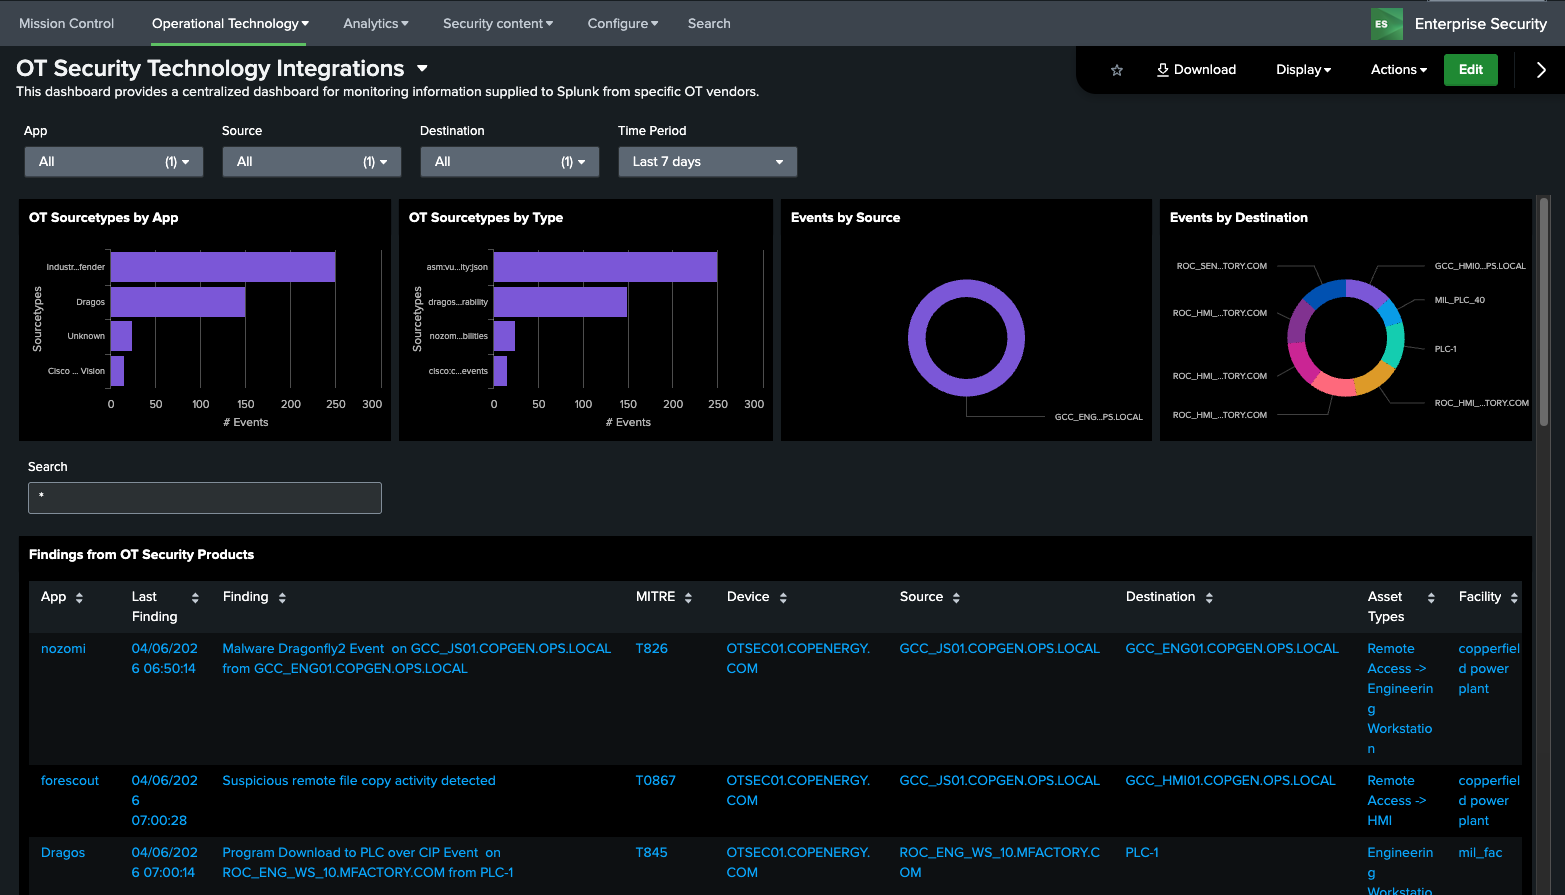
OT Security Technology Integrations
The OT Security Dashboard is intended to bring together diverse OT Security tools into a single dashboard and provide a way to search across these different technologies. In the dashboard a user can search and filter across different sourcetypes associated with these products. This dashboard leverages the macros get_ot_security_events and get_ot_security_notables to specify which products should be presented in this dashboard.
Dependencies
- Asset & identity framework
- Indexes
- notable
- Macros
- get_asset_name
- get_asset_type
- get_ot_security_events
- get_ot_security_notables
- Lookups
- asset_type_standard_lookup
OT Asset
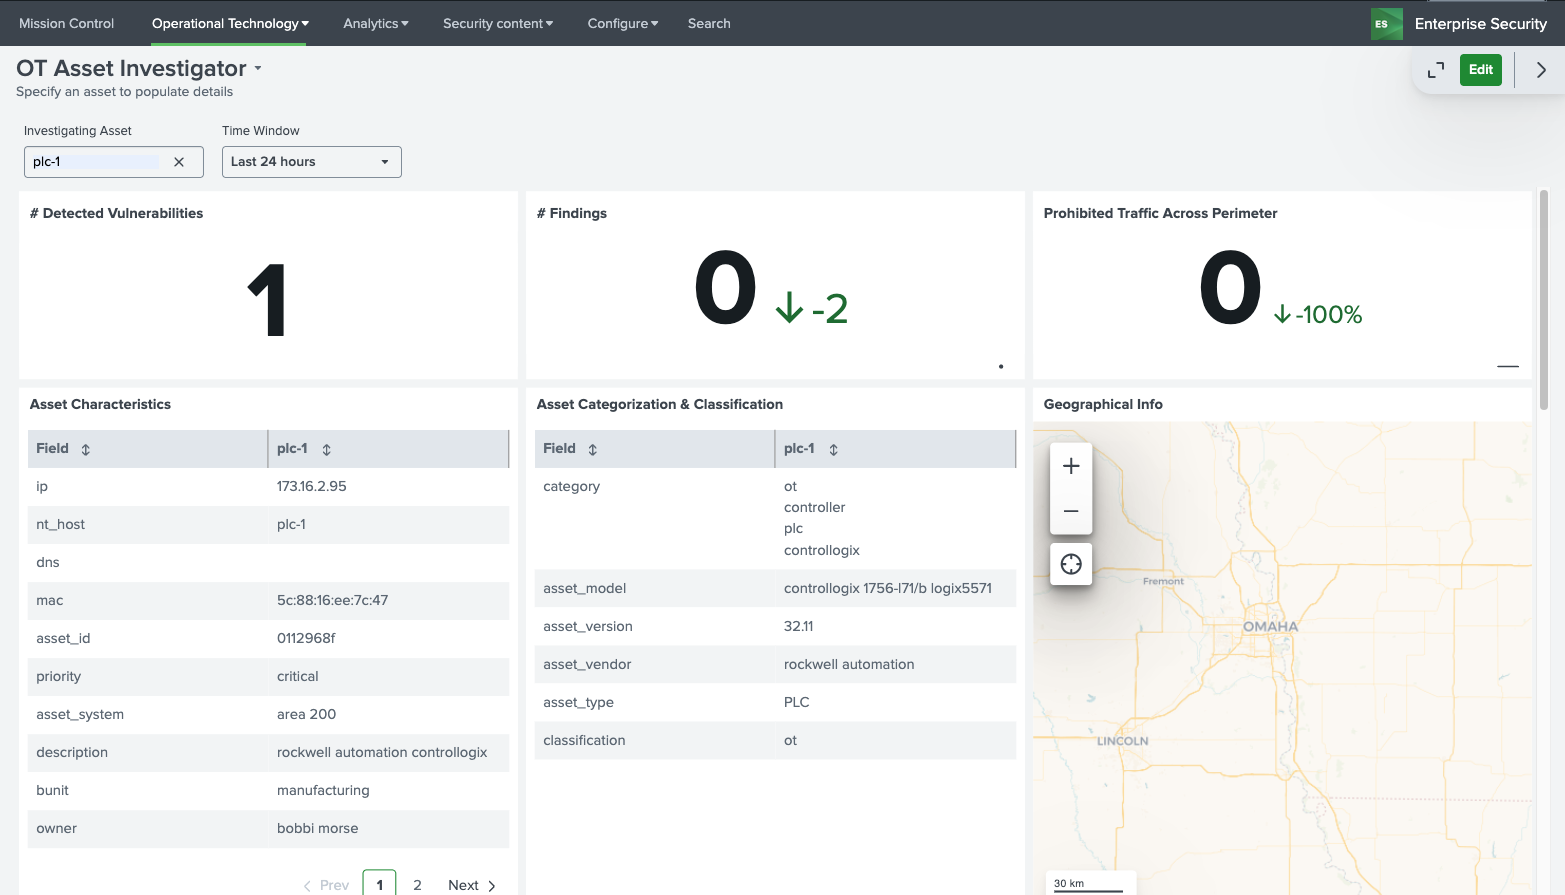
OT Asset Investigator
The OT Asset Investigator dashboard is designed to provide OT security practitioners with additional context to and understanding of OT asset behavior over time. In addition, the dashboard provides an investigative workflow by presenting meaningful metrics and information that a security practitioner might be able to use for ad-hoc analysis, either for a specific asset or data source.
The dashboard upper section presents information about the asset itself, such as location, operational role, and critical information to determine the priority of the asset relating to a security incident.
Dependencies
- Asset & identity framework
- Indexes
- notable
- risk
- Macros
- get_asset_name
- get_asset_type
- Lookups
- asset_type_standard_lookup
OT Asset Details Example (OT Asset Investigator):
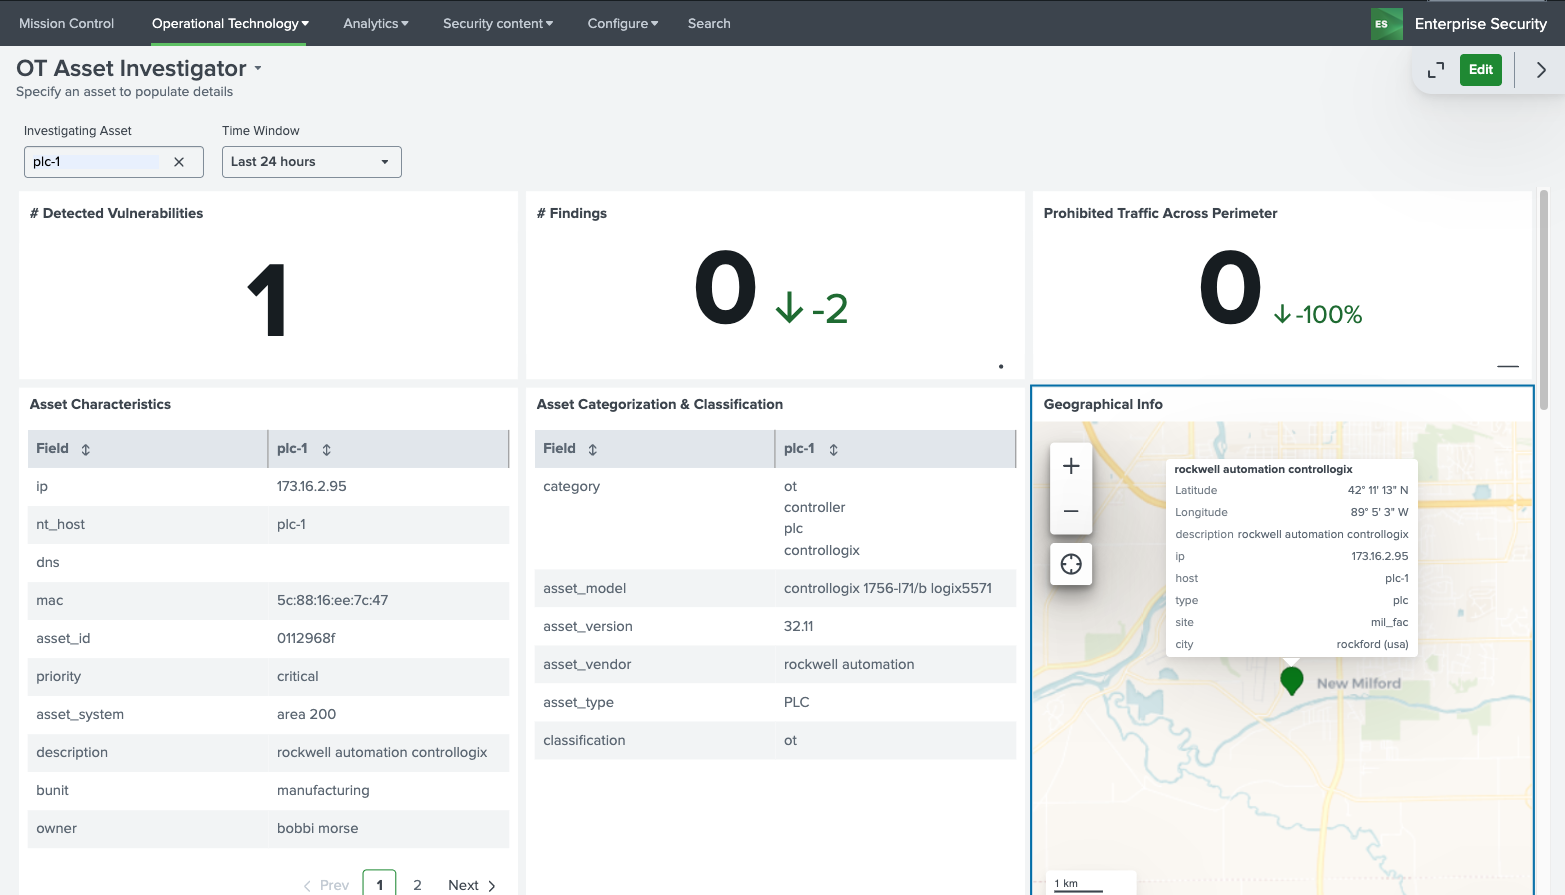
The top selection provides information that is known about an asset, such as its characteristics, classifications, and physical location (when latitude and longitude are provided). In addition, the dashboard contains several high-level indicators including known vulnerabilities related to this asset, any notable events, as well as any traffic that has been detected as prohibited.
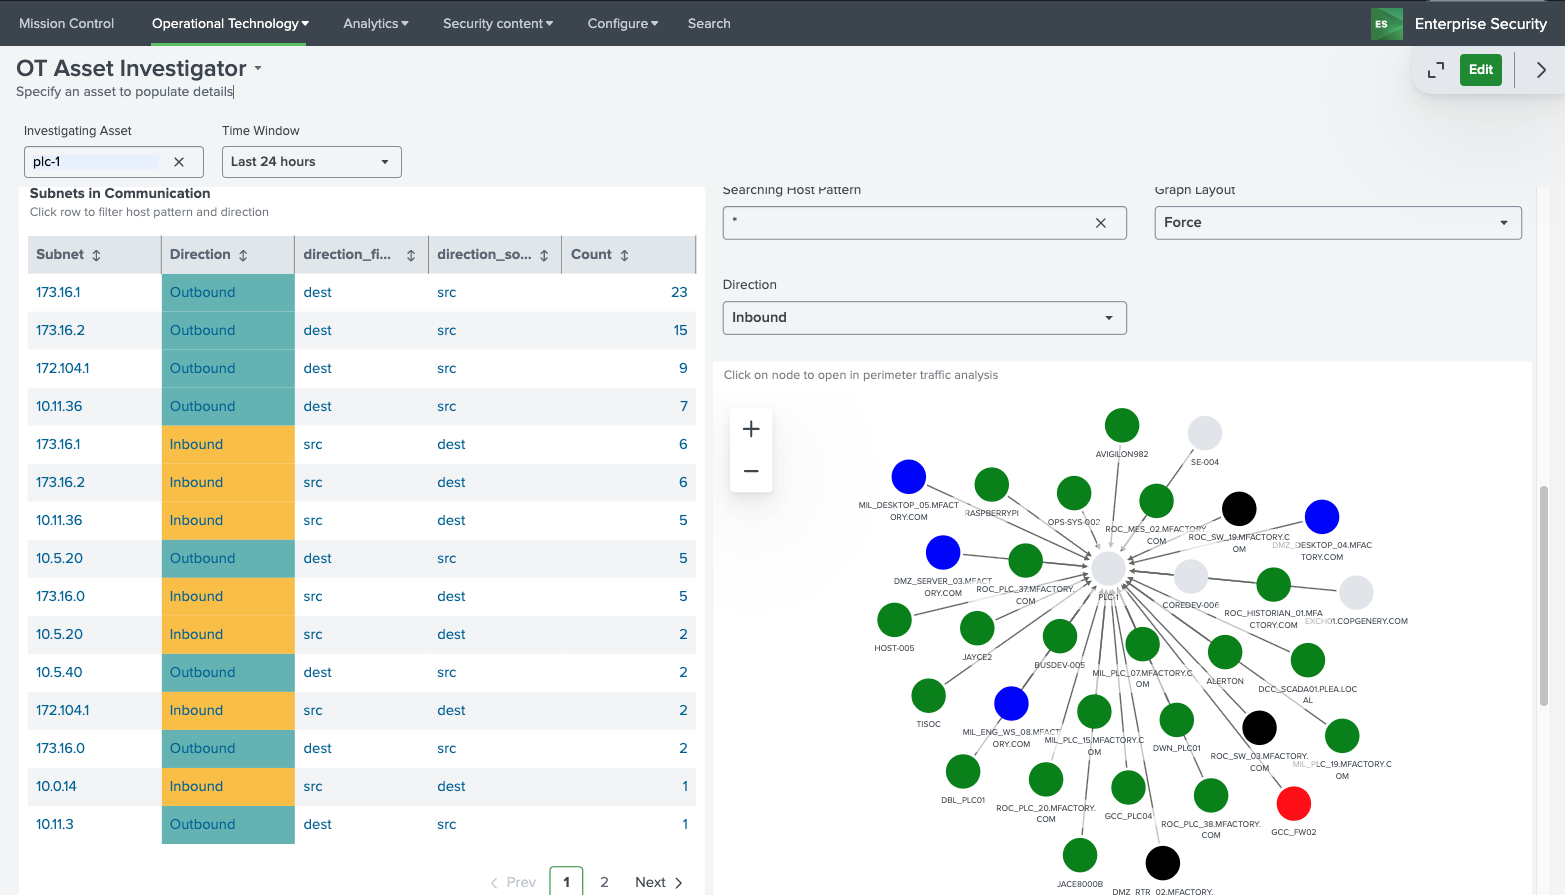
The OT Asset Behavior Indicators provide base metrics on the networking behavior of the selected asset and visualizes the types of communication with others hosts in the environment. This can prove important when trying to identify for example communication that should not be permitted between subnets. Subnets listed on the left can be clicked on to filter the network communication graph on the right-hand side.
OT Asset Behavioral Indicators Example (OT Asset Investigator):
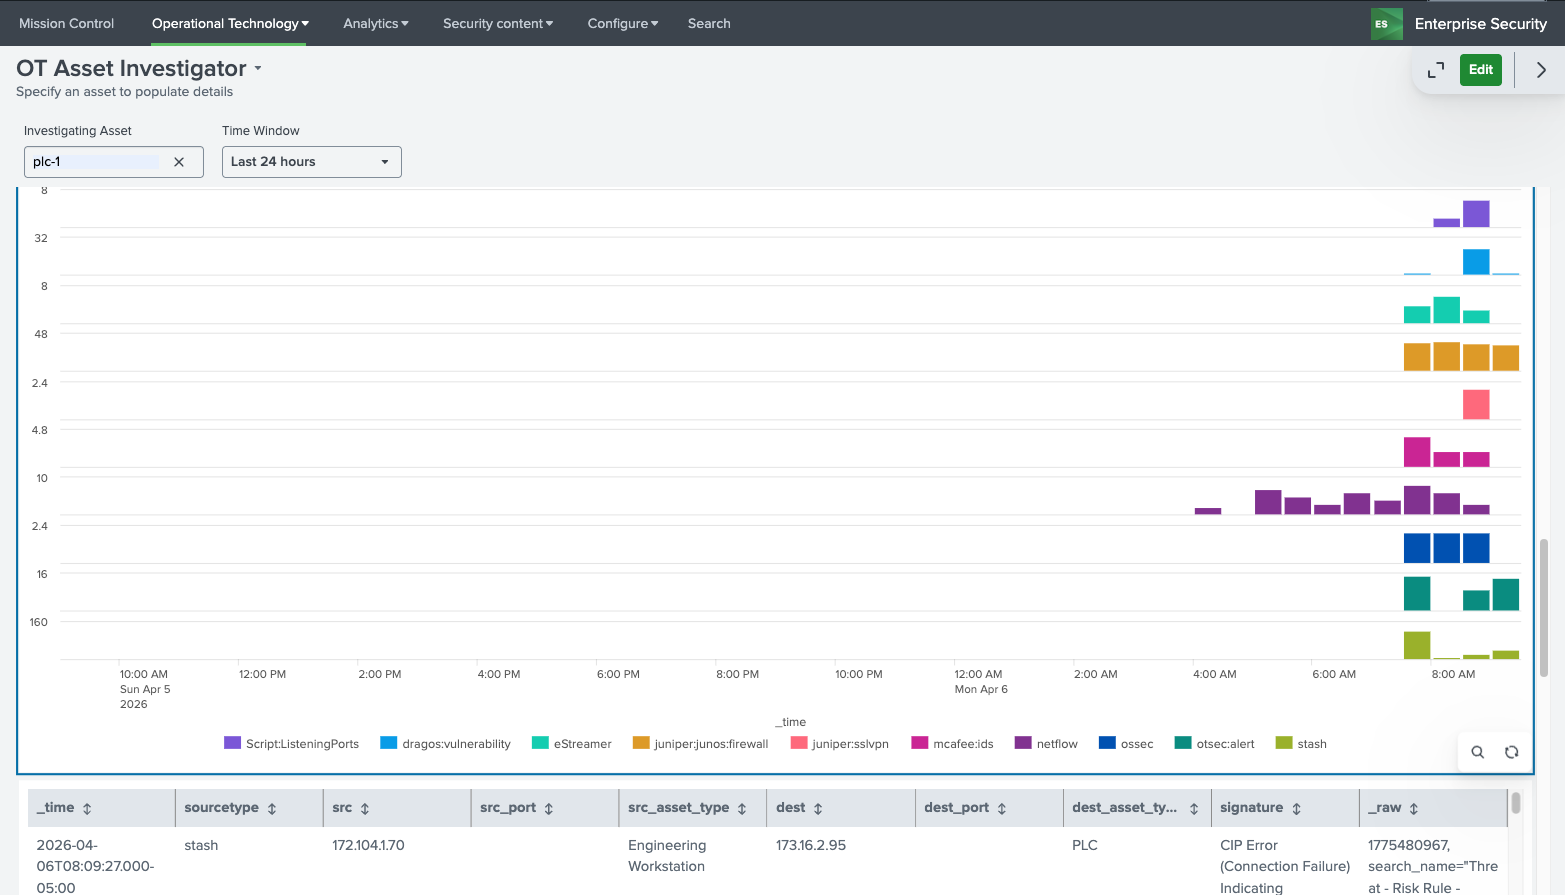
The last sections of the dashboards provide information around data sources which contain the selected asset and can help guide analysis to different data sources within Splunk to investigate. By selecting a data source in the bottom panel, analysts can quickly drill down into a Splunk search showing that data source and the asset selected for ad hoc analysis.
Sourcetype Timeline Drilldown Example (OT Asset Investigator):
OT Asset Center (Software/Hardware)
The OT Asset Center is designed to provide visibility into OT systems and provide meaningful metrics related to vendors, models, and asset types. Unlike the OT Asset Investigator, this dashboard focuses on the entire environment and not specific assets and allows users to search for specific software or hardware in the OT Environment.
Additional filters at the top of the dashboard allow panels below to view details for specific sites, systems, or business units.
OT Asset Indicators Example (OT Asset Center):
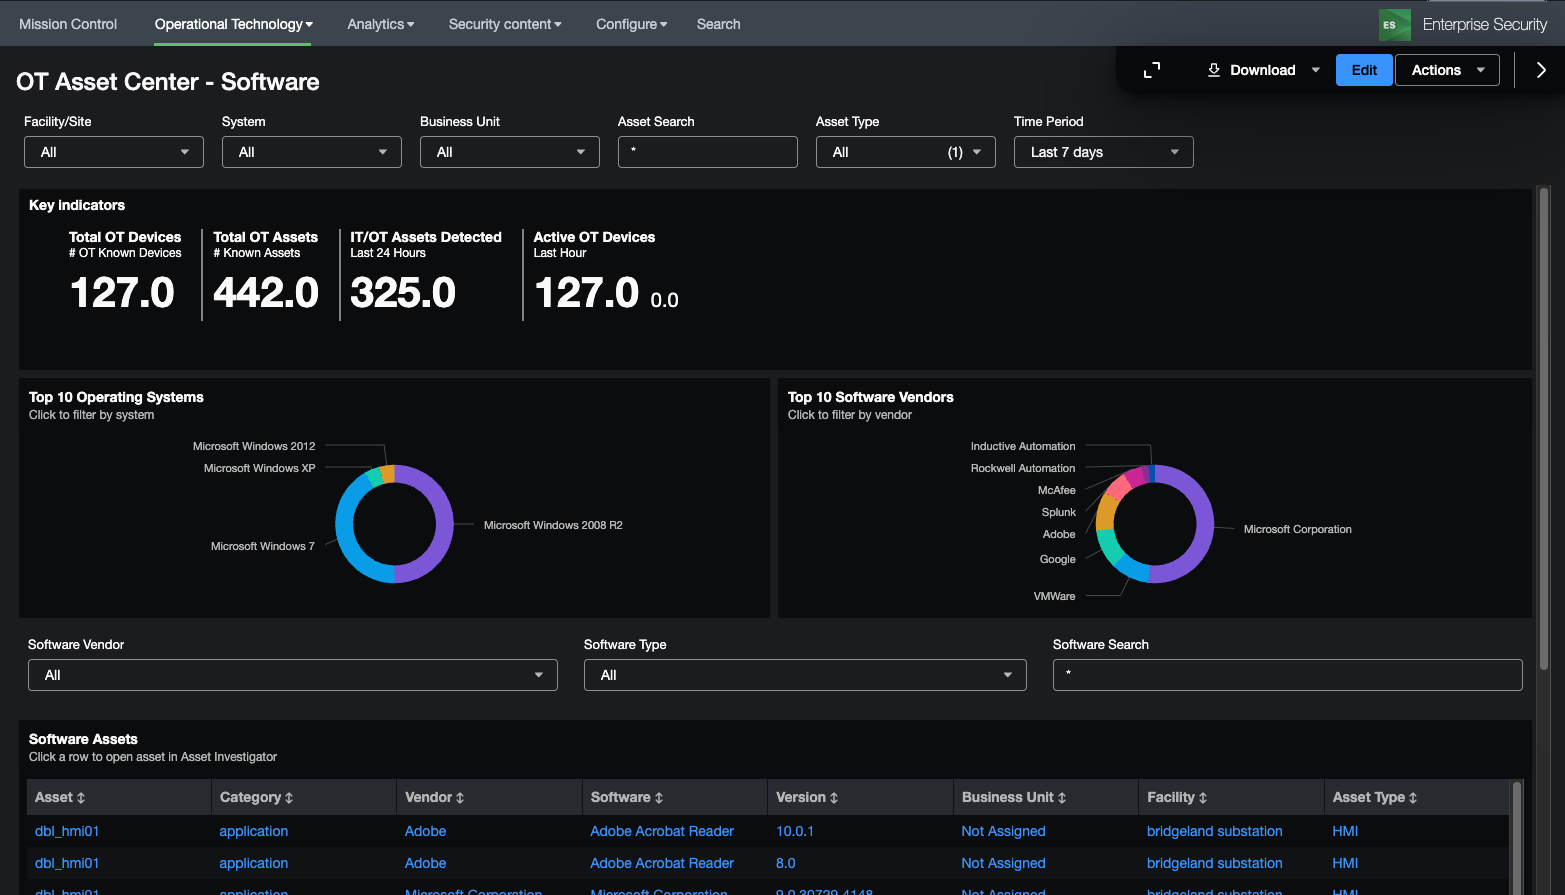
The OT Asset Indicators panels provide metrics on assets that are present in the environment, both in terms of asset types, models, vendors, as well as operating systems and software vendors. Each of these charts can be clicked to populate and filter other parts of the dashboard.
Dependencies
- Asset & identity framework
- Indexes
- Notable
- Risk
- Non internal indexes (for sourcetype drilldown)
- Data Models
- Vulnerabilities
- Network_Traffic
- Macros
- ot_identifier
- get_perimeter_devices
- get_asset_type_icon_and_color
- make_asset_markers
- get_asset_name
- get_asset_type
OT Asset Information Example (OT Asset Center):
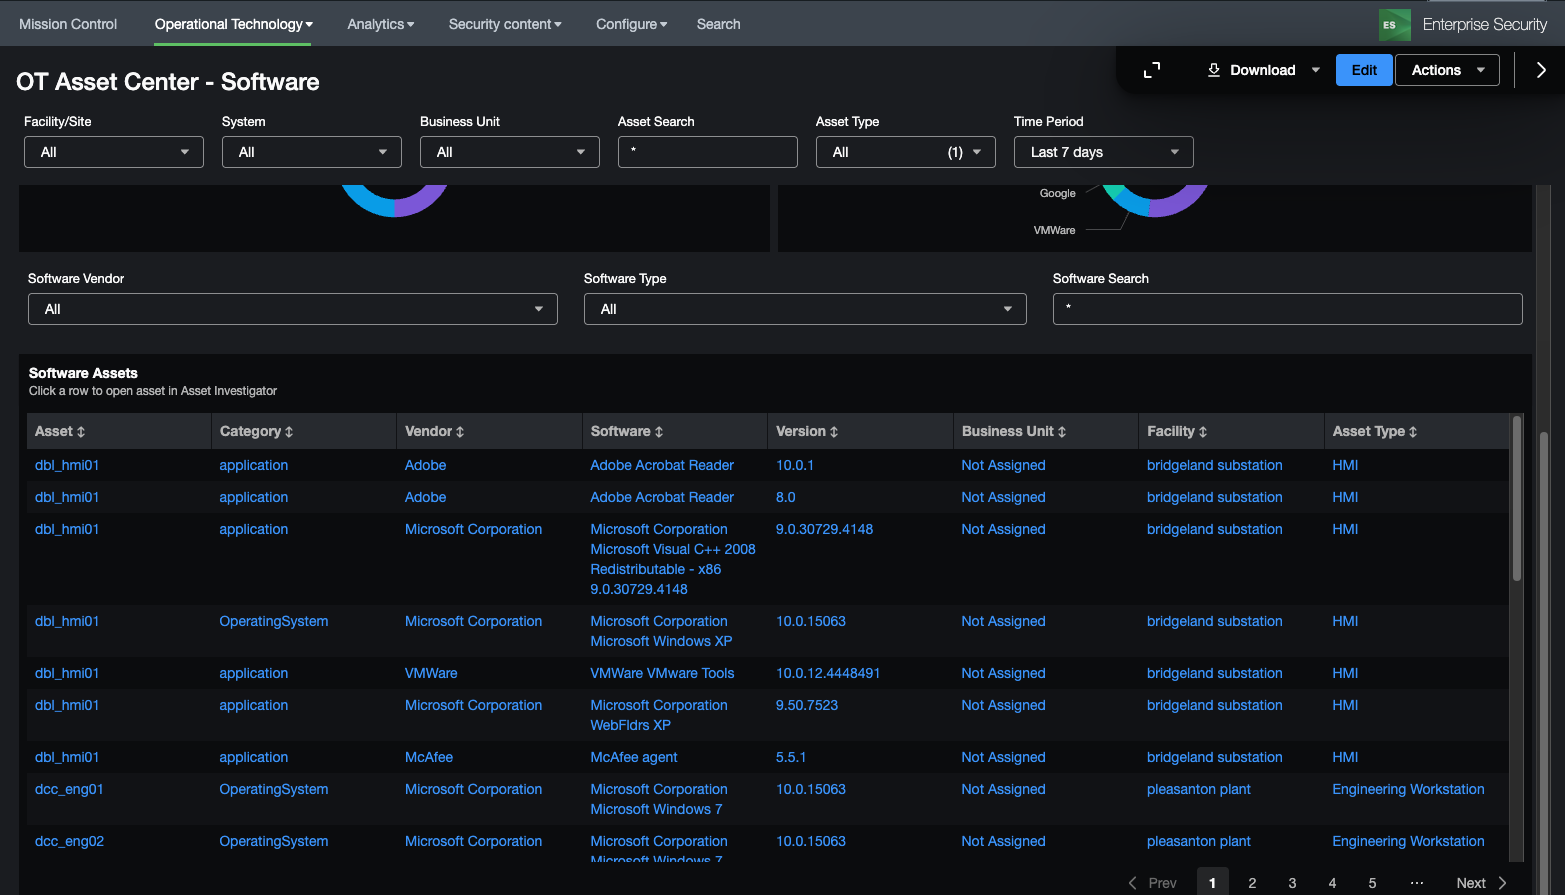
This part of the dashboard is intended to provide a security analyst a method to analyze software and hardware present in the OT environment. Various filters provide the capabilities to search for specific hardware or software components (e.g. checking for the installation of java for a particular asset type). Note, viewing hardware and software components can be toggled under the Asset View Heading. Both hardware and software assets provide additional filters specific to those data types. Also when clicking upon a vulnerability an additional panel will appear giving the specifics of that CVE indicator if present.
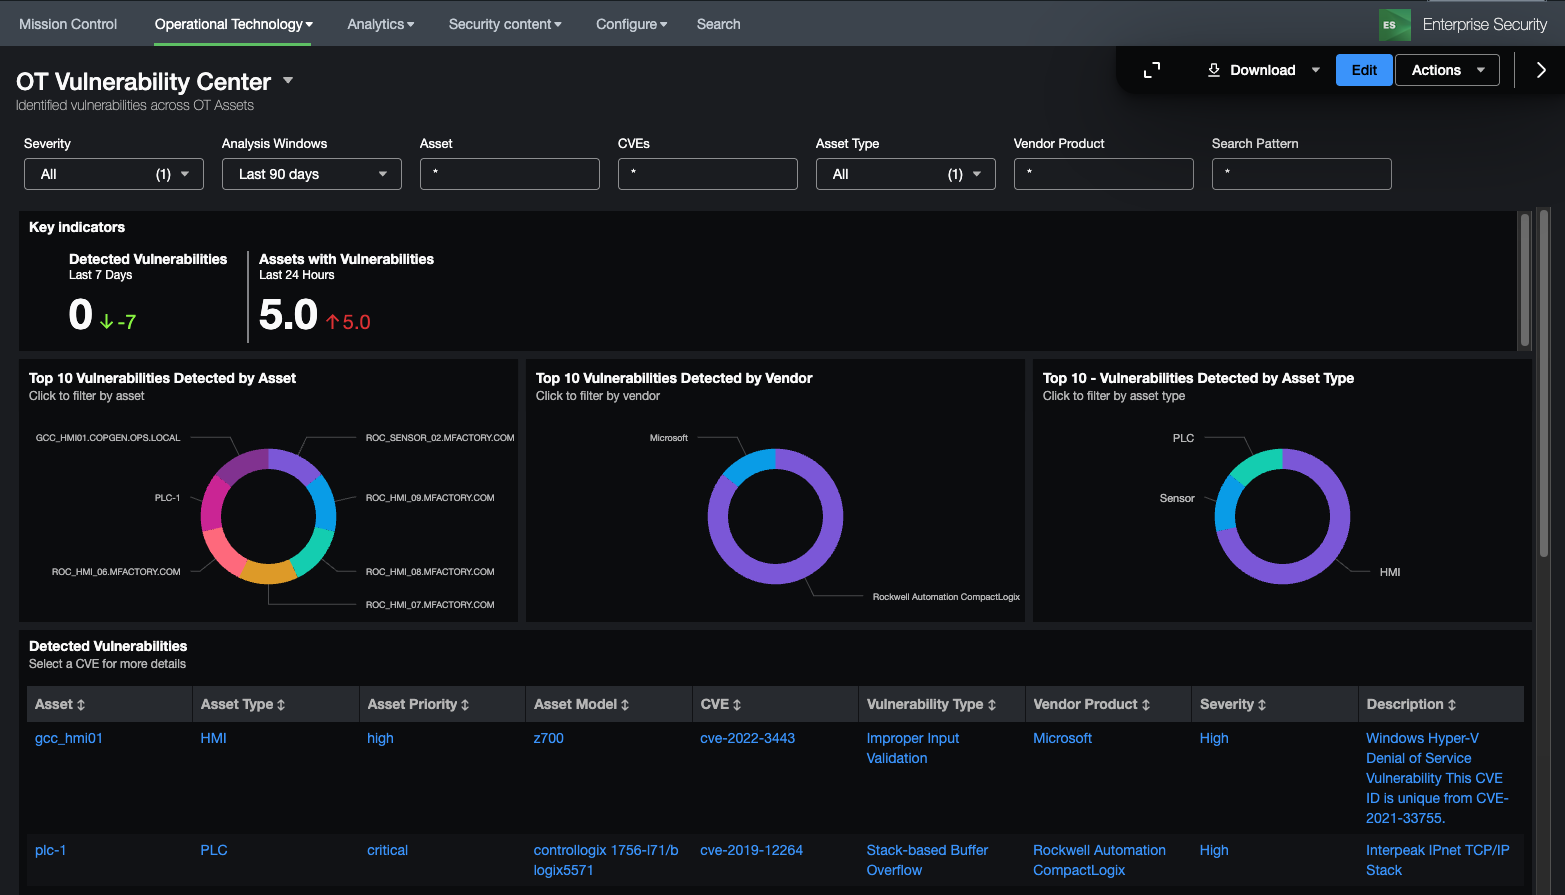
OT Vulnerability Center
Dependencies
- Asset & identity framework
- Indexes
- Customer specified index containing field cpe_uri
- Index containing installed applications on hosts
- Index containing OS information
- Data Models
- Vulnerabilities
- Macros
- ot_identifier
- get_asset_name
- get_asset_type
- get_installedapps_datasources
- get_windows_os_info
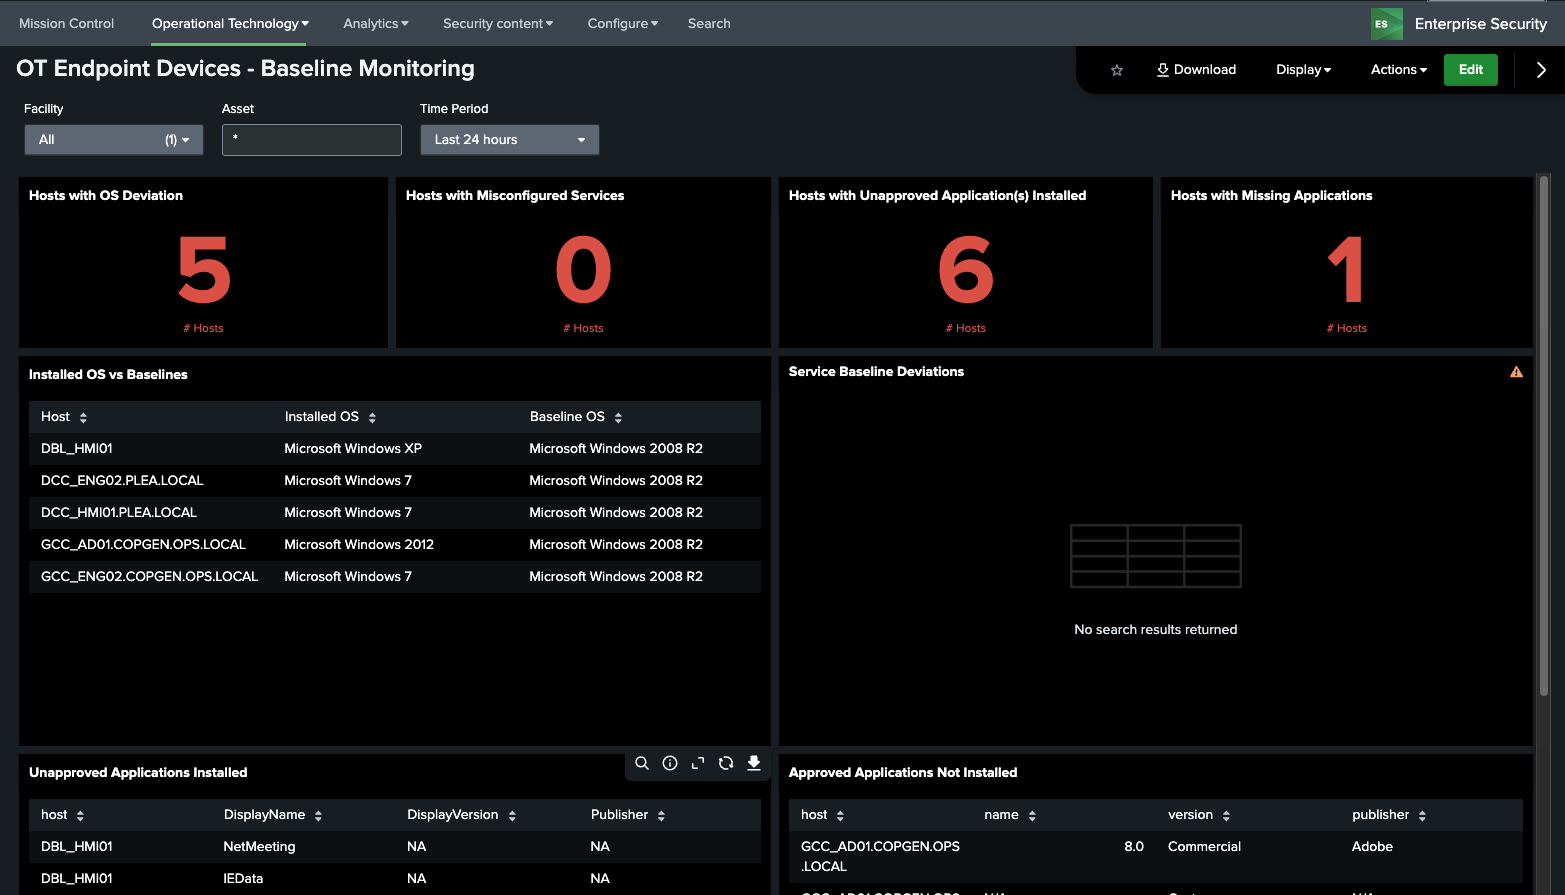
OT Endpoint Devices – Baseline Monitoring
This dashboard takes data from configured baselines and identifies deviations from the expected baseline. By default it is set to show OS, Services, and Application baselines (those provided by the add-on out of the box); however, if you desire to add customer baselines for computers additional panels will need to be added by the user to show those on this dashboard.
For more information setting up baselines go to section
Dependencies - Asset & identity framework - Indexes - Those related to OS information, service state, and applications installed - Data Models - Inventory - Lookups - system_baselines - cip_baseline_groups - Macros - ot_identifier - get_asset_name - get_asset_by - get_service_states - get_installedapps_datasources
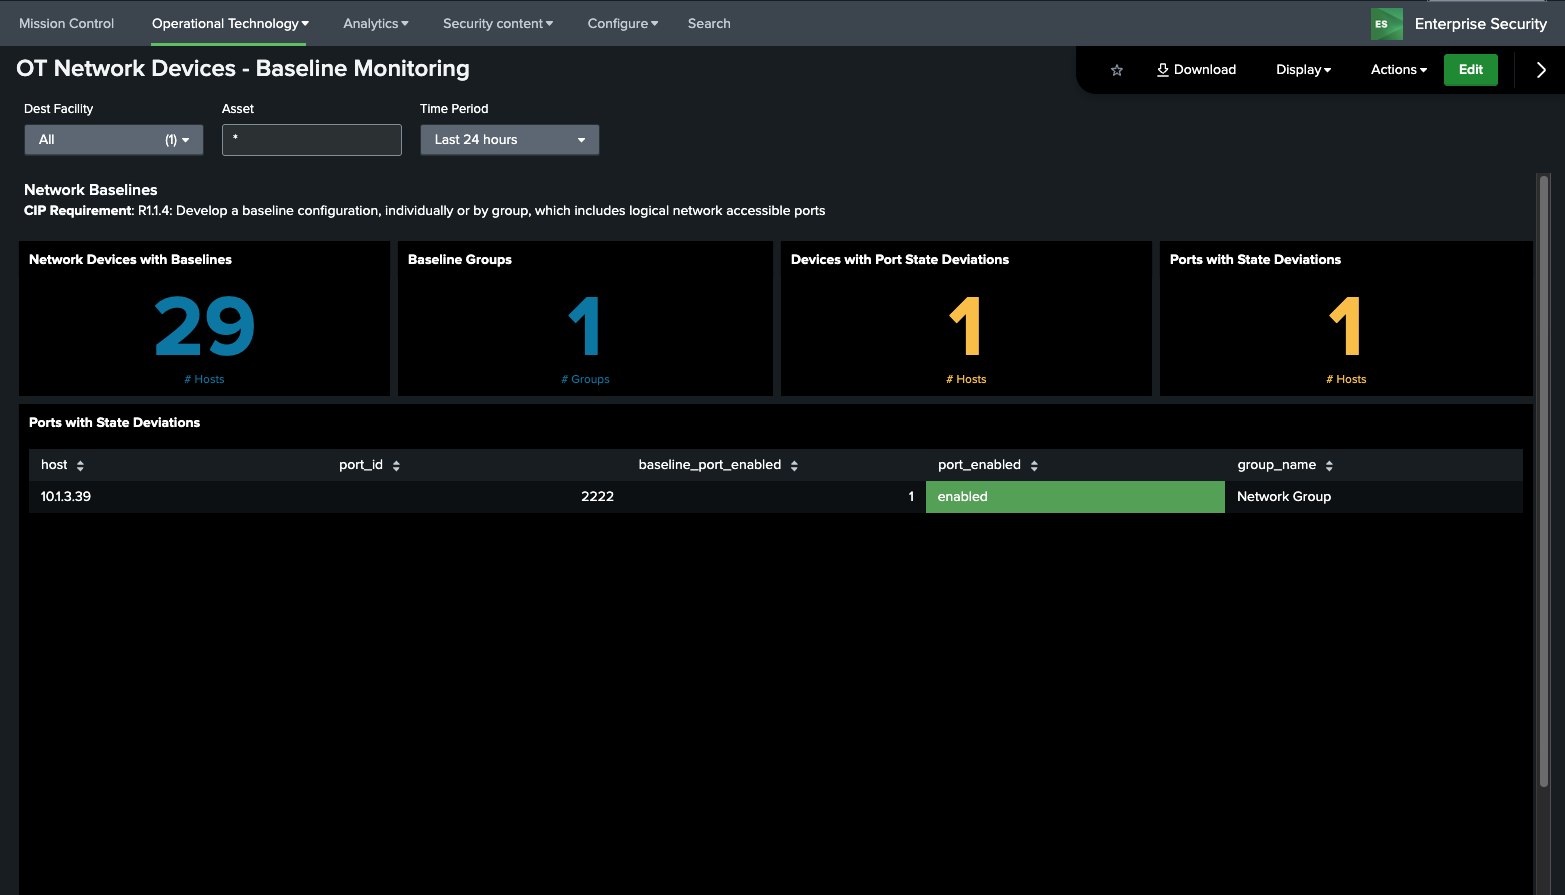
OT Network Devices – Baseline Monitoring
This dashboard takes data from configured baselines and identifies deviations from the expected baseline for networking devices. By default, it is set to show port config baselines (those provided by the add-on out of the box); however, if you desire to add customer baselines for computers additional panels will need to be added by the user to show those on this dashboard.
For more information setting up baselines go to section
Dependencies - Asset & identity framework - Indexes - Those related to port state configuration - Lookups - system_baselines - cip_baseline_groups - cip_network_configs - Macros - ot_identifier - get_asset_name
OT Perimeter
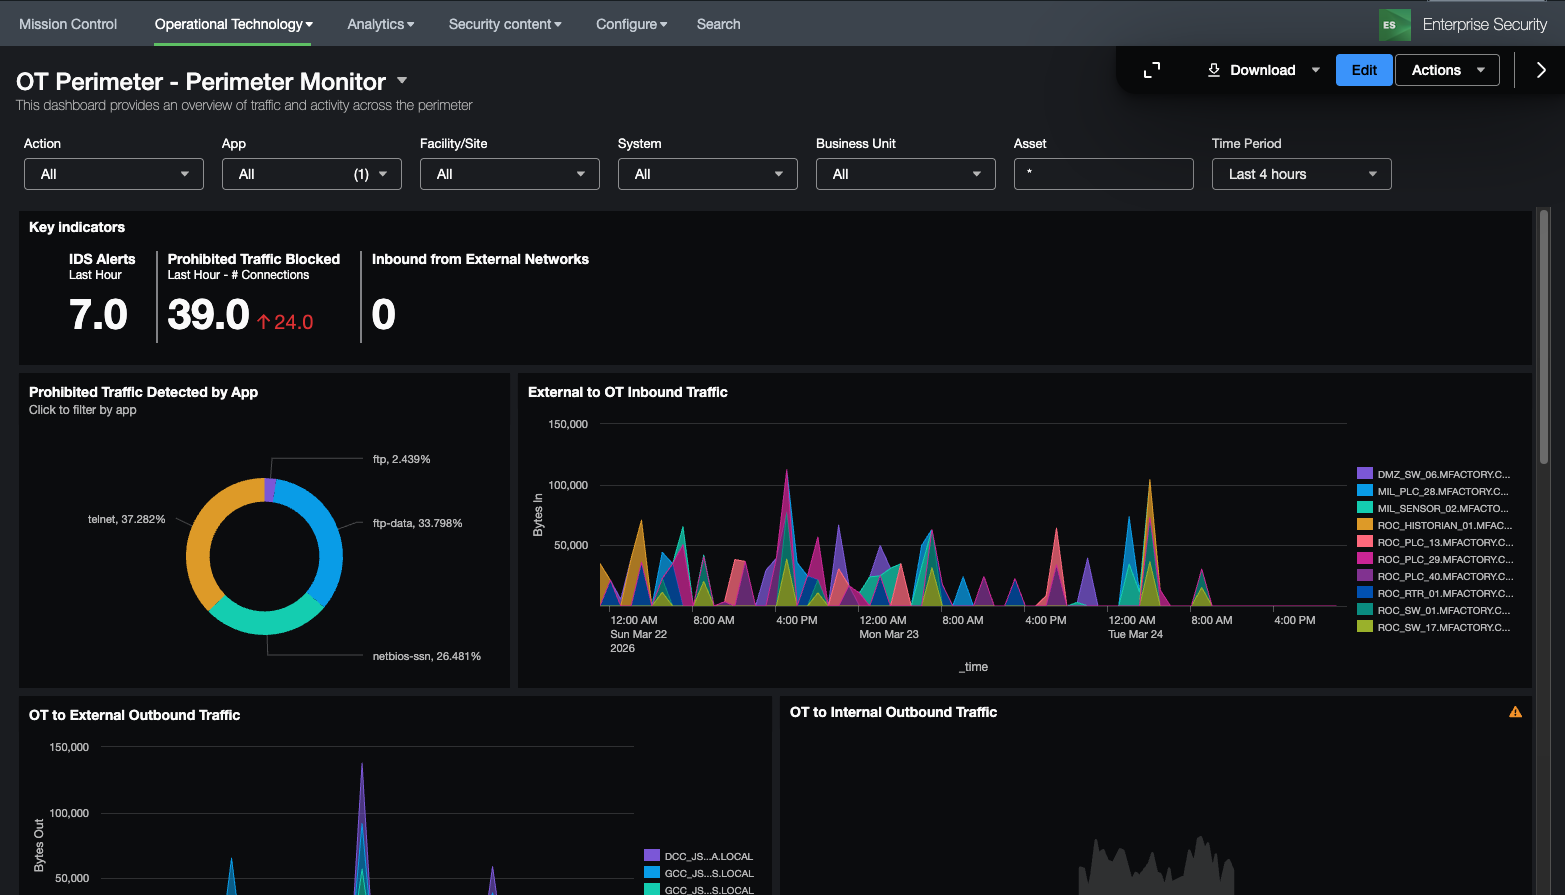
Perimeter Monitor
This dashboard is designed to provide an overview of the perimeter of an OT system as defined in the get_perimeter_devices macro. It focuses on traffic traversing in and out of the security perimeter and whether it is allowed, blocked, and/or perimeter based on a combination of the interesting_ports_lookup and prohibited_traffic_lookup_by_category lookup definitions. The interesting_ports_lookup allows you to proactively identify traffic and the associated application. For example, a user could include port tcp 502 as an interesting port and label it as the app modbus. Using the prohibited traffic lookup file they could then specify that traffic on tcp port 502 is prohibited between an OT zone and Corporate zone. Another common example would be internet traffic outbound from the OT zone to another zone. Each of these lookup tables support wildcards for fields as well. While in many cases this traffic should be blocked automatically via the perimeter this dashboard helps validate that these assumptions are correct. In addition, the dashboard provides changes in traffic such as new ports or significant changes in traffic volumes.
Dependencies
- Asset & identity framework
- Indexes
- Notable
- Risk
- Non internal indexes (for sourcetype drilldown)
- Data Models
- Network_Traffic
- Macros
- ot_identifier
- get_perimeter_devices
- get_asset_name
- get_asset_type
- prohibited_ot_network_traffic_allowed_filter
- label_internal_ips
- Lookups
- interesting_ports_lookup
- prohibited_traffic_lookup_by_category
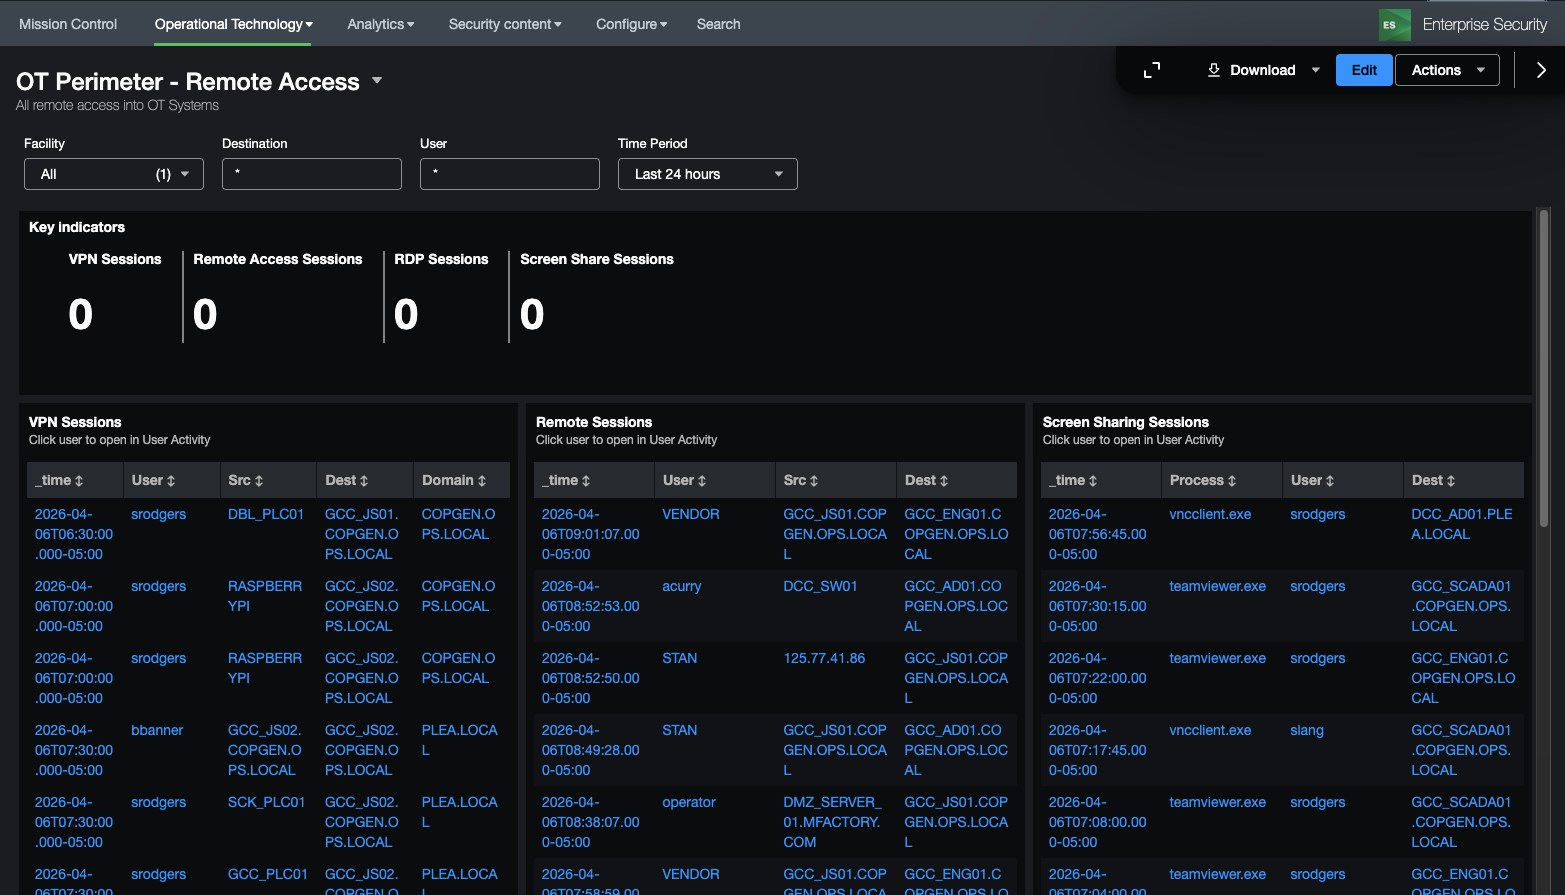
Remote Access
This dashboard is focused on remote access into an OT environment, specifically VPN, RDP, Screen Sharing Sessions, or other remote access. It provides KSI\'s related to this activity as well as specifics on the remote access activity. It also provides a visual diagram showing the access path to assets by users visually to identify prohibited access (for instance if all remote access should come via a remote access or jump server).
Dependencies
- Asset & identity framework
- Data Models
- Network_Sessions
- Authentication
- Endpoint.Processes
- Macros
- ot_identifier
- get_perimeter_devices
- get_asset_name
- get_asset_type
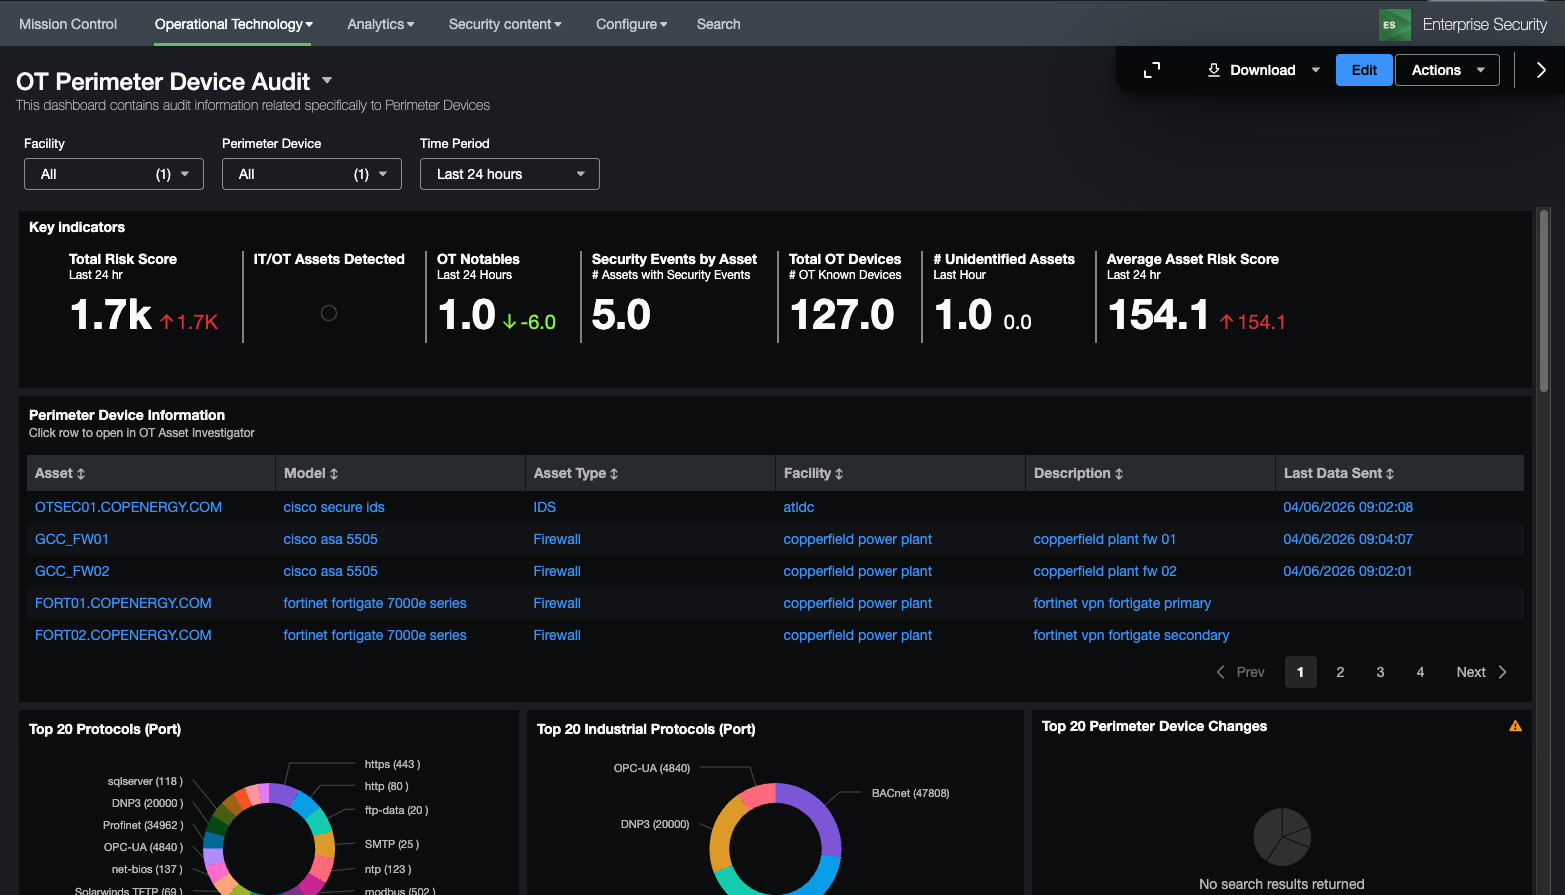
Device Audit
This dashboard focused on changes that have been made to devices identified as perimeter devices as defined in the get_perimeter_devices macro. It provides some KSI's on those device changes as well as an overview of the perimeter devices, ports and protocols being used by those devices, access to perimeter devices, and audit logs of both firewall rule changes as well as the rules themselves. It can be useful for identifying what changes are made on devices as well as who is logging into perimeter devices. Firewall rules and object definitions are contained in the ot_firewall_rules and ot_firewall_object_groups lookup files.
Dependencies
- Asset & identity framework
- Indexes
- Notable
- Risk
- Non internal indexes (for sourcetype drilldown)
- Data Models
- Authentication
- Change
- Network_Traffic
- Macros
- ot_identifier
- get_perimeter_devices
- get_asset_name
- get_asset_type
- prohibited_ot_network_traffic_allowed_filter
- label_internal_ips
- Lookups
- industrial_ports
- interesting_ports_lookup
- ot_firewall_rules
- ot_firewall_object_groups
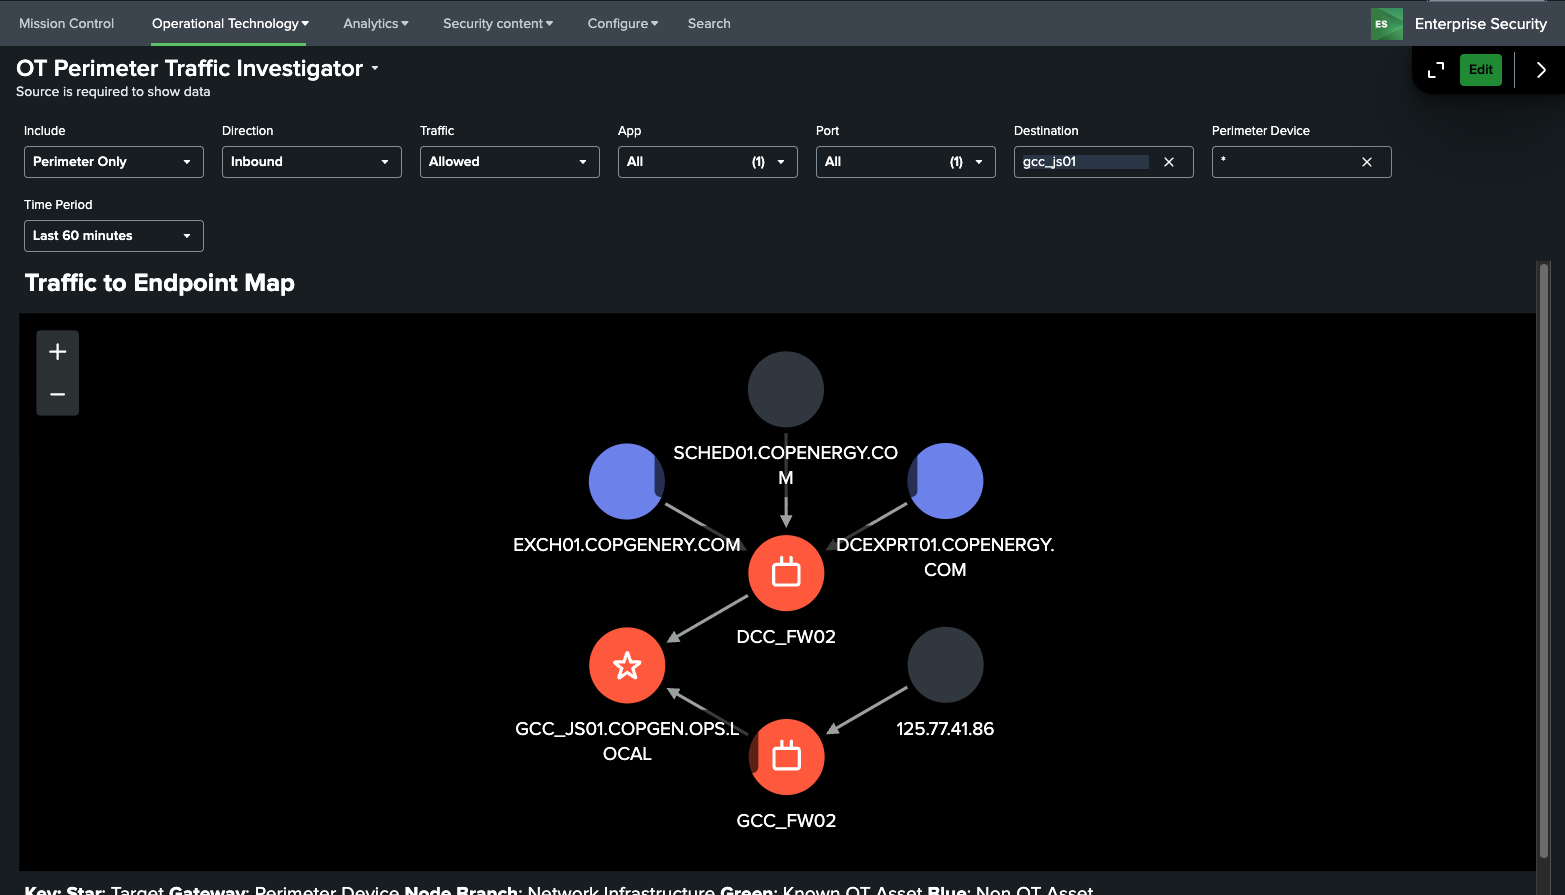
Traffic Investigator
This dashboard focuses on visually showing traffic paths between devices. It can be used to quickly identify how traffic is moving through perimeter devices to individual devices (inbound or outbound) as well as via networking equipment such as routers and switches. Perimeter devices are identified by the get_perimeter_devices macro and additional equipment can be specified via the macro get_perimeter_and_networking_devices macro.
Dependencies
- Asset & identity framework
- Data Models
- Network_Traffic
- Macros
- ot_identifier
- get_perimeter_devices
- get_asset_name
- get_asset_type
- get_perimeter_and_networking_devices
- Lookups
- industrial_ports
- interesting_ports_lookup
OT Infrastructure
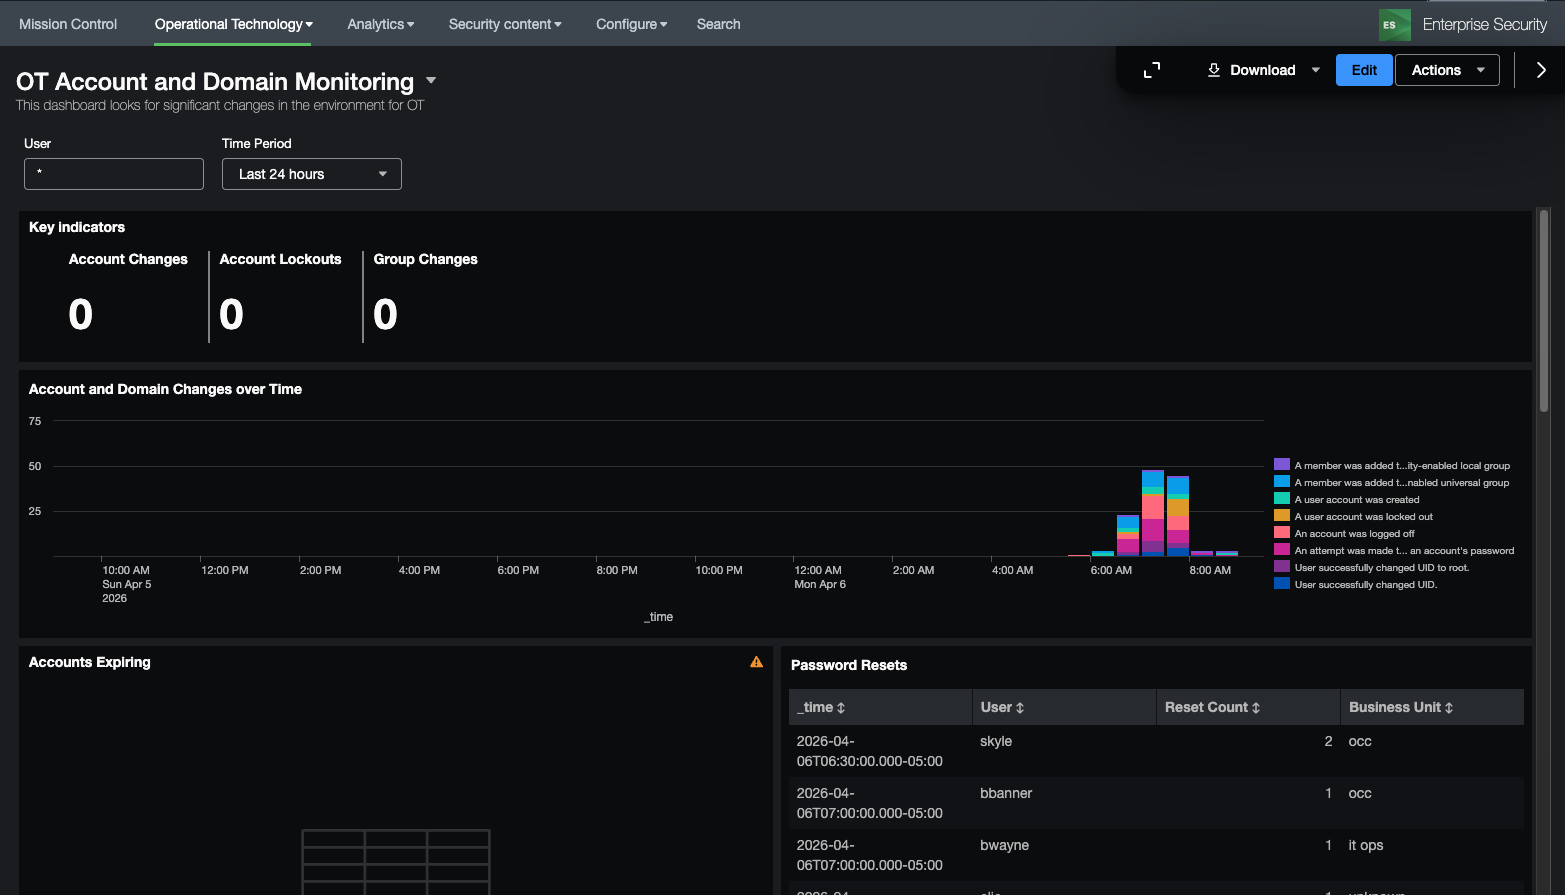
OT Account and Domain Monitoring
This dashboard focuses on monitoring account usage and changes as well as monitoring OT related domains. It provides information on invalid accounts, lockouts, password expiry, as well as information regarding group and other user account modifications.
Dependencies
- Asset & identity framework
- Indexes
- Windows security logs
- Data Models
- Changes
- Macros
- ot_identifier
- Lookups
- access_tracker
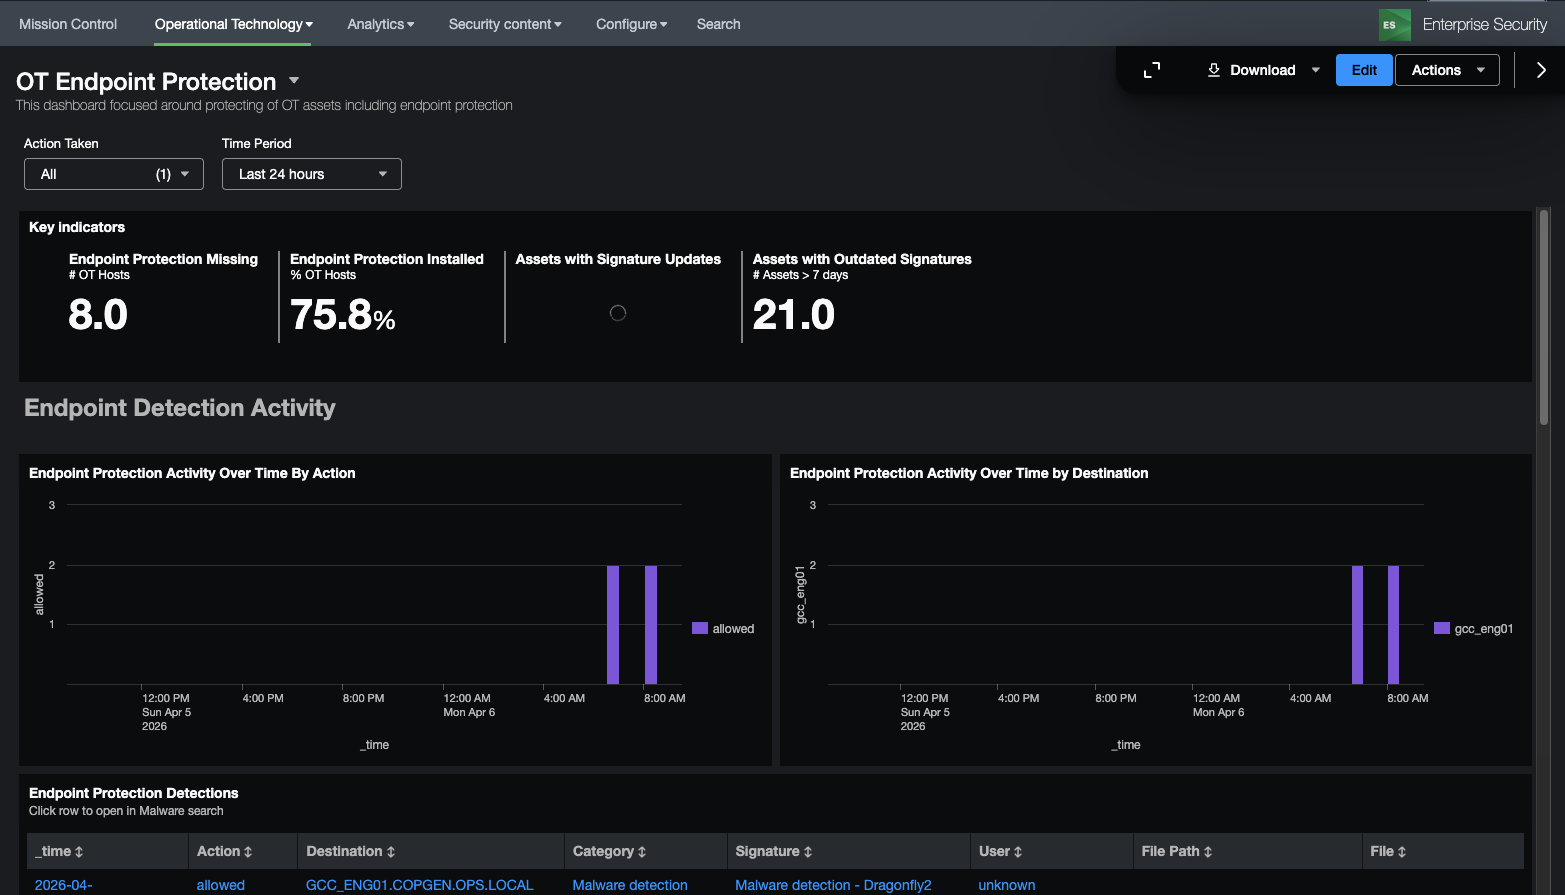
Endpoint Protection
This dashboard is focused on monitoring of endpoint protection products and ensuring that endpoints are adqueately protected. While many OT vendors do allow endpoint protection like antivirus, there are can be gaps in understanding how protected an entity might be. This dashboard is meant to provide information such as the kinds of endpoint protection activity occur, detections, as well as endpoints with no protection, outdated signatures, and last updates.
Dependencies
- Asset & identity framework
- Indexes
- Data Models
- Malware
- Macros
- get_asset_name
- ot_identifier
- Lookups
- malware_operations_tracker
OT External Media and Shares
This dashboard is designed to show the use of external media devices on OT Assets as well as File Shares. Both are known ways to bypass security controls or exploit hosts. It includes both successful and failed share access attempts and usage of external media devices over time.
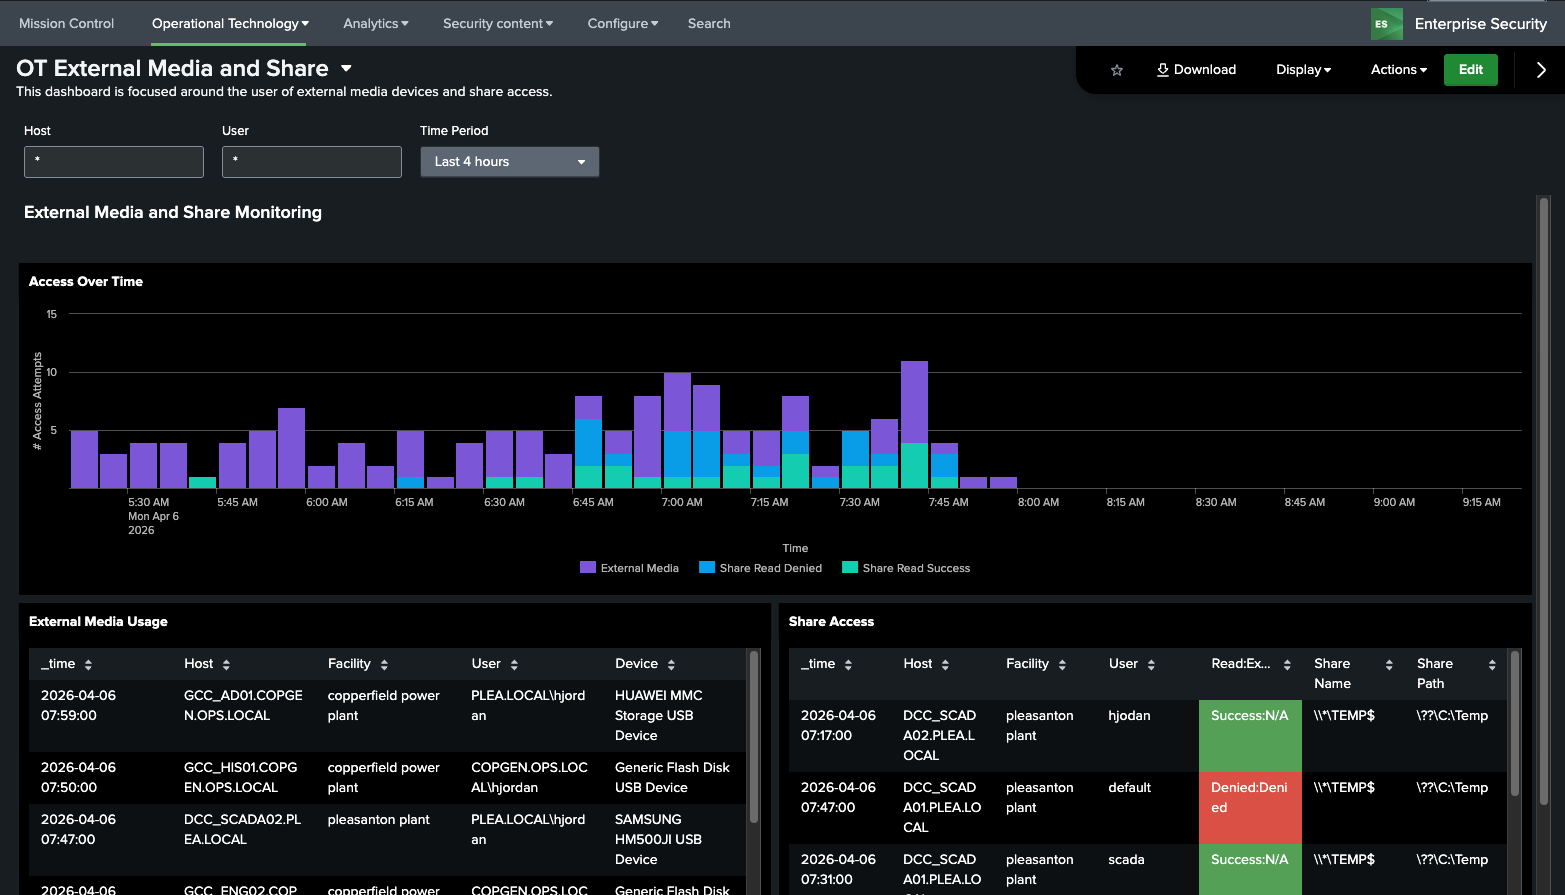
Dependencies - Asset & identity framework - Macros - get_share_info_windows_events - get_removable_media_indexes
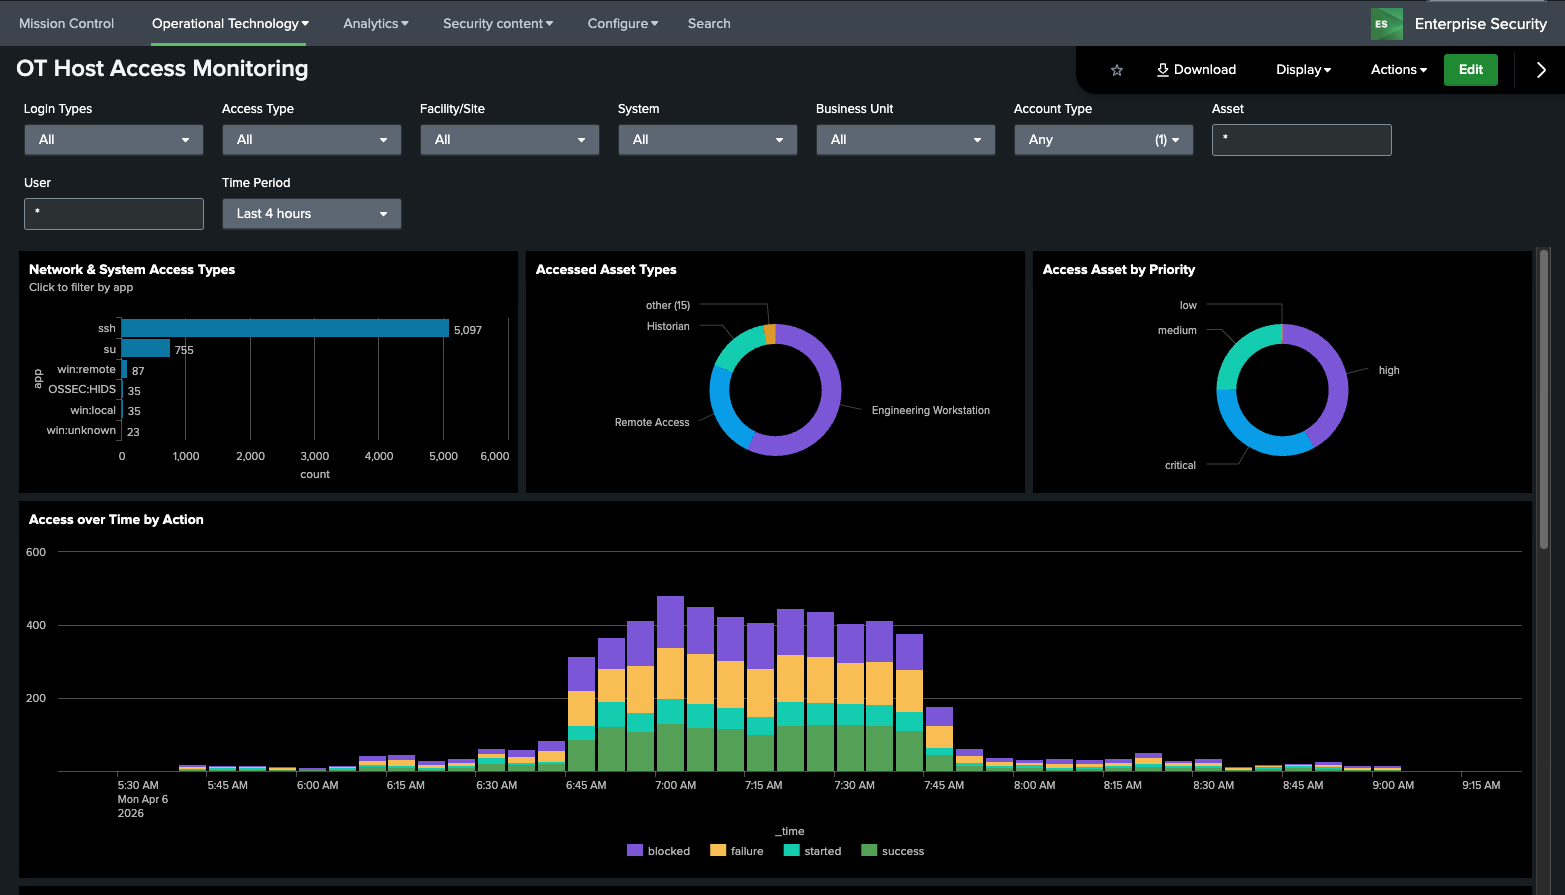
OT Host Access Monitoring
This dashboard is designed to show access by users to hosts in the OT environment. This includes both remote, local, and physical access to assets (across workstations, servers, databases, networking equipment, etc). This includes both successful as well as failed logins
Dependencies
- Asset & identity framework
- Indexes
- Data Models
- Authentication
- Macros
- get_asset_name
- get_asset_type
- ot_identifier
- Lookups
Configuration Baselining
Baseline Creation and Editing
There are two components in the OT Security Add-on that allow baselines to be created, the asset group editor and the baseline editor. To use the baseline editor, groups must first be set up. Several configurations for baselines come included with the OT Security Add-on:
- Endpoint – Applications
- Endpoint – Operating Systems
- Endpoint – Services
- Network – Port Configuration
- Hardware - Firmware
Custom baseline types are no longer supported as of version 3.0.1
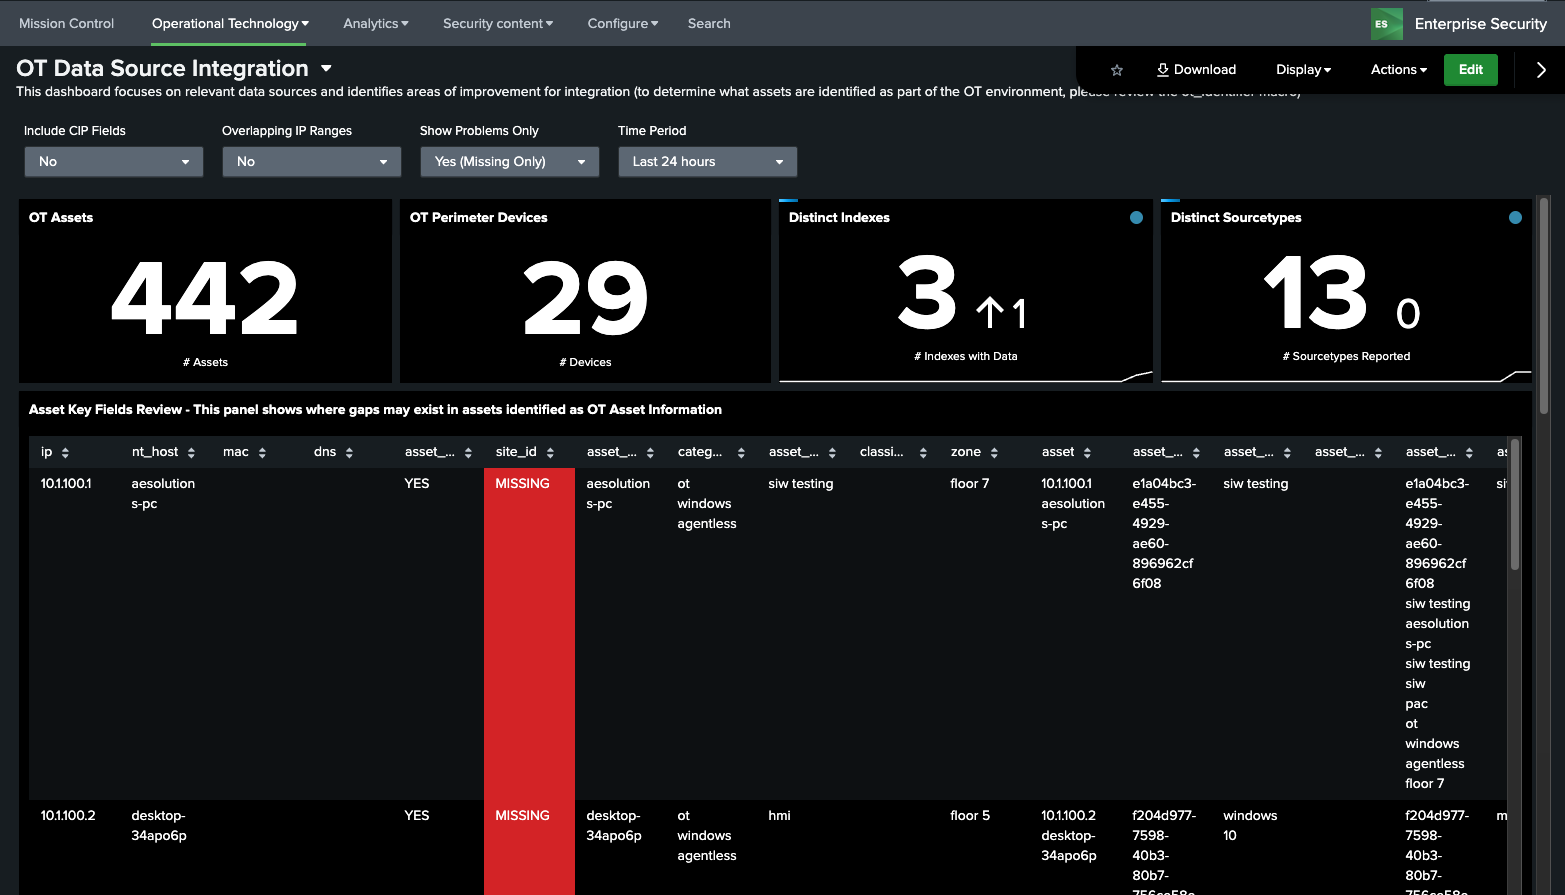
OT Tools - Data Source Integration
The OT Add-on for Splunk requires configuration, including parts of the Asset Framework and data sources which are used to populate the various dashboards and reports. This dashboard attempts to identify misconfigurations or missing data that may be impacting dashboards and reports from being populated correctly. In addition, all data sources should be mapped to specifified data models in the Getting Data In Section.
A table of key fields that must be populated are outlined in the section Configure the Asset Framework. The data sources recommended are explained in the section Important Data Sources.
OT Tools – Baselines - Asset group editor
This dashboard allows users to create groups of assets and then assign them baselines. This allows user to simplify the need to set up individual baselines for assets that leverage the same configurations. It leverages an interactive GUI for creating new groups, updating existing groups, delete existing groups. In addition, it provides an auditing mechanism for changes made to groups. The general flow for creating a new group is as follows:
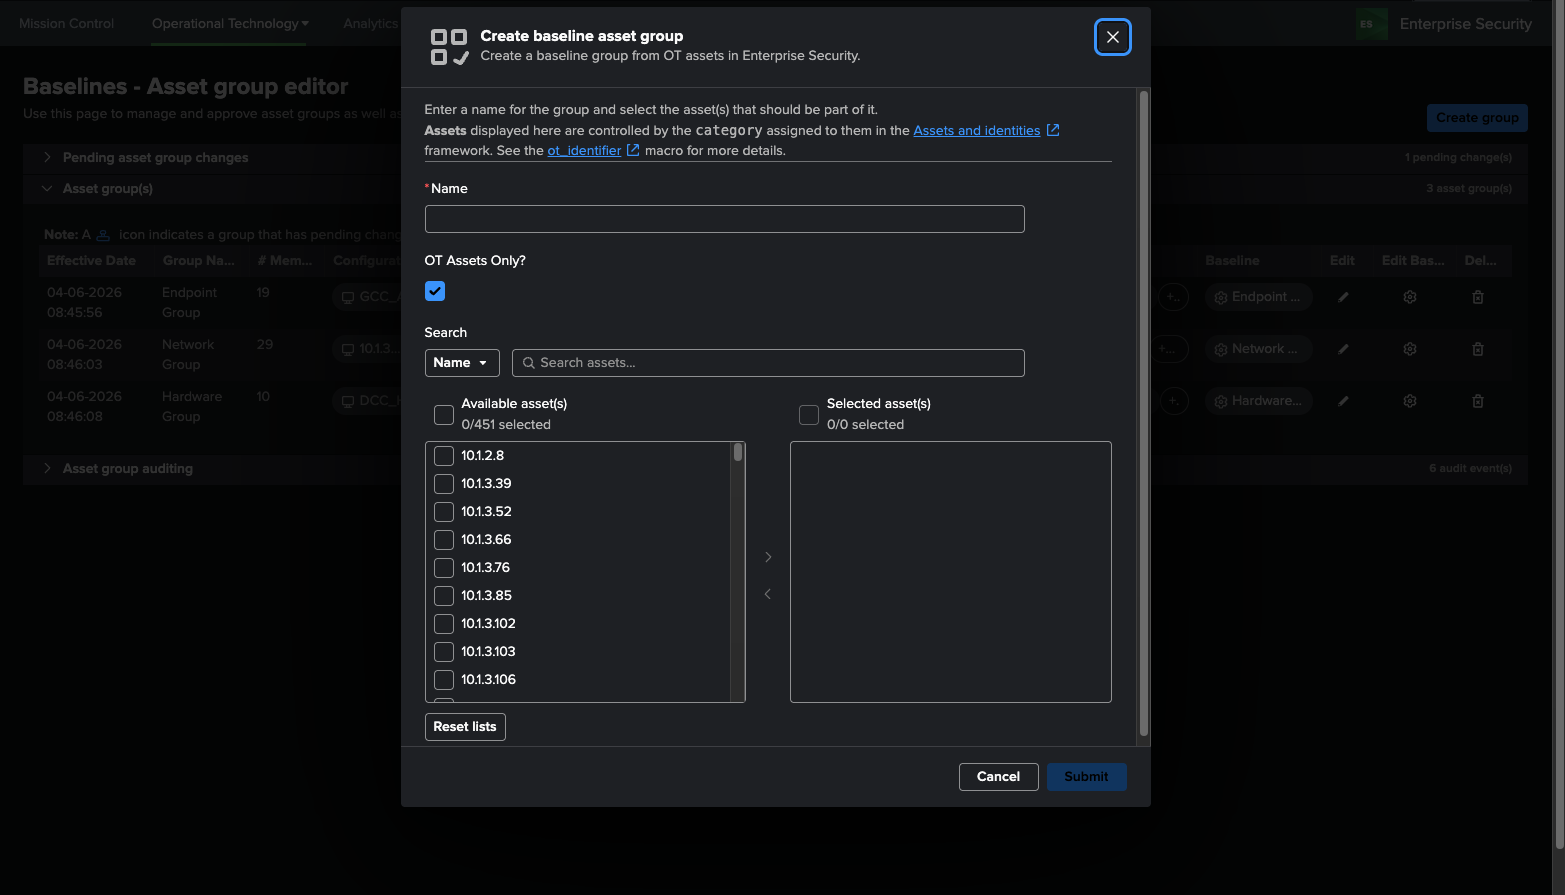
Create a group
- Click Create group on the top right corner
- Enter a group name, select which assets should be included, and click Submit
- The group should now be displayed under Pending asset group changes
Approve a pending group change
- Click the stamp under the Approve column of the group you want to approve
- Provide a comment in the text box, and click Submit
- The group is now moved from pending asset group changes to Asset group(s)
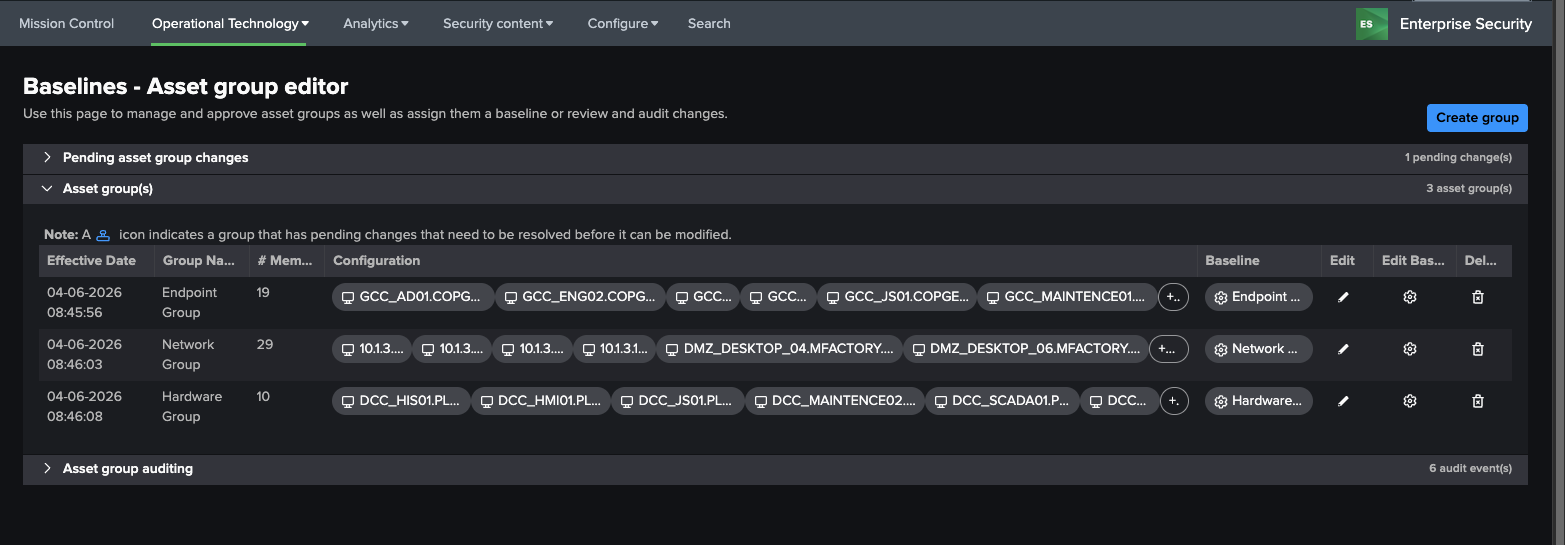
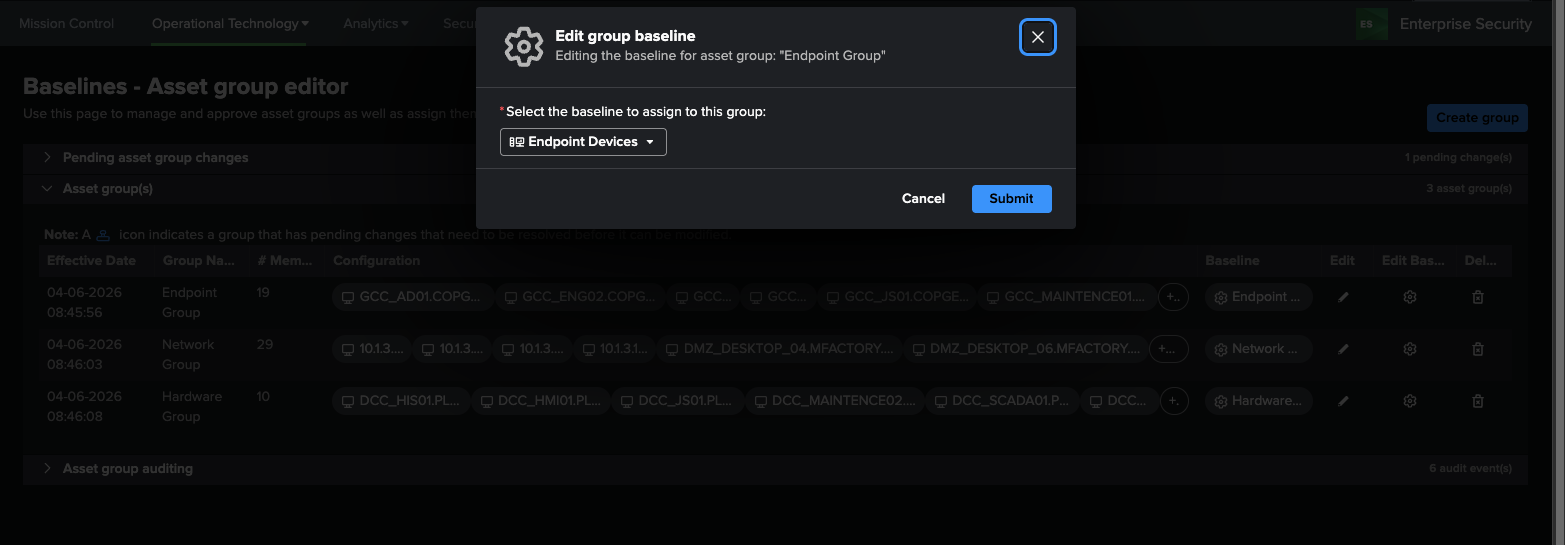
Link a asset group to a baseline
Once a baseline is created using the Baseline Editor, a baaseline can then be assigned to a group.
- Click the gear icon under the Edit Baseline column in the Asset group(s) table.
- Select a baseline from the dropdown and click Submit
Dependencies - Asset & identity framework - Lookups - group_baseline_definitions: stores approved group names - audit_group_baseline_definitions: stores group deletion and modification activity
OT Tools – Baseline builder
This dashboards displays existing baselines. For example, a group name SCADA devices can be configured to allow a user to identify what applications should be installed on these hosts. This is then used to identify deviations on members of the group.
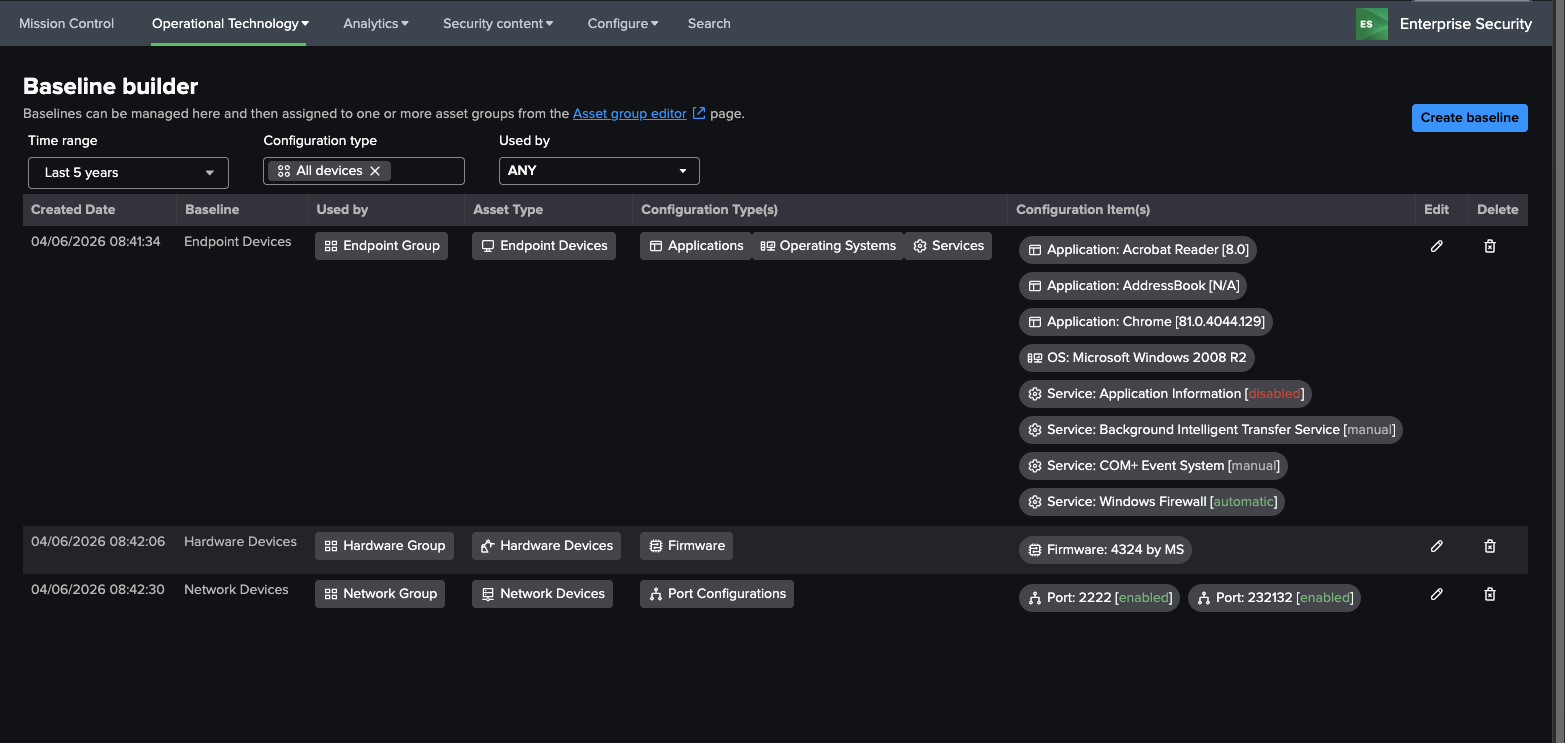
To create baselines, click the Create baseline button on the top right corner and follow the instructions below.
OT Tools – Baseline Editor
This dashboard is used to create baselines and can be accessed through the Baseline builder page.

There are two ways to add to the baseline: manually or adding from data.
Manual Entry
Click the (+) icon below the baseline types and enter the required inputs.
Add from Data
- Click Add from data next to the baseline types
- A search query is automatically run with a lookback of 4 hours. This can be modified by opening the Advanced tab.
- Select rows to be included into the baseline, then click Add selected
Dependencies - Asset & identity framework - Lookups - baseline_definitions: stores approved baseline definitions - audit_baseline_definitions: stores all baseline creation and modification activity