SC4S Metrics and Events Dashboard
The SC4S Metrics and Events dashboard lets you monitor metrics and event flows for all SC4S instances sending data to a chosen Splunk platform.
Functionalities
Overview metrics
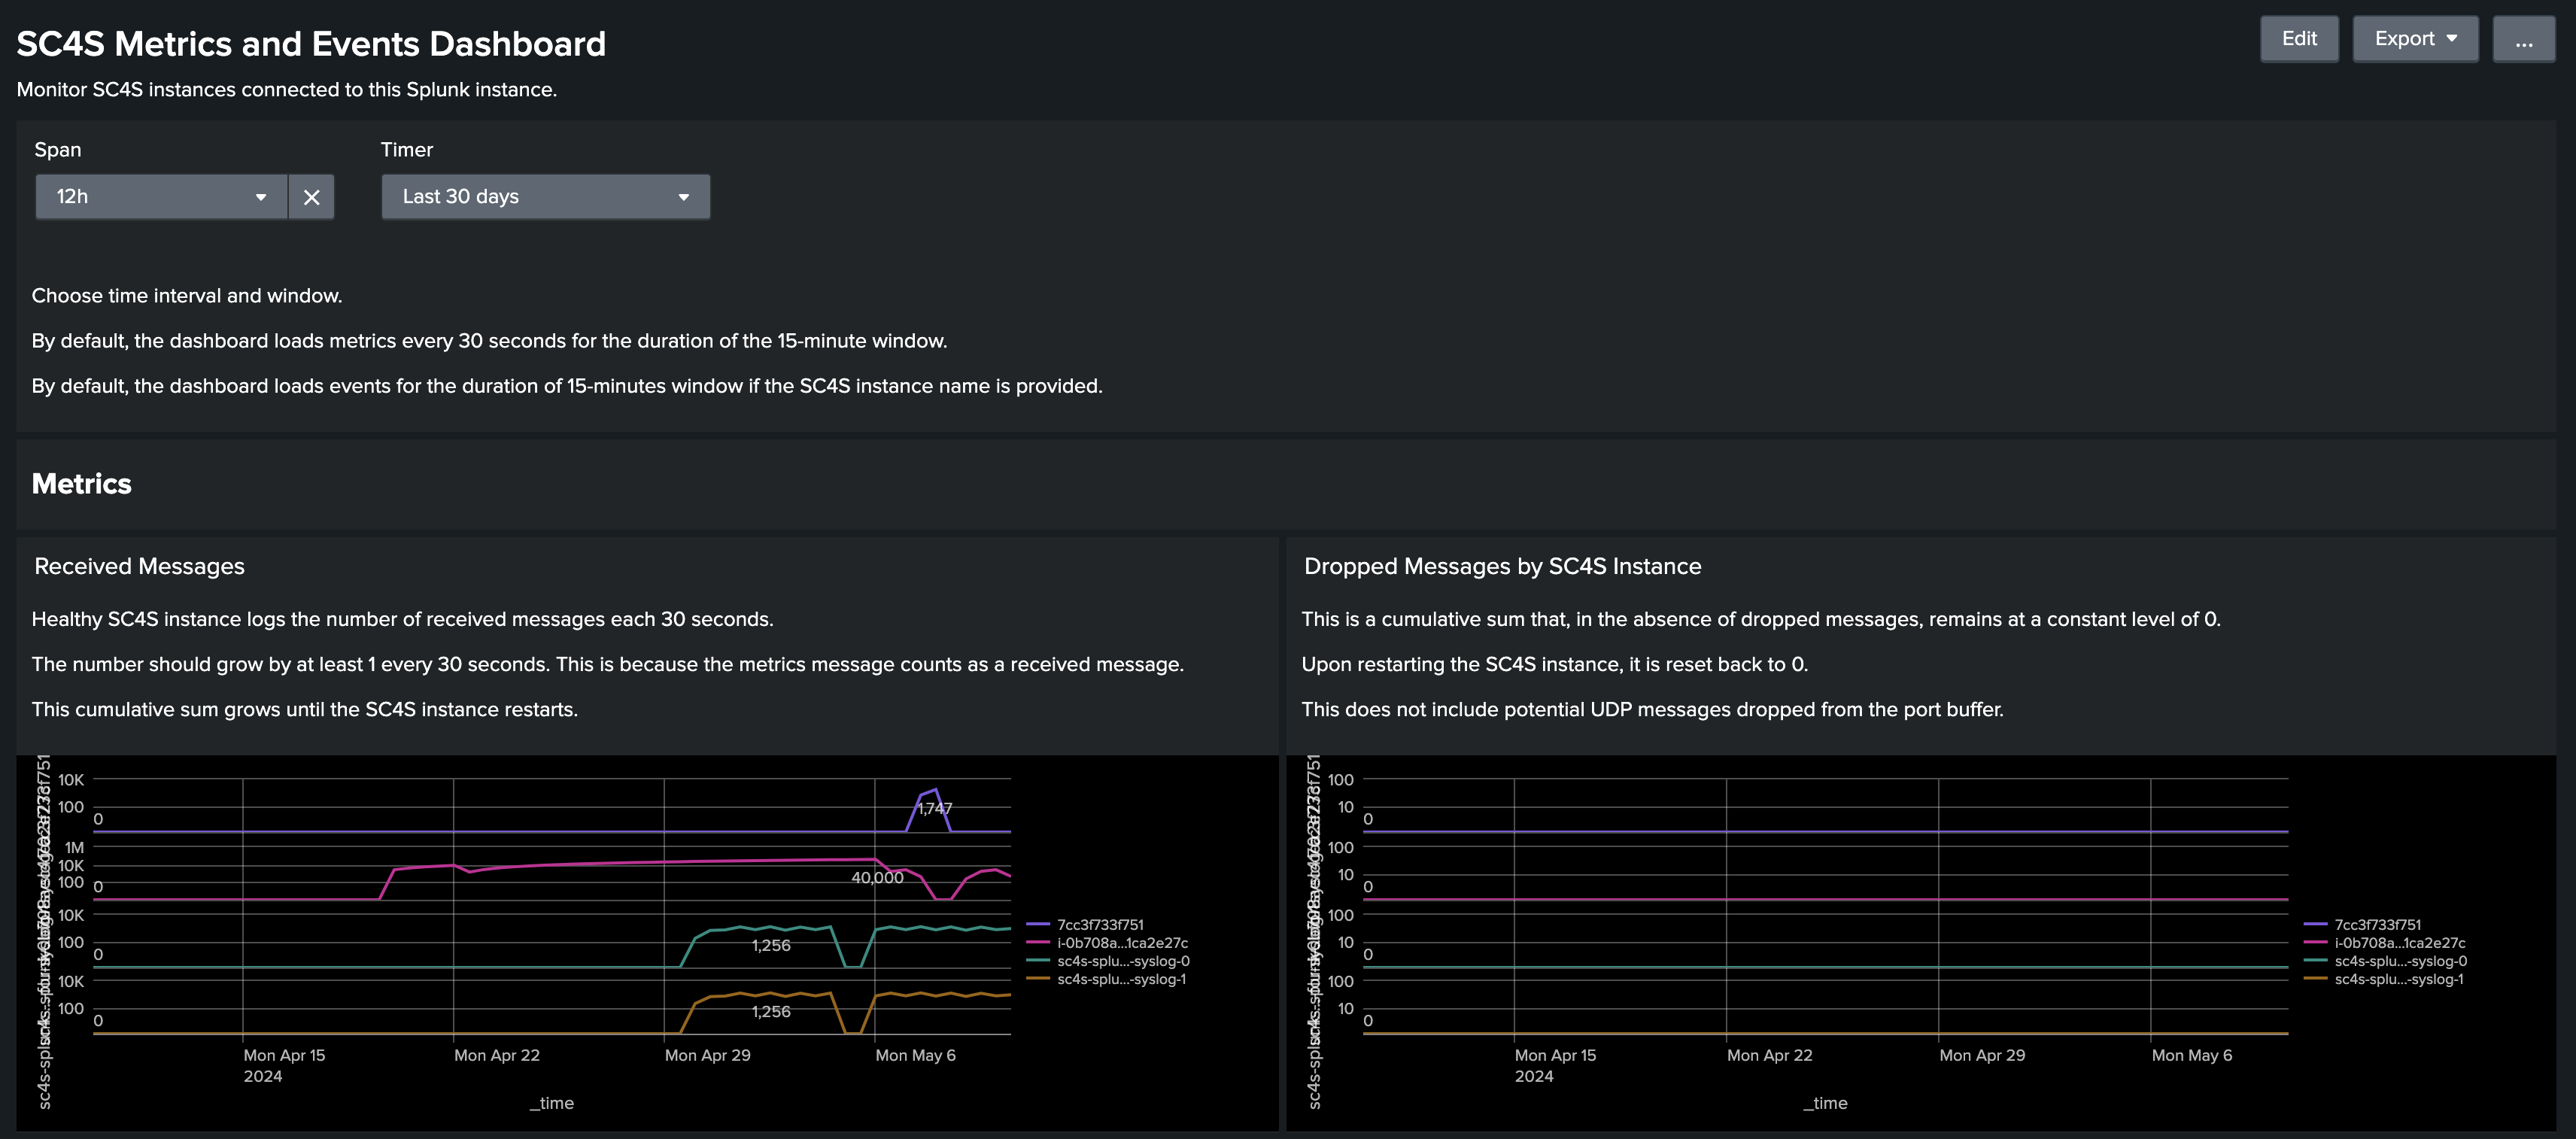 The SC4S and Metrics Overview dashboard displays the cumulative sum of received and dropped messages for all SC4S instances in a chosen interval for the specified time range. By default the interval is set to 30 seconds and the time range is set to 15 minutes.
The Received Messages panel can be used as a heartbeat metric. A healthy SC4S instance should send at least one message per 30 seconds. This metrics message is included in the count.
Keep the Dropped Messages panel at a constant level of 0. If SC4S drops messages due to filters, slow performance, or for any other reason, the number of dropped messages will persist until the instance restarts. The Dropped Messages panel does not include potential UDP messages dropped from the port buffer, which SC4S is not able to track.
Single instance metrics
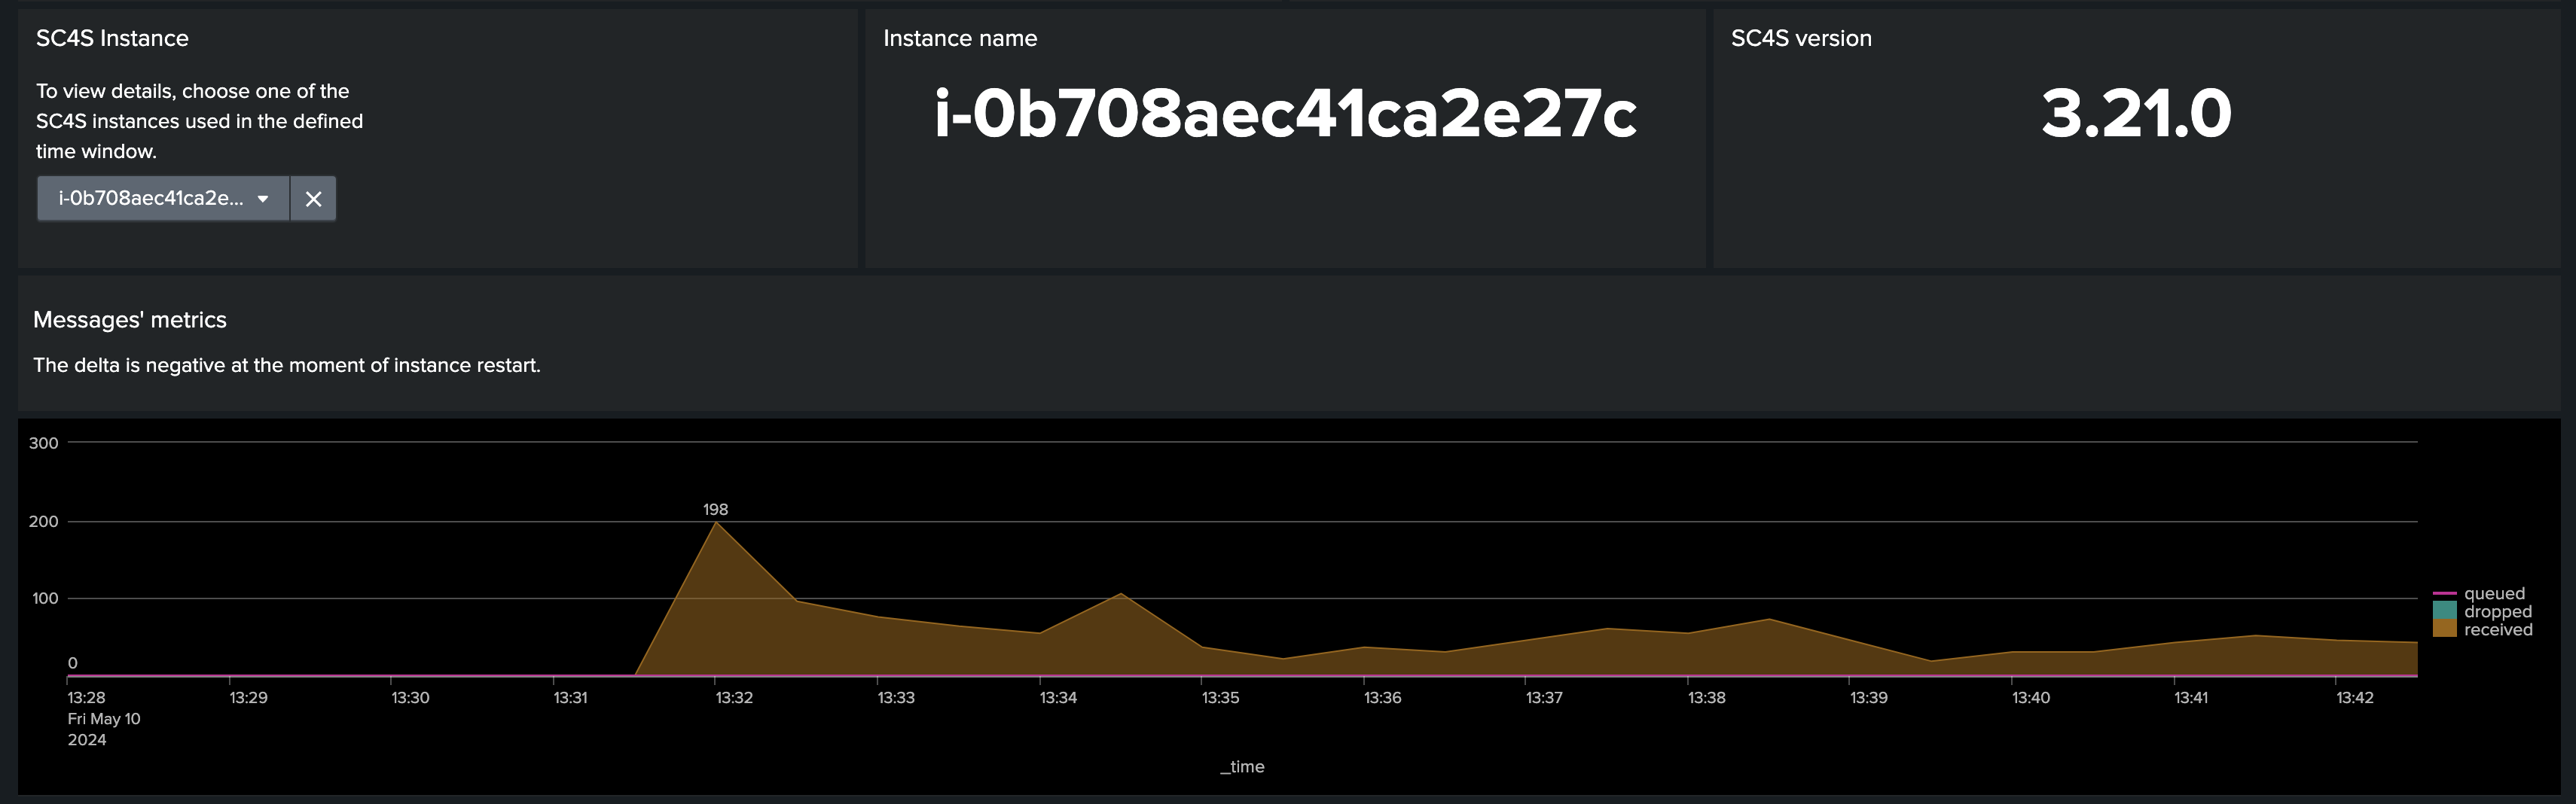 You can display the instance name and SC4S version for a specific SC4S instance (available in versions 3.16.0 and later).
This dashboard also displays a timechart of deltas for received, queued, and dropped messages for a specific SC4S instance.
Single instance events
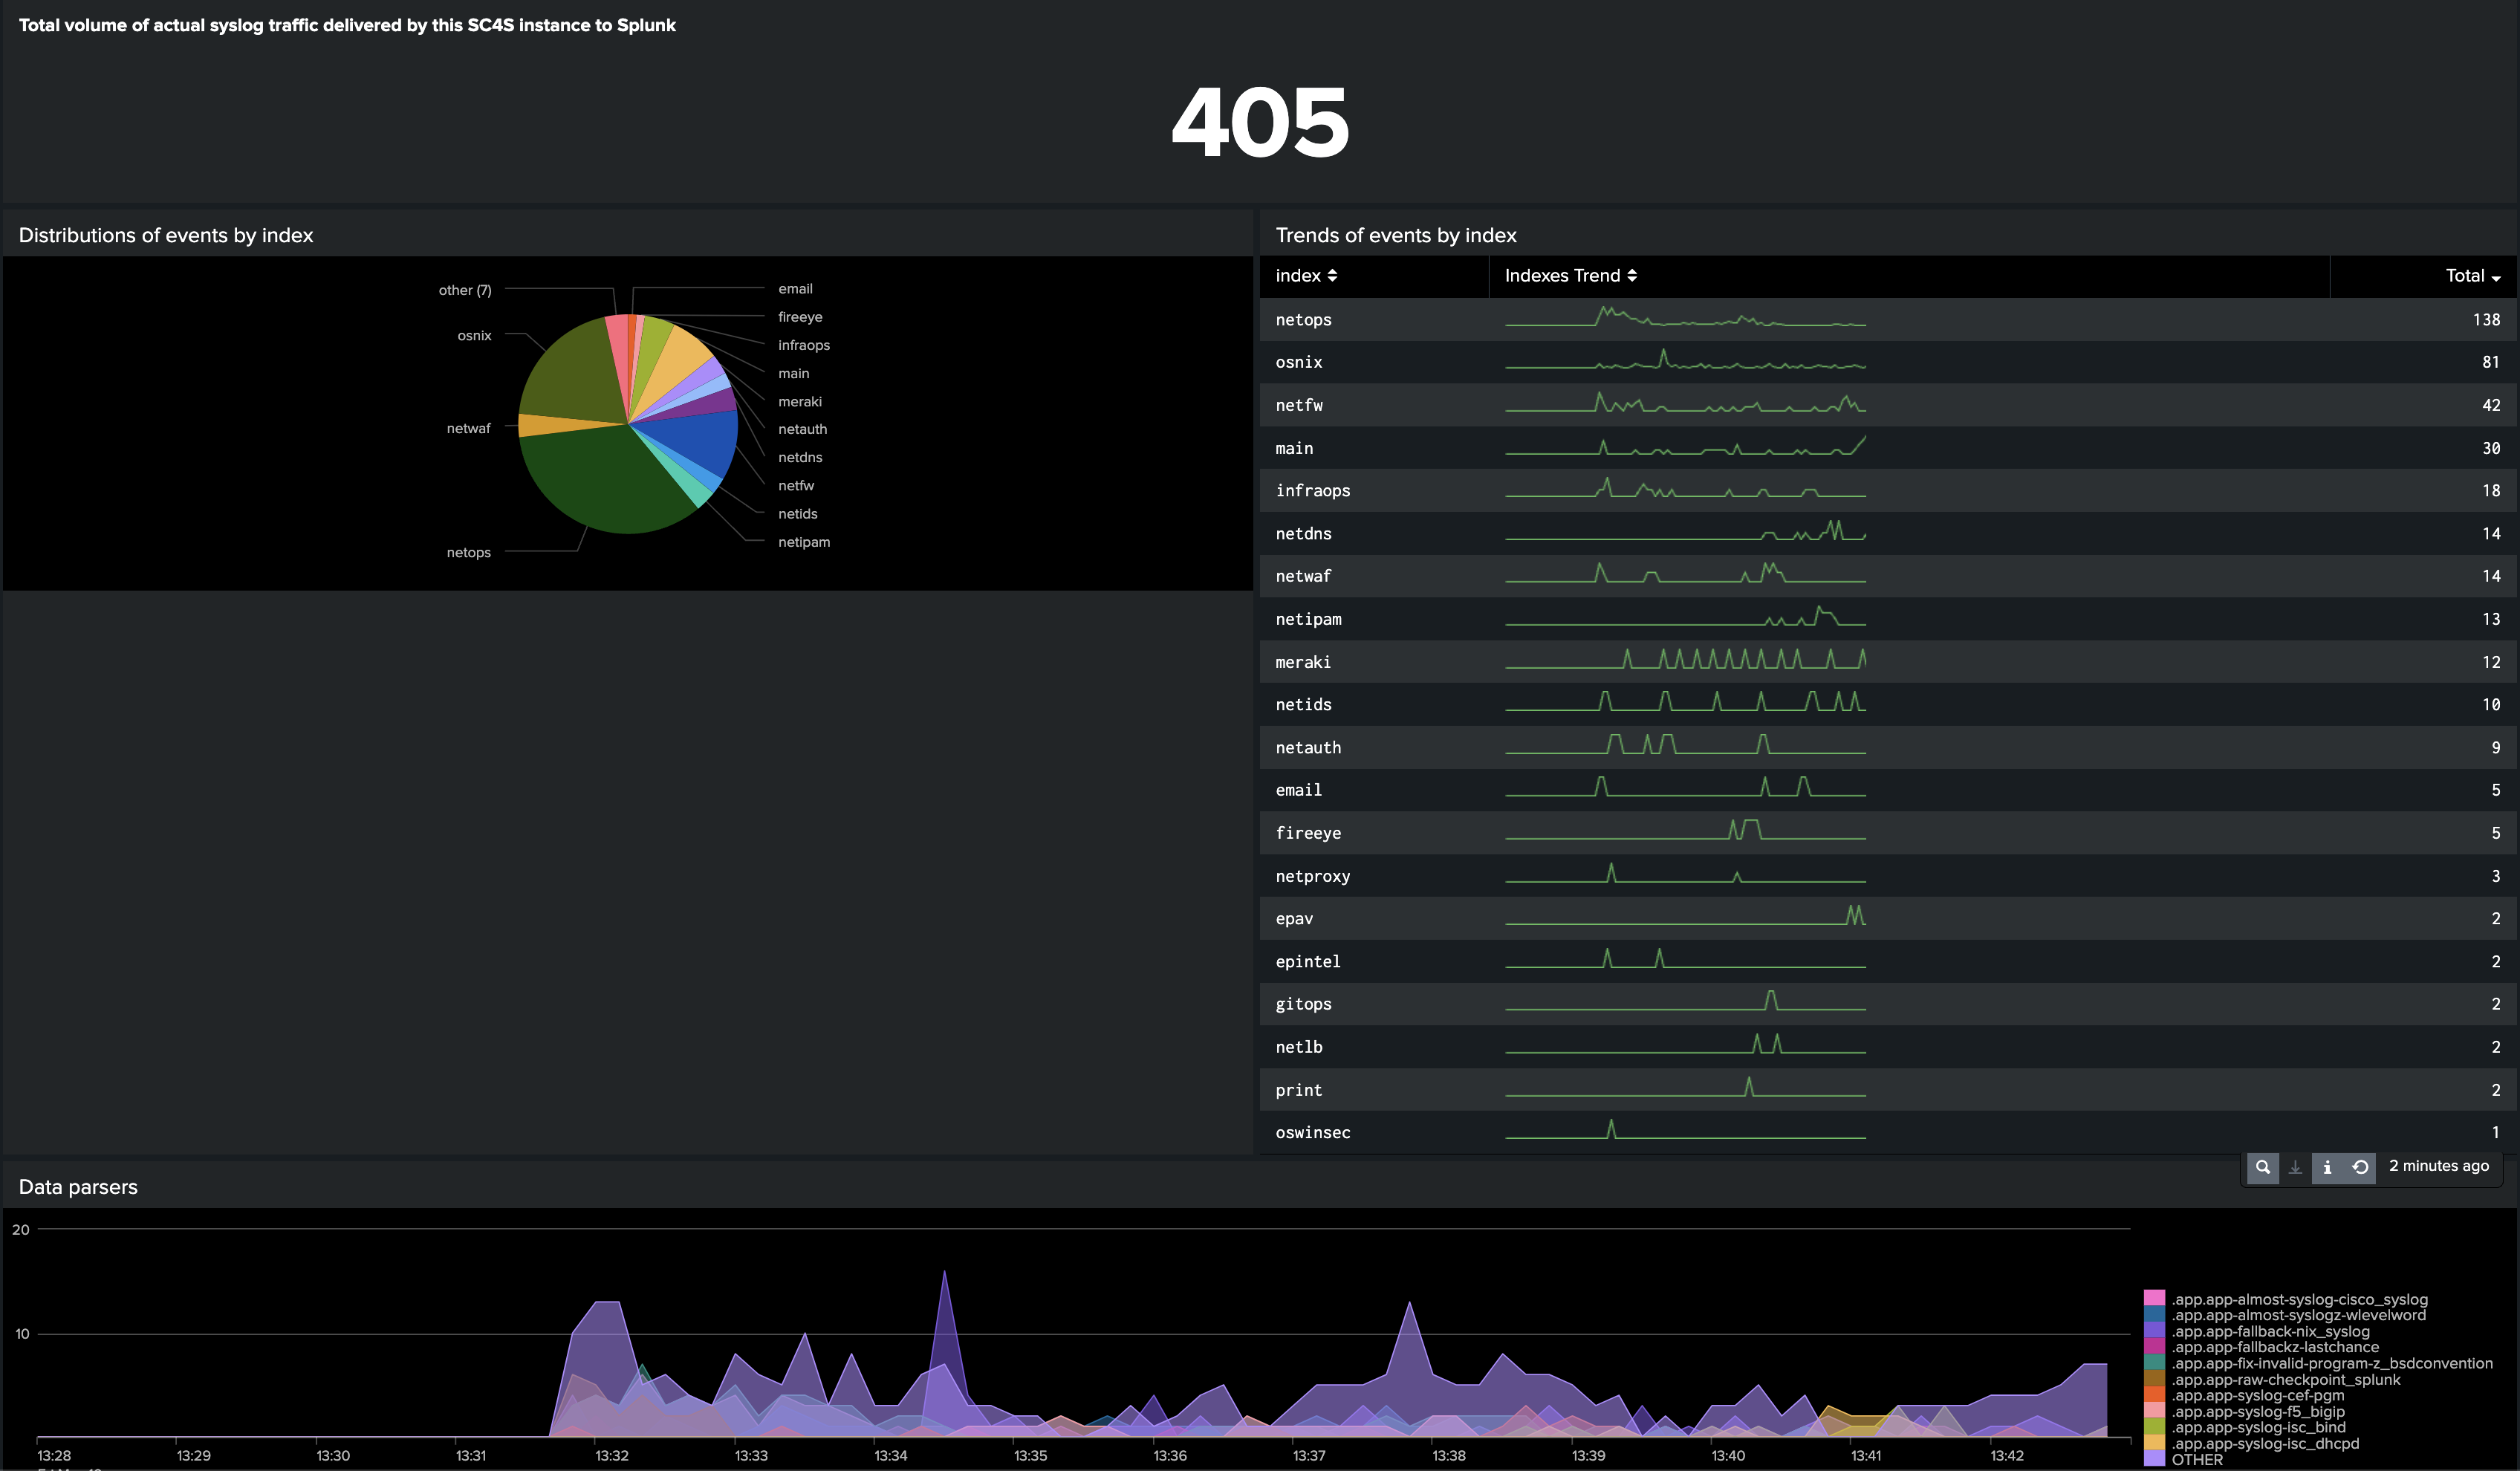 You can analyze traffic processed by an SC4S instance by visualizing the following events data:
- total number of events
- distributions of events by index
- trends of events by index
- data parsers in use
- applied tags
Install the dashboard
- In Splunk platform open Search -> Dashboards.
- Click on Create New Dashboard and make an empty dashboard. Be sure to choose Classic Dashboards.
- In the “Edit Dashboard” view, go to Source and replace the initial xml with the contents of dashboard/dashboard.xml published in the SC4S repository.
- Saving your changes. Your dashboard is ready to use.