SC4S Logging and Troubleshooting Resources
Helpful Linux and container commands
Linux service (systemd) commands
- Check service status:
systemctl status sc4s - Start service:
systemctl start service - Stop service:
systemctl stop service - Restart service:
systemctl restart service - Enable service at boot:
systemctl enable sc4s - Query the system journal:
journalctl -b -u sc4s
Container commands
All of the following container commands can be run with the podman or docker runtime.
- Access container logs:
sudo podman logs SC4S - Execute into an SC4S container:
podman exec -it SC4S bash - Rebuild an SC4S volume:
podman volume rm splunk-sc4s-var podman volume create splunk-sc4s-var - Pull an image or a repository from a registry:
podman pull ghcr.io/splunk/splunk-connect-for-syslog/container3 - Remove unused data:
podman system prune - Load an image from a .tar archive or STDIN:
podman load <tar>
Test commands
Check your SC4S port using the nc command. Run this command where SC4S is hosted and check data in Splunk for success and failure:
echo '<raw_sample>' |nc <host> <port>
Obtain raw message events
During development or troubleshooting, you may need to obtain samples of the messages exactly as they are received by
SC4S. These events contain the full syslog message, including the <PRI> preamble, and are different from messages that have been
processed by SC4S and Splunk.
These raw messages help to determine that SC4S parsers and filters are operating correctly, and are needed for playback when testing. The community supporting SC4S will always first ask for raw samples before any development or troubleshooting exercise.
Here are some options for obtaining raw logs for one or more sourcetypes:
-
Run
tcpdumpon the collection interface and display the results in ASCII. You will see events similar to the following buried in the packet contents:<165>1 2007-02-15T09:17:15.719Z router1 mgd 3046 UI_DBASE_LOGOUT_EVENT [junos@2636.1.1.1.2.18 username="user"] User 'user' exiting configuration mode -
Obtain a raw log message using Wireshark. Once you get your stream of messages, copy one of them. Note that in UDP there are not usually any message separators. You can also read the logs using Wireshark from the .pcap file. From Wireshark go to Statistics > Conversations, then click on
Follow Stream: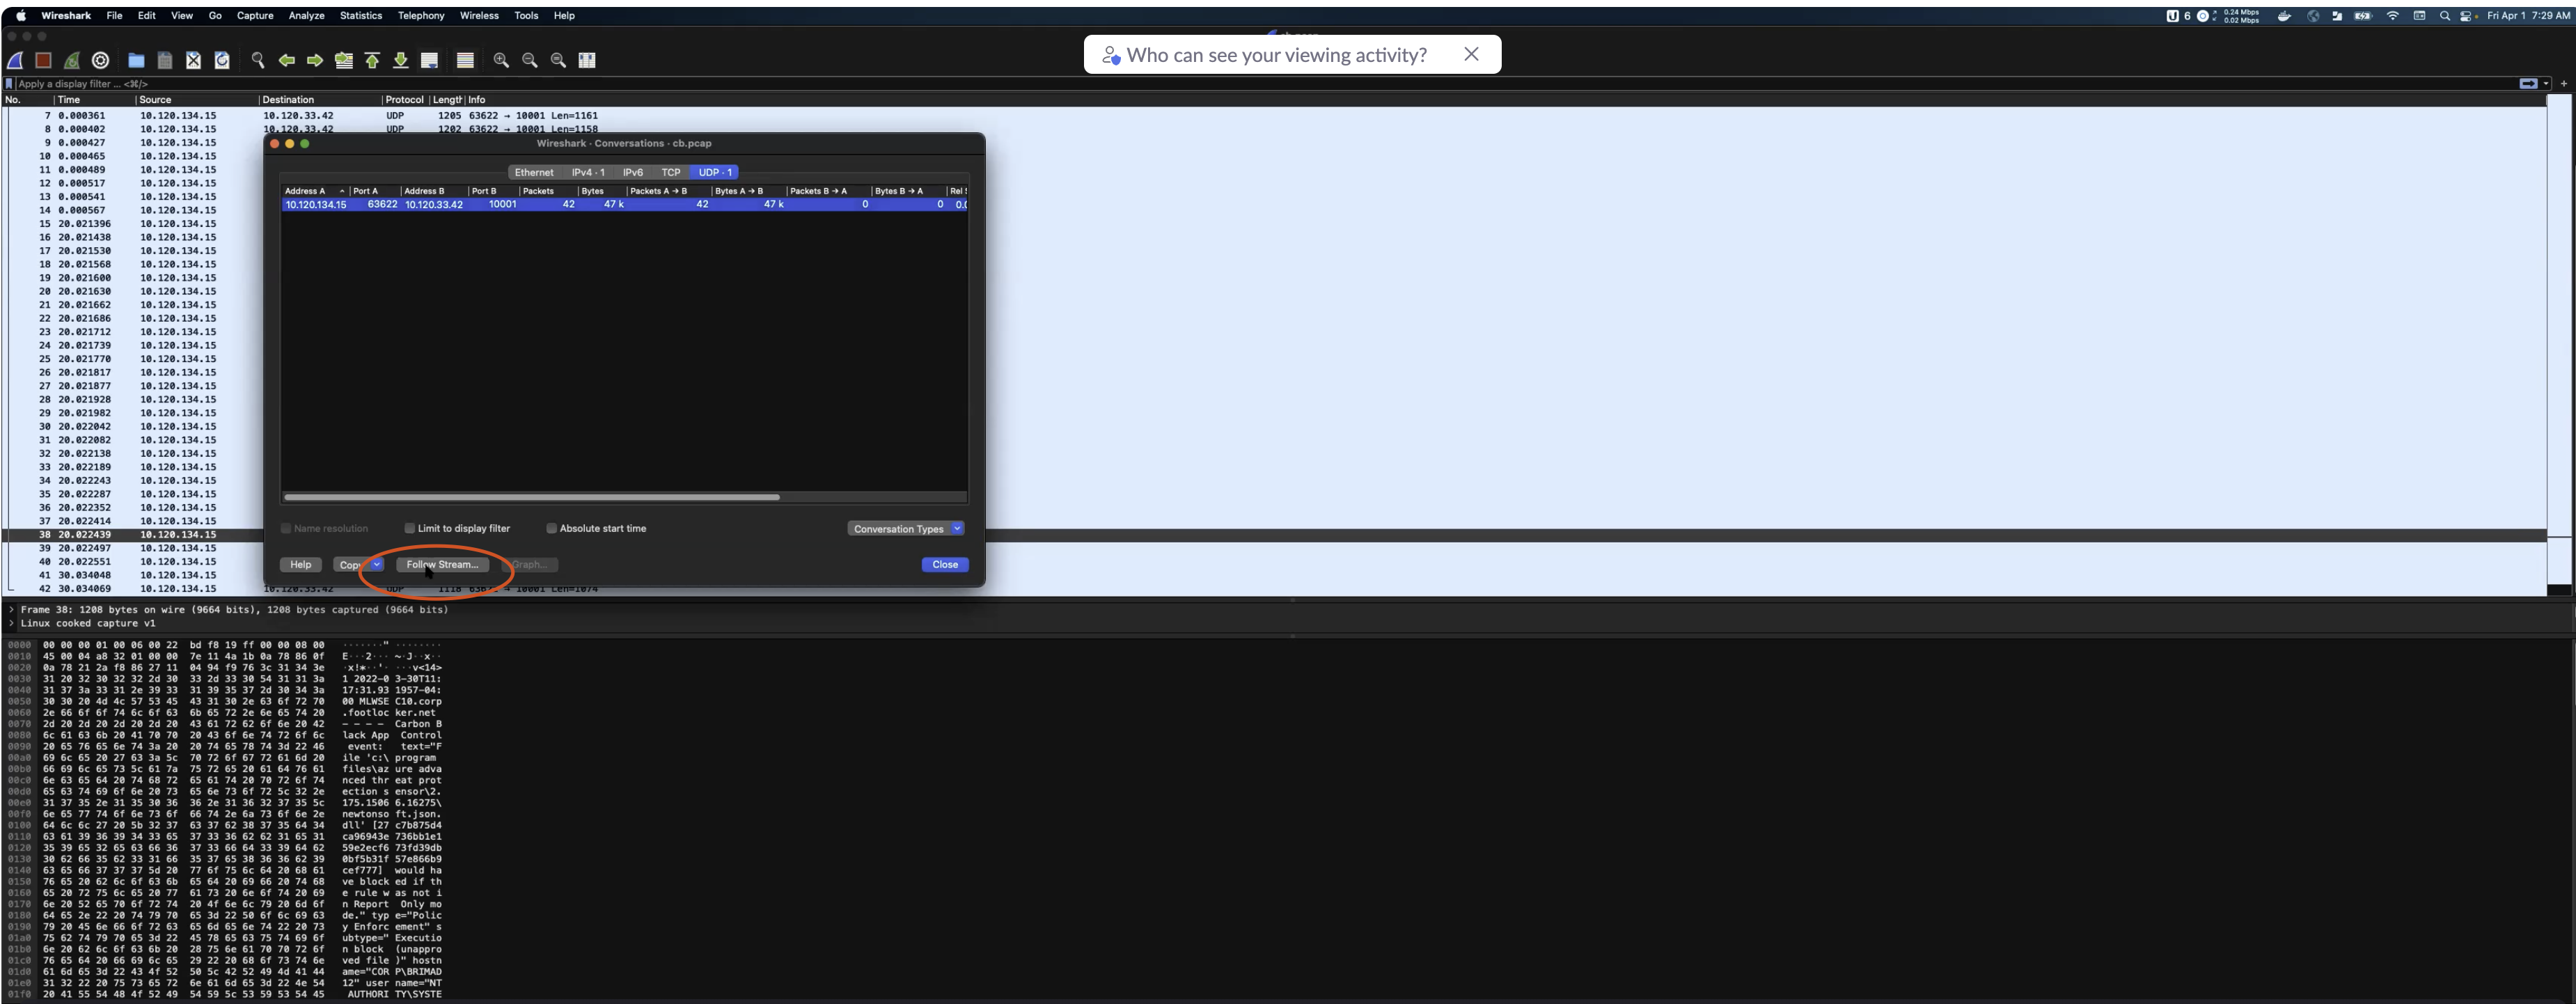
-
Edit
env_fileto set the variableSC4S_SOURCE_STORE_RAWMSG=yesand restart SC4S. This stores the raw message in a syslog-ng macro calledRAWMSGand is displayed in Splunk for allfallbackmessages.-
For most other sourcetypes, the
RAWMSGis not displayed, but can be viewed by changing the output template to one of the JSON variants, including t_JSON_3164 or t_JSON_5424, depending on RFC message type. See Configure SC4S metadata for more details. -
In order to send
RAWMSGto Splunk regardless of the sourcetype you can also temporarily place the following final filter in the local parser directory:Once you have editedblock parser app-finalfilter-fetch-rawmsg() { channel { rewrite { r_set_splunk_dest_default( template('t_fallback_kv') ); }; }; }; application app-finalfilter-fetch-rawmsg[sc4s-finalfilter] { parser { app-finalfilter-fetch-rawmsg(); }; };SC4S_SOURCE_STORE_RAWMSG=yesin/opt/sc4s/env_fileand thefinalfilterplaced in/opt/sc4s/local/config/app_parsers, restart the SC4S instance to add raw messages to all the messages sent to Splunk.
NOTE: Be sure to turn off the
RAWMSGvariable when you are finished, because it doubles the memory and disk requirements of SC4S. Do not useRAWMSGin production.- You can enable the alternate destination
d_rawmsgfor one or more sourcetypes. This destination will write the raw messages to the container directory/var/lib/syslog-ng/archive/rawmsg/<sourcetype>, which is typically mapped locally to/opt/sc4s/archive. Within this directory, the logs are organized by host and time.
-
Run exec into the container (advanced task)
You can confirm how the templating process created the actual syslog-ng configuration files by calling exec into the container
and navigating the syslog-ng config filesystem directly. To do this, run
/usr/bin/podman exec -it SC4S /bin/bash
/opt/syslog-ng/etc/ to see the actual configuration files in use. If you are familiar with container operations and syslog-ng, you can modify files directly and reload syslog-ng with the command kill -1 1 in the container.
You can also run the /entrypoint.sh script, or a subset of it, such as everything
but syslog-ng, and have complete control over the templating and underlying syslog-ng process.
This is an advanced topic and further help can be obtained through the github issue tracker and Slack channels.
Keeping a failed container running (advanced topic)
To debug a configuration syntax issue at startup, keep the container running after a syslog-ng startup failure.
In order to facilitate troubleshooting and make syslog-ng configuration changes from within a running container, the container
can be forced to remain running when syslog-ng fails to start (which normally terminates the container). To enable this, add
SC4S_DEBUG_CONTAINER=yes to the env_file. Use this capability in conjunction with exec calls into the container.
NOTE: Do not enable the debug container mode while running out of systemd. Instead, run the container manually from the CLI, so that you can use the
podman or docker commands needed to start, stop, and clean up cruft left behind by the debug process.
Only when SC4S_DEBUG_CONTAINER is set to “no” (or completely unset) should systemd startup processing resume.
Fix time zones
Time zone mismatches can occur if SC4S and logHost are not in same time zones. To resolve this,
create a filter using sc4s-lp-dest-format-d_hec_fmt, for example:
#filename: /opt/sc4s/local/config/app_parsers/rewriters/app-dest-rewrite-fix_tz_something.conf

block parser app-dest-rewrite-checkpoint_drop-d_fmt_hec_default() {
    channel {
            rewrite { fix-time-zone("EST5EDT"); };
    };
};
application app-dest-rewrite-fix_tz_something-d_fmt_hec_default[sc4s-lp-dest-format-d_hec_fmt] {
    filter {
        match('checkpoint' value('fields.sc4s_vendor') type(string))                 <- this must be customized
        and match('syslog' value('fields.sc4s_product') type(string))                <- this must be customized
        and match('Drop' value('.SDATA.sc4s@2620.action') type(string))              <- this must be customized
        and match('12.' value('.SDATA.sc4s@2620.src') type(string) flags(prefix) );  <- this must be customized

    };
    parser { app-dest-rewrite-checkpoint_drop-d_fmt_hec_default(); };
};
If destport, container, and proto are not available in indexed fields, you can create a post-filter:
#filename: /opt/sc4s/local/config/app_parsers/rewriters/app-dest-rewrite-fix_tz_something.conf

block parser app-dest-rewrite-fortinet_fortios-d_fmt_hec_default() {
    channel {
            rewrite {
                  fix-time-zone("EST5EDT");
            };
    };
};

application app-dest-rewrite-device-d_fmt_hec_default[sc4s-postfilter] {
    filter {
         match("xxxx", value("fields.sc4s_destport") type(glob));  <- this must be customized
    };
    parser { app-dest-rewrite-fortinet_fortios-d_fmt_hec_default(); };
};
The parser accepts time zone in formats: “America/New York” or “EST5EDT”, but not in short form such as “EST”.
Issue: CyberArk log problems
When data is received on the indexers, all events are merged together into one event. Check the following link for CyberArk configuration information: https://cyberark-customers.force.com/s/article/00004289.
Issue: SC4S events drop when another interface is used to receive logs
When a second or alternate interface is used to receive syslog traffic, RPF (Reverse Path Forwarding) filtering in RHEL, which is configured as default configuration, may drop events. To resolve this, add a static route for the source device to point back to the dedicated syslog interface. See https://access.redhat.com/solutions/53031.
Issue: Splunk does not ingest SC4S events from other virtual machines
When data is transmitted through an echo message from the same instance, data is sent successfully to Splunk. However, when the echo is sent from a different instance, the data may not appear in Splunk and the errors are not reported in the logs. To resolve this issue, check whether an internal firewall is enabled. If an internal firewall is active, verify whether the default port 514 or the port which you have used is blocked. Here are some commands to check and enable your firewall:
#To list all the firewall ports
sudo firewall-cmd --list-all
#to enable 514 if its not enabled
sudo firewall-cmd --zone=public --permanent --add-port=514/udp
sudo firewall-cmd  --reload