Create a parser
The following is a step-by-step guide for adding new parsers.
Why create a parser?
Splunk Connect for Syslog can offload Splunk Indexers by performing operations that normally would have been done during index time, including linebreaking, source/sourcetype setting, and timestamping. Creating a parser also reduces the need of using corresponding add-ons on indexers.
Before you start
- Make sure you have read contribution standards.
- For more background information on how filters and parser work, and what suits you best, read about sources onboarding.
- Prepare your environment.
- Create a new branch in the repository where you will apply your changes.
Start with a raw log message
If you already have a raw log message, you can skip this step. Otherwise, you need to extract one to have something to work with. You can do this in multiple ways; here is a brief description of two of them:
tcpdump
You can use the tcpdump command to get incoming raw messages on a given port of your server.
tcpdump -n -s 0 -S -i any -v port 8088

tcpdump: listening on any, link-type LINUX_SLL (Linux cooked), capture size 262144 bytes
09:54:26.051644 IP (tos 0x0, ttl 64, id 29465, offset 0, flags [DF], proto UDP (17), length 466)
10.202.22.239.41151 > 10.202.33.242.syslog: SYSLOG, length: 438
Facility local0 (16), Severity info (6)
Msg: 2022-04-28T16:16:15.466731-04:00 NTNX-21SM6M510425-B-CVM audispd[32075]: node=ntnx-21sm6m510425-b-cvm type=SYSCALL msg=audit(1651176975.464:2828209): arch=c000003e syscall=2 success=yes exit=6 a0=7f2955ac932e a1=2 a2=3e8 a3=3 items=1 ppid=29680 pid=4684 auid=1000 uid=0 gid=0 euid=0 suid=0 fsuid=0 egid=0 sgid=0 fsgid=0 tty=(none) ses=964698 comm=“sshd” exe=“/usr/sbin/sshd” subj=system_u:system_r:sshd_t:s0-s0:c0.c1023 key=“logins”\0x0a
Wireshark
Or you can read the logs using Wireshark from the .pcap file. From Wireshark go to Statistics->Conversations, then click on ‘Follow Stream’.
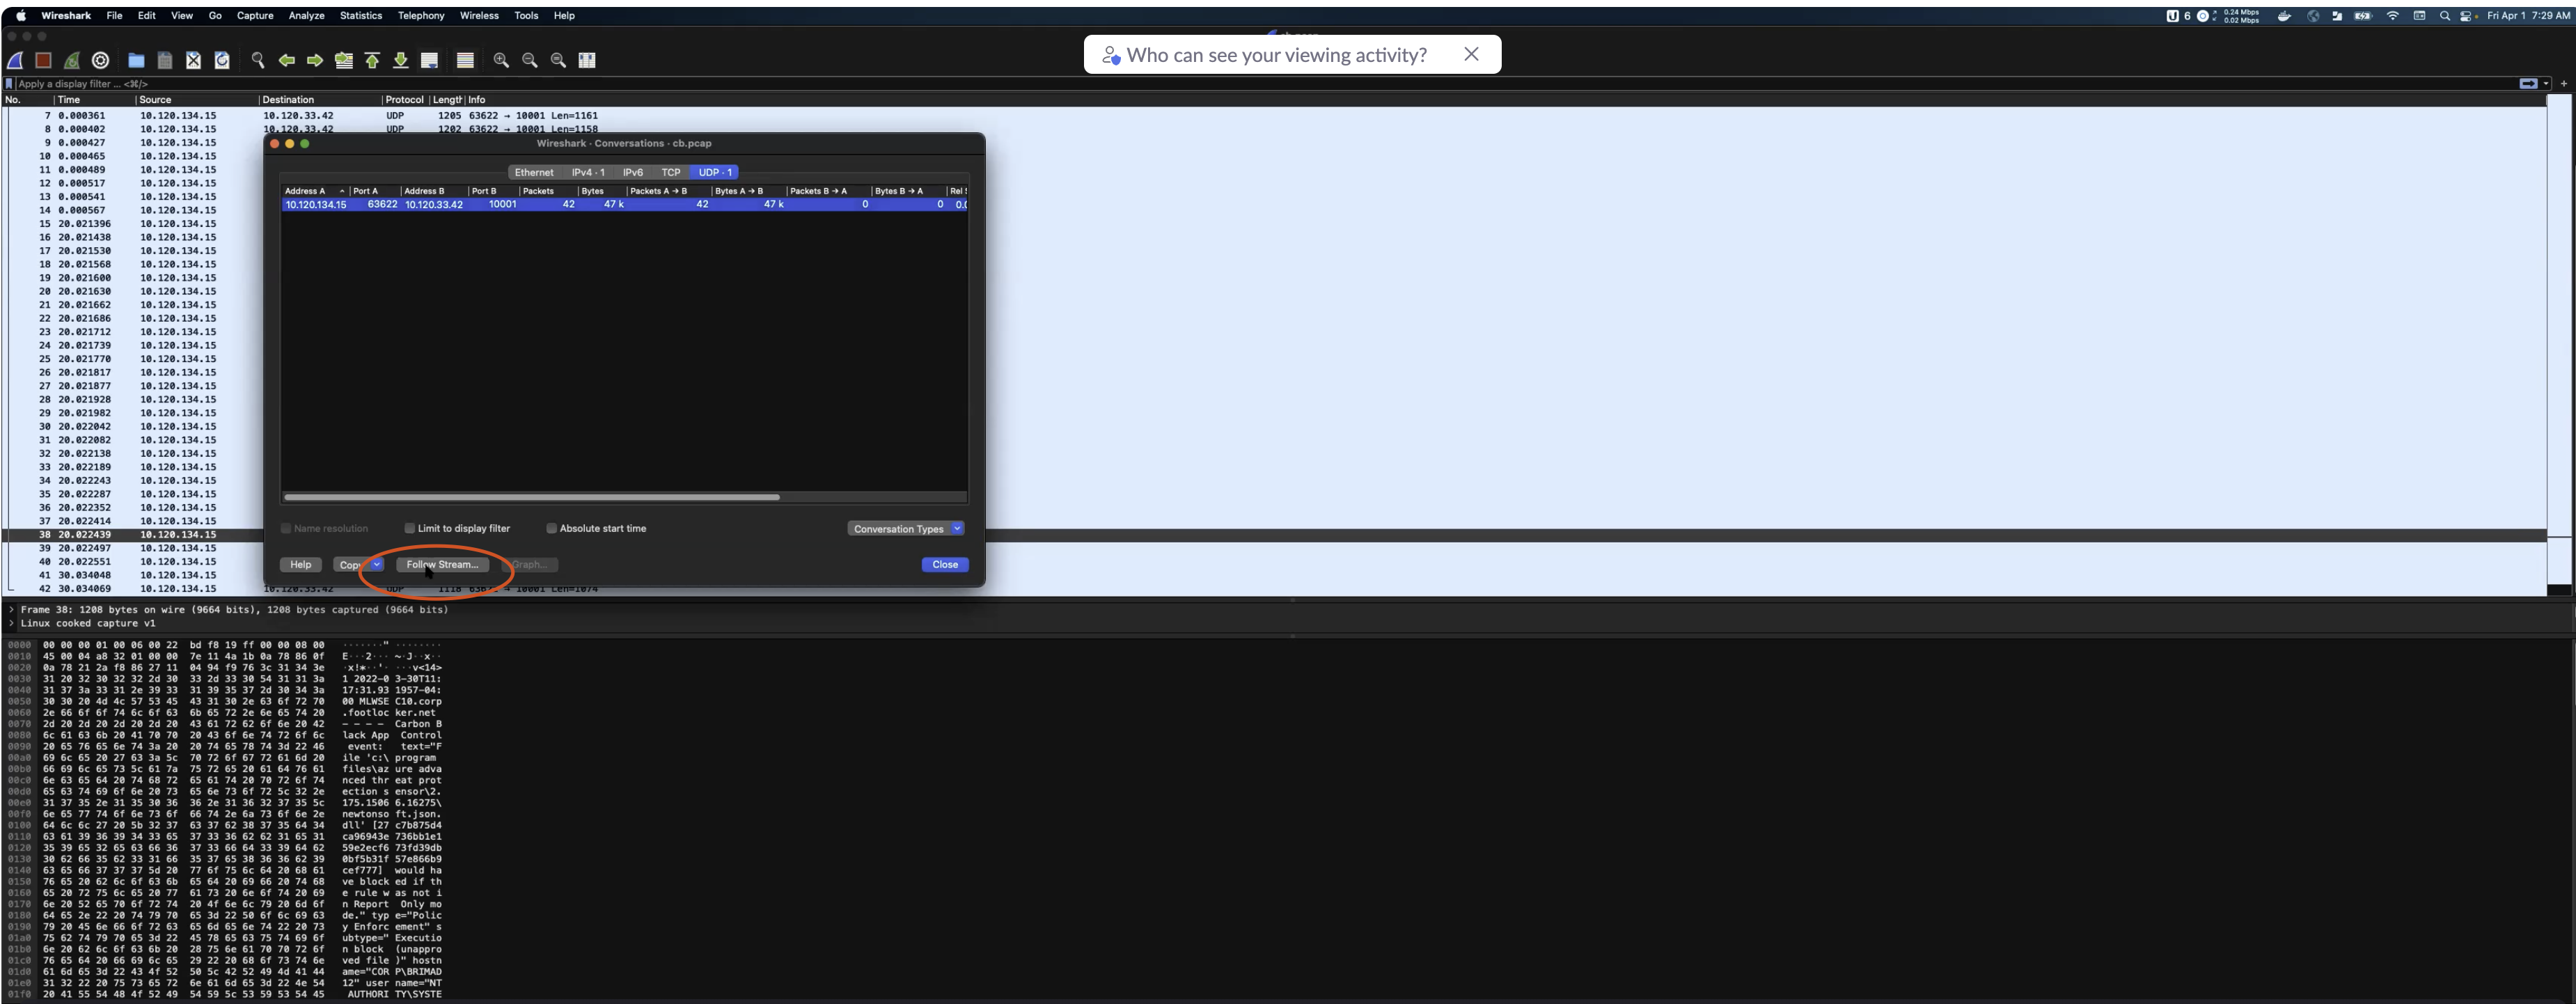 Once you get your stream of messages, copy one of them.
NOTE: In UDP there usually will not be any message separators.
Once you get your stream of messages, copy one of them.
NOTE: In UDP there usually will not be any message separators.
Save raw log message in Splunk or archive
See Obtaining “On-the-wire” Raw Events.
Create a unit test
It is recommended to use the existing test case that is the most similar to your use case.
The naming convention is test_vendor_product.py
Afterwards, you need to make sure that your log is being parsed correctly by creating a test case.
Assuming you have a raw message like this:
<14>1 2022-03-30T11:17:11.900862-04:00 host - - - - Carbon Black App Control event: text="File 'c:\program files\azure advanced threat protection sensor\2.175.15073.51407\winpcap\x86\packet.dll' [c4e671bf409076a6bf0897e8a11e6f1366d4b21bf742c5e5e116059c9b571363] would have blocked if the rule was not in Report Only mode." type="Policy Enforcement" subtype="Execution block (unapproved file)" hostname="CORP\USER" username="NT AUTHORITY\SYSTEM" date="3/30/2022 3:16:40 PM" ip_address="10.0.0.3" process="c:\program files\azure advanced threat protection sensor\2.175.15073.51407\microsoft.tri.sensor.updater.exe" file_path="c:\program files\azure advanced threat protection sensor\2.175.15073.51407\winpcap\x86\packet.dll" file_name="packet.dll" file_hash="c4e671bf409076a6bf0897e8a11e6f1366d4b21bf742c5e5e116059c9b571363" policy="High Enforcement - Domain Controllers" rule_name="Report read-only memory map operations on unapproved executables by .NET applications" process_key="00000433-0000-23d8-01d8-44491b26f203" server_version="8.5.4.3" file_trust="-2" file_threat="-2" process_trust="-2" process_threat="-2" prevalence="50"
You need to: * make sure that the message is a valid python string, where escape characters are placed correctly. * anonymize the data. * rename functions. * update index, and sourcetype fields. * extract replace values with field names in test string.
Here you can see proper test case for Vmware Carbonblack Protect device:
# Copyright 2019 Splunk, Inc.
#
# Use of this source code is governed by a BSD-2-clause-style
# license that can be found in the LICENSE-BSD2 file or at
# https://opensource.org/licenses/BSD-2-Clause

import shortuuid
from jinja2 import Environment, select_autoescape

from .sendmessage import sendsingle
from .splunkutils import  splunk_single
from .timeutils import time_operations
import datetime

env = Environment(autoescape=select_autoescape(default_for_string=False))
# Below is a raw message
# <14>1 2022-03-30T11:17:11.900862-04:00 host - - - - Carbon Black App Control event:  text="File 'c:\program files\azure advanced threat protection sensor\0.0.0.0\winpcap\x86\packet.dll' [c4e671bf409076a6bf0897e8a11e6f1366d4b21bf742c5e5e116059c9b571363] would have blocked if the rule was not in Report Only mode." type="Policy Enforcement" subtype="Execution block (unapproved file)" hostname="CORP\USER" username="NT AUTHORITY\SYSTEM" date="3/30/2022 3:16:40 PM" ip_address="0.0.0.0" process="c:\program files\azure advanced threat protection sensor\0.0.0.0\microsoft.tri.sensor.updater.exe" file_path="c:\program files\azure advanced threat protection sensor\0.0.0.0\winpcap\x86\packet.dll" file_name="packet.dll" file_hash="c4e671bf409076a6bf0897e8a11e6f1366d4b21bf742c5e5e116059c9b571363" policy="High Enforcement - Domain Controllers" rule_name="Report read-only memory map operations on unapproved executables by .NET applications" process_key="00000433-0000-23d8-01d8-44491b26f203" server_version="0.0.0.0" file_trust="-2" file_threat="-2" process_trust="-2" process_threat="-2" prevalence="50"

# Don't forget to rename the function
def test_vmware_carbonblack_protect(
    record_property,  setup_splunk, setup_sc4s
):
    host = f"{shortuuid.ShortUUID().random(length=5).lower()}-{shortuuid.ShortUUID().random(length=5).lower()}"

    dt = datetime.datetime.now()
    iso, bsd, _, _, _, _, epoch = time_operations(dt)

    # Tune time functions for Checkpoint
    epoch = epoch[:-3]

    mt = env.from_string(
        # Extract mark, iso timestamp and host fields
        # Make sure all needed characters are escaped
        # If string contains single quotes wrap it in double qutes
        '{{ mark }} {{ iso }} {{ host }} - - - - Carbon Black App Control event:  text="File \'c:\\program files\\azure advanced threat protection sensor\\0.0.0.0\\winpcap\\x86\\packet.dll\' [c4e671bf409076a6bf0897e8a11e6f1366d4b21bf742c5e5e116059c9b571363] would have blocked if the rule was not in Report Only mode." type="Policy Enforcement" subtype="Execution block (unapproved file)" hostname="CORP\\USER" username="NT AUTHORITY\\SYSTEM" date="3/30/2022 3:16:40 PM" ip_address="0.0.0.0" process="c:\\program files\\azure advanced threat protection sensor\\0.0.0.0\\microsoft.tri.sensor.updater.exe" file_path="c:\\program files\\azure advanced threat protection sensor\\0.0.0.0\\winpcap\\x86\\packet.dll" file_name="packet.dll" file_hash="c4e671bf409076a6bf0897e8a11e6f1366d4b21bf742c5e5e116059c9b571363" policy="High Enforcement - Domain Controllers" rule_name="Report read-only memory map operations on unapproved executables by .NET applications" process_key="00000433-0000-23d8-01d8-44491b26f203" server_version="0.0.0.0" file_trust="-2" file_threat="-2" process_trust="-2" process_threat="-2" prevalence="50"'
    )
    message = mt.render(mark="<134>1", host=host, bsd=bsd, iso=iso, epoch=epoch)

    sendsingle(message, setup_sc4s[0], setup_sc4s[1][514])

    st = env.from_string(
        # Make sure you changed index and sourcetype properly
        'search _time={{ epoch }} index=epintel host="{{ host }}" sourcetype="vmware:cb:protect"'
    )
    search = st.render(epoch=epoch, bsd=bsd, host=host)

    result_count, _ = splunk_single(setup_splunk, search)

    record_property("host", host)
    record_property("resultCount", result_count)
    record_property("message", message)

    assert result_count == 1
NOTE: It is a known issue that the test case will timeout when it starts. When it fails, just re-run it.
Now run the test:
poetry run pytest test/test_vendor_product.py
This test will spin up a Splunk instance on your localhost and forward the parsed message there.
Now the parsed log should appear in Splunk:
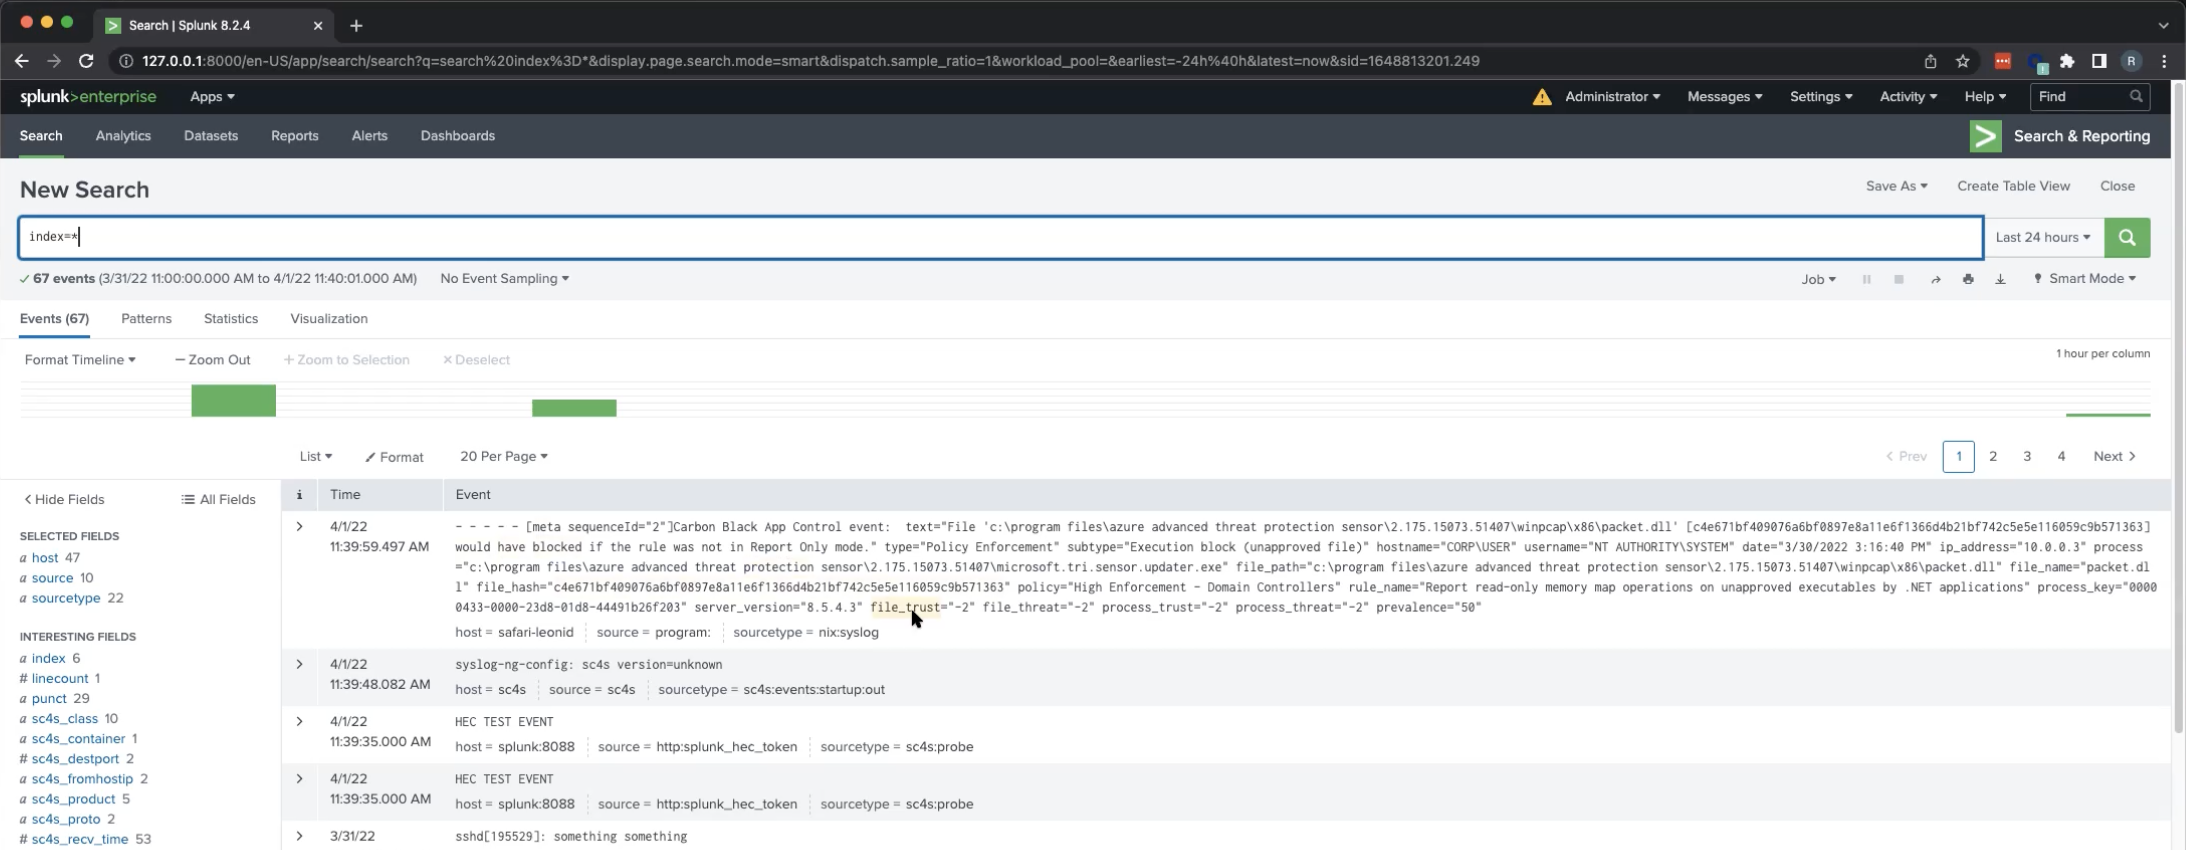 As you can see, at this moment, the message is being parsed as a generic *nix:syslog sourcetype.
To assign it to the proper index and sourcetype you will need an actual parser. So far we have ensured that the fields in the messages are properly recognized.
As you can see, at this moment, the message is being parsed as a generic *nix:syslog sourcetype.
To assign it to the proper index and sourcetype you will need an actual parser. So far we have ensured that the fields in the messages are properly recognized.
Create a parser
Your parser needs to be declared in package/etc/conf.d/conflib. The naming convention is app-type-vendor_product.conf.
If there is a similar parser existing already you can use it as a reference. In the parser, make sure you assign the proper sourcetype, index, vendor, product, and template.
The template tells how your message should be parsed before sending it to Splunk.
The most basic configuration will only forward raw log with correct metadata.
Here is an example:
block parser app-syslog-vmware_cb-protect() {
    channel {
        rewrite {
            r_set_splunk_dest_default(
                index("epintel")
                sourcetype('vmware:cb:protect')
                vendor("vmware")
                product("cb-protect")
                template("t_msg_only")
            );
        };
    };
};
application app-syslog-vmware_cb-protect[sc4s-syslog] {
    filter {
        message('Carbon Black App Control event:  '  type(string)  flags(prefix));
    };
    parser { app-syslog-vmware_cb-protect(); };
};
Now all messages that start with the string Carbon Black App Control event: will be routed to the proper index and assigned the given sourcetype:
 For more info about using message filtering go to sources documentation.
If you wish to apply more transformations you will need to add the parser:
block parser app-syslog-vmware_cb-protect() {
    channel {
        rewrite {
            r_set_splunk_dest_default(
                index("epintel")
                sourcetype('vmware:cb:protect')
                vendor("vmware")
                product("cb-protect")
                template("t_kv_values")
            );
        };

        parser {
            csv-parser(delimiters(chars('') strings(': '))
                       columns('header', 'message')
                       prefix('.tmp.')
                       flags(greedy, drop-invalid));
            kv-parser(
                prefix(".values.")
                pair-separator(" ")
                template('${.tmp.message}')
            );
        };
    };
};
application app-syslog-vmware_cb-protect[sc4s-syslog] {
    filter {
        message('Carbon Black App Control event:  '  type(string)  flags(prefix));
    };
    parser { app-syslog-vmware_cb-protect(); };
};
In this case, we will extract all fields that are nested in the raw log message first by using csv-parser to split Carbon Black App Control event
and the rest of message as a two separate fields named header and message. On top of that, we will use kv-parser to extract all key-value pairs
in the message field.
The best way to test your parser is to run a previously created test case. If you need more debugging, use docker ps to see running containers,
and docker logs to see what’s happening to the parsed message.
Once you are content with the results, you can commit your changes and open pull request.