Getting Started ↵
About Splunk for SAP LogServ¶
Current release: AI Assistant LLM functionality intentionally disabled pending review
The current release ships with the AI Assistant’s LLM-driven path disabled at compile time pending internal review of the OWASP LLM Top 10 controls. The predefined-prompt path + Splunk MCP Server integration + 21 dashboards + 1 Environment Topology view + audit log are all fully active. The free-form chat input is disabled, the model picker is hidden, and the Provider Credentials Settings tab is hidden. See Templates-only Build for the build mechanism. The LLM-driven path will be re-enabled in a future release once review concludes.
Introduction¶
SAP offers its customers ECS (fka RISE) with SAP S/4HANA Cloud Private Edition. This is an IaaS model (on a very basic level) from SAP’s vendor perspective, where SAP hosts customers’ SAP S/4HANA and other SAP systems in the customer’s choice of public cloud providers (AWS, Microsoft Azure, GCP, etc.), in accounts owned and managed by SAP itself. SAP LogServ provides logs from all SAP systems and layers (OS, database, etc.), and the logs can be integrated to be available to the customer’s security information and event management (SIEM) solution.
Splunk for SAP LogServ provides multiple mechanisms to access the logs from LogServ, ingest them into Splunk, and map the various log types to Splunk sourcetypes — plus a React-based UI App with 21 dashboards, a graph-based Environment Topology view, and an LLM-aware AI Assistant that lets analysts run pre-canned investigations without leaving Splunk.
Two Packages¶
The solution is delivered as two separately installable packages:
| Package | App ID | Install On | Role |
|---|---|---|---|
| Data TA | splunk_ta_sap_logserv |
Deployment Server, Heavy Forwarders, Indexer (or single instance) | Data collection, sourcetype routing, index-time filtering, DS automation, ships the indexes.conf for sap_logserv_logs + logserv_ai_assistant_audit |
| LogServ App | splunk_app_sap_logserv |
Search Head only (or single instance) | Dashboards, AI Assistant, Environment Topology view, search-time extractions |
The Data TA ingests log data, routes it to the right sourcetype, and ships the indexes.conf for both the SAP data index (sap_logserv_logs) and the AI Assistant audit index (logserv_ai_assistant_audit) — Splunk auto-creates them when the Data TA loads on an indexer, no separate Index App required. The LogServ App provides the analytics layer the user interacts with. Both index names are configurable via search macros (sap_logserv_idx_macro, sap_logserv_audit_idx_macro).
For details on which package goes where, see Architecture.
Key Features¶
- Multi-cloud ingest — supports both AWS S3 (via the Splunk Add-on for AWS) and Microsoft Azure Blob Storage (via the LogServ Data TA’s built-in
azure_queue_input, no separate add-on). Same downstream sourcetypes, dashboards, ES integration, and AI Assistant regardless of ingest channel. Every event carries an indexedcloud_providerfield (awsorazure) for cross-cloud reporting; the Multi-Cloud Overview dashboard surfaces the per-provider split. See Azure Setup Guide. - Index-time filtering — control which log types are indexed and drop stale data, all configured through Splunk Web with zero license cost for filtered events.
- Deployment Server automation — automatically stages filter configurations for distribution to Heavy Forwarders with a one-click deploy button.
- 21 React-based dashboards — organized as one top-level Environment Health landing page plus four purpose-driven navigation groups: Applications (5 dashboards: ABAP runtime, work-process performance, HANA audit + trace), Integration (5 dashboards: SAP Services, Router, Cloud Connector, Web Dispatcher, Web/API Performance), Security (3 dashboards: Network Perimeter, Cross-Stack Authentication, Change & Configuration), and Platform (7 dashboards including the multi-tab Host Details view, multi-tab Data Pipeline Overview, and Multi-Cloud Overview). Every dashboard ships with cross-dashboard drill-downs (time range preserved), per-dashboard auto-refresh picker, and built-in Download PNG export.
- Environment Topology — interactive graph view of SAP systems, integration partners, and endpoints; built on
@xyflow/reactwith self-derived IP→SID inventory and saved layouts (KV Store). Hourly KV Store refresh via scheduled saved searches plus a manual Refresh button. - Splunk Enterprise Security integration — out-of-the-box CIM tagging across Authentication / Change / Network_Sessions / Web data models for ~9 SAP-specific event categories; 5 starter correlation searches that emit notable events for SAP-specific threat patterns (HANA privilege escalation, cross-stack auth-failure burst, ABAP gateway anomalous peer, SCC ACCESS_DENIED burst, HANA failed CONNECT spike); a tier-2 Risk Notable that fires on accumulated risk; auto-feed of SAP system inventory + user identities into ES Identity Management. Dual-mode: works with or without ES installed. See Enterprise Security Integration.
- AI Assistant — Splunk-aware chat panel with two paths: a predefined-prompt browser (48 saved searches across sap_basis / security / operations packs, dispatched via the Splunk MCP Server with no LLM call), and a free-form prompt path that adds vendor-LLM synthesis on top. Three privacy tiers (Tier 0 air-gapped, Tier 1 default, Tier 2 admin opt-in). The privacy invariant is type-system-enforced: no event data from your Splunk instance is ever transmitted to any AI vendor.
- OWASP LLM Top 10 (2025) compliance — every item in the top-10 has a matching control: prompt-injection sanitization, type-bounded data redaction, supply-chain SBOM, audit hash-chain, per-user rate limit, USD spend cap, SPL static-analysis guard, jailbreak pattern detection, PII redaction, and a tamper-evident audit log forwarder over HEC.
- Templates-only build variant — a deployable variant of the LogServ App that disables the LLM-driven flow at compile time. The MCP path + canned prompts stay fully active so the solution can be demonstrated end-to-end without enabling any LLM provider.
- Search-time field extractions — ~176 search-time directives (EXTRACT, EVAL, FIELDALIAS) across 31 SAP-specific sourcetypes.
| Version | 0.0.6.0 |
| Supported vendor products | SAP LogServ for SAP ECS in Amazon Web Services (AWS) and Microsoft Azure |
| Splunk platform versions | 9.4.3 and later |
| CIM | 5.1.1 and later |


Architecture¶
Two-Package Model¶
The SAP LogServ solution for Splunk is delivered as two separately installable packages:
| Package | App ID | Purpose |
|---|---|---|
| Data TA | splunk_ta_sap_logserv |
Data collection, index-time filtering, deployment server automation, configuration UI, ships the indexes.conf for sap_logserv_logs (SAP data) and logserv_ai_assistant_audit (AI Assistant audit log) |
| LogServ App | splunk_app_sap_logserv |
Dashboards, AI Assistant, Environment Topology view, search-time field extractions, macros |
The Data TA handles everything that happens at index time: ingesting data from S3, routing events to the correct sourcetype, applying index-time filters, and defining the two indexes the solution writes to. It includes Python scripts, REST handlers, a configuration UI built with Splunk’s UCC framework, and default/indexes.conf so Splunk auto-creates sap_logserv_logs and logserv_ai_assistant_audit on first install. Both index names are macro-configurable via sap_logserv_idx_macro (SAP data) and sap_logserv_audit_idx_macro (audit log); customers who rename either index update the matching macro definition. The logserv_ai_assistant_audit index is required for the AI Assistant’s audit log to function — without it, audit events have no destination index.
The LogServ App handles everything that happens at search time: field extractions, field aliases, computed fields, and the dashboards you use to visualize and analyze the data. It contains no Python code and no data collection components.
Why two packages?
The split follows Splunk best practices for distributed deployments. The Data TA runs at the ingest tier (Heavy Forwarders for distributed deployments, plus the Indexer where the bundled indexes.conf provisions storage) and the LogServ App runs on the Search Head where users interact with dashboards. Keeping these tiers separate means search-only logic (field extractions, dashboards, the AI Assistant chat panel) doesn’t bloat the forwarders, and ingest logic (sourcetype routing, REST handlers, UCC config UI) doesn’t leak into the Search Head.
Install Matrix¶
Where you install each package depends on your Splunk topology:
| Topology | Data TA | LogServ App |
|---|---|---|
| Single instance | Same instance | Same instance |
| DS + HFs + on-prem SH | Deployment Server + each HF + Indexer | Search Head only |
| DS + HFs + Splunk Cloud | Deployment Server + each HF (Splunk Cloud admin handles the indexer tier — Data TA installed there provides the index defs) | Splunk Cloud SH only |
Important
- The Data TA is never installed directly on Heavy Forwarders when using a Deployment Server – the DS distributes it automatically.
- The LogServ App is never installed on Heavy Forwarders or the Deployment Server.
- On Splunk Cloud, the customer’s Splunk Cloud admin handles the indexer tier separately. The Data TA installed on that indexer provides the bundled index definitions.
- For single-instance deployments, both packages are installed on the same instance and Splunk merges their configurations at runtime.
Data Flow¶
The diagram below shows how SAP LogServ data flows from the SAP ECS environment into Splunk:
  SAP ECS Environment
        |
        v
  SAP LogServ S3 Bucket (SAP-managed)
        |
        v  (S3 event notifications via SQS)
  Customer's AWS Account
  +-----------------------------------------------+
  |  Destination S3 Bucket  -->  SQS Queue        |
  |         (S3 events trigger SQS messages)      |
  +-----------------------------------------------+
        |
        v  (Splunk AWS Add-on reads from SQS)
  Splunk Heavy Forwarders
  +-----------------------------------------------+
  |  1. Ingest NDJSON from S3 via SQS             |
  |  2. Route to sourcetype (TRANSFORMS)          |
  |  3. Apply index-time filters (nullQueue)      |
  |  4. Forward to indexer                        |
  +-----------------------------------------------+
        |
        v
  Splunk Indexer
  +-----------------------------------------------+
  |  Stores events in sap_logserv_logs index      |
  +-----------------------------------------------+
        |
        v
  Splunk Search Head
  +-----------------------------------------------+
  |  LogServ App: dashboards + field extractions  |
  +-----------------------------------------------+
Index-Time Filtering¶
The Data TA provides built-in index-time filtering that lets you control which log types are indexed. Filtering happens on the Heavy Forwarders using TRANSFORMS-based queue routing:
- Include patterns – Only ingest log types that match the pattern (e.g.,
linux/*to include only Linux logs) - Exclude patterns – Drop specific log types (e.g.,
linux/cronto exclude cron logs) - Days in past – Drop data older than a specified number of days based on the S3 object path date
Filtered events are routed to nullQueue and never consume Splunk license. Filter settings are configured on the Deployment Server and pushed to Heavy Forwarders automatically.
See Configuring Filters for detailed setup instructions.
Sourcetype Routing¶
All SAP LogServ data arrives in a single generic format. The Data TA examines each event’s metadata during index-time parsing and routes it to the appropriate Splunk sourcetype. Routing is defined in transforms.conf using regex-based sourcetype assignment.
Two routing strategies are used:
- Source-path matching – For log types with unique
sourcefield values (e.g.,/var/log/messagesfor Linux syslog,/var/log/squid/access.logfor Squid proxy) - Classification field matching – For SAP application logs that share similar source paths, routing matches the
clz_dirandclz_subdirfields in the NDJSON envelope. When the sameclz_subdirvalue appears under multipleclz_dirpaths (e.g.,auditexists under bothabap/andscc/), compound lookahead regexes match both fields simultaneously to avoid collisions.
For the complete list of supported log types and their sourcetype mappings, see Supported Log Types.
React App Architecture¶
The LogServ App is built as a React application. The Data TA architecture is independent — only the UI tier uses React.
Stack:
- Build pipeline: webpack-based bundle build atop
@splunk/webpack-configs. Each Splunk app page resolves to a single React bundle. - UI primitives:
@splunk/react-ui(forms, tables, modals),@splunk/visualizations(charts),@xyflow/react(Topology graph),styled-componentsfor theming. - State management: React context for cross-cutting concerns (AI Assistant, time range, refresh ticker);
useState/useReducerfor component-local state. No Redux. - Data fetching: custom
useSearchhook wraps@splunk/search-jobfor SPL dispatches; results exposerows / loading / errorto consuming components. - Routing: React Router 7 with
HashRouterso URLs survive Splunk Web’s app-namespace routing; query strings carry time-range hydration (?earliest=...&latest=...).
Build-time feature flags:
The build supports compile-time variants. The first such flag is TEMPLATES_ONLY: when set, the resulting bundle has the AI Assistant’s free-form / LLM-driven flow disabled at compile time, NOT runtime — there is no runtime setting that could re-enable it. See the Templates-only Build page for the user-facing implications.
Static-asset cache busting:
Splunk Web caches the React bundle’s asset URL by an integer [install] build field in app.conf. Every meaningful code change bumps this number; without bumping, browsers serve stale bytes after deploy. The 3-part SemVer in [id] version is independent of the build number and changes only on user-facing version bumps.
AI Assistant Architecture¶
The AI Assistant is a chat-style panel embedded in the React UI App that lets analysts run pre-canned investigations + free-form prompts against their Splunk data. It has two distinct paths and a strong privacy invariant.
Privacy invariant — type-system-enforced, not policy-enforced:
User question  -->  AI vendor  -->  AI picks tools  -->  MCP server  -->  Splunk
                       |                                       |
                       |  <----  Hidden<MCPToolResult>  <------+
                       |
                       v  (sanitize chokepoint: count + timing only — Tier 1)
                       |  (or aggregated metadata — Tier 2)
                       v
                  AI synthesizes narrative reply
Tool results from the Splunk MCP Server are typed Hidden<MCPToolResult> in TypeScript. The compiler refuses to put a Hidden<T> value into the outbound vendor payload — the only way to convert it is via sanitize(hidden, summarizer), which forces the caller to provide a non-data summary. The summarizer is gated by the active privacy tier:
- Tier 0 (Ollama, future) — air-gapped local LLM; no vendor traffic at all.
- Tier 1 (default) — summary is
count + execution_timeonly. AI sees no values. - Tier 2 (admin opt-in) — summary adds aggregated metadata (per-column cardinality, top-N values + counts for categorical, min/max/avg/sum for numeric, time range when
_timeis present). Still no raw rows.
Two paths:
- Predefined prompts (no LLM call): the user opens the prompt browser and clicks one of the 48 cataloged prompts. The orchestrator dispatches the saved search via the Splunk MCP Server, renders the result tile in the right pane, and appends a static interpretation + suggested-next-steps card. No vendor LLM is invoked. This is the path used in the templates-only build.
- Free-form prompts (LLM-driven): the user types a natural-language question. The orchestrator sends the system primer + user message + tool definitions to the active vendor (Anthropic / OpenAI / Azure OpenAI / AWS Bedrock). The vendor picks tools, the orchestrator dispatches them in parallel via MCP, the vendor sees only the privacy-tier summary, and the vendor synthesizes a narrative response.
Audit log:
Every AI Assistant action — both paths — produces audit events into a dedicated logserv_ai_assistant_audit index. Categories include local_only (canned-prompt dispatches), vendor_tier1 / vendor_tier2 (LLM calls with token counts + USD cost estimate), security_blocked_spl, user_prompt_jailbreak_flag, session_tool_cap_hit, daily_spend_cap_hit, audit_forwarder_failure, plus three legal-acknowledgement categories. The Audit Log tab in Settings provides an in-app browser; an optional HEC forwarder can stream events to a separate Splunk / SIEM destination for tamper-evidence.
Splunk MCP Server prerequisite:
The AI Assistant requires Splunk MCP Server (Splunkbase App 7931) v1.1.0 or later, installed on the same search head as the LogServ App. Cookie auth from the same Splunk Web session works by default on HTTP-only Splunk; an optional bearer token can be configured for OAuth-strict environments. See Splunk MCP Setup for end-to-end configuration and troubleshooting.
Environment Topology Architecture¶
The Environment Topology view (also accessible via URL slug integration-topology for backward compatibility) is a graph-based visualization of SAP systems, integration partners, and endpoints across the SAP landscape. It is implemented as a React component on top of @xyflow/react.
Data sources:
The view assembles its node + edge inventory from a union of six SPL searches against the existing sourcetypes (no new ingest required):
sap:abap:gateway— RFC peer/local IPs (P=<peer>/L=<local>fields)sap:abap:icm— ICM peer/local IPssap:hana:tracelogs— HANA host + tenant SID extracted from the source path (/usr/sap/<HANA_SID>/HDB<inst>/<host>/trace/DB_<TENANT_SID>/)sap:saprouter— peer hostname extracted from the parens afterhost <ip>/<service> (<resolved.host>)linux_messages_syslogwith osquery cpu_brand events — host inventory (CPU, RAM, OS, region, AZ, instance ID)- Default Splunk
hostfield — fallback for hosts not surfaced in the above
Self-derived IP→SID inventory:
The “which IP belongs to which SID” mapping is derived from a multi-source union SPL with a mvcount(sids)=1 filter — a host whose multiple sourcetypes all agree on a single SAP SID is unambiguously attributed; otherwise it’s surfaced as “unknown”. Resolution depends on what your data exposes: unique hostname/IP appearances across multiple SAP sourcetypes (HANA tracelogs, ABAP gateway L=, ICM peer fields, saprouter peer hostnames) attribute cleanly, while shared NAT IPs and external partners typically remain unknown. Additional inventory sources can be added by appending another union arm — the inventory framework is extensible per-customer without new ingest.
Saved layouts:
User-arranged graph layouts are persisted via Splunk KV Store collection logserv_topology_layouts. The schema (currently v4) carries node positions, panel state, viewport zoom + pan, enabled integration types, selected node, active right-sidebar tab, and snap mode. Layouts are per-user-named (an admin can save a default layout that other users see; users can save their own variants). Schema migration is in-memory: v1 / v2 / v3 records still load.
Data refresh:
Topology data is populated by three hourly scheduled saved searches (logserv_topology_aggregate_nodes / _edges / _inventory, cron 5 * * * *) that write to the KV Store collections. The view re-reads the KV Store on initial mount, on global TimeRange picker change, and whenever the user clicks the toolbar’s Refresh button. There is no auto-polling — Splunk’s hourly cron is what governs data freshness. The previous Live | Lookup toggle was removed in session 044 because the underlying data only changes hourly, so client-side polling at 30s intervals re-rendered the same data 119 times per hour. Per-node detail panels (right sidebar tabs) continue to re-fetch via on-demand SPL whenever a node is selected.
Release Notes¶
Version 0.0.6 (latest)¶
v0.0.6 is a dashboard-performance release — the feature set is unchanged from v0.0.5
v0.0.6 keeps the entire v0.0.5 feature set unchanged (21 React dashboards + the Environment Topology view, templates-only AI Assistant with 61 canned prompts + audit log, index-time filtering + Deployment Server automation, Cloud Provider attribution, Enterprise Security integration). The single focus of this release is a dashboard data-layer rewrite that makes the dashboards fast at high event volume. Search-time field extractions, sourcetype routing, the Data TA, and all dashboard content are unchanged — only how each panel sources its data changed. No data re-ingest is required to upgrade.
Compatibility¶
| Splunk platform versions | 9.4.3 and later |
| CIM | 5.1.1 and later |
| Supported OS for data collection | Platform independent |
| Vendor products | SAP LogServ for SAP ECS in Amazon Web Services (AWS) and Microsoft Azure |
| AI Assistant prerequisite | Splunk MCP Server (Splunkbase App 7931) v1.1.0 or later, on the search head where the LogServ App is installed |
| Azure ingest | A dedicated first-party add-on — Splunk TA for SAP LogServ on Azure (splunk_ta_sap_logserv_azure), installed per Heavy Forwarder — ingests Azure Blob via Event Grid → Storage Queue notifications (Azure deployments only; SAP provisions the queue + SAS) |
The problem this release solves¶
At a customer’s reported scale (~10.7M events / 24 h, ~321M over 30 days) the 21 non-Topology dashboards took over 10 minutes to populate. Each panel dispatched its own raw, search-time-extraction full-scan with no shared base search, no tstats, and no acceleration. (The Environment Topology view was already fast — it had been moved to a KV-Store-backed data layer in v0.0.5.)
New data architecture — two tiers¶
Every dashboard panel was re-tiered onto the cheapest correct data source and byte-exact-verified against the original raw SPL. The result is a two-tier data layer — no Common Information Model (CIM) acceleration is required.
tstatson indexed dimensions — pure count / average panels (Data Pipeline Overview, Host Details, the Environment Health pipeline panels, Multi-Cloud Overview, and the count KPIs across the suite) read via| tstatsover the already-indexedWRITE_METAfields. A newdefault/fields.confdeclaresINDEXED = trueforclz_dir/clz_subdir/splunk_solution/cloud_provider.- KV-Store precompute rollups — every other high-volume panel reads from 22 hourly-aggregated KV-Store rollup collections (
logserv_*_rollup). Scheduled saved searches (logserv_*_aggregate, cron5 * * * *) precompute each panel’s data; the dashboards read it back filtered by abucket_tsrange driven by the global time-range picker. Streamstats / per-event-listing panels that cannot be rolled up stay raw (capped with| head Nwhere they are time-ordered listings).
Cached reads are uniformly ~0.1–0.6 s versus 10 s – 19 min raw (speedups of 64× – 5,358×), validated at 335M events on the test fleet. Data freshness on the rolled-up panels is hourly — the same trade-off the Environment Topology view already made. See Dashboard Performance & Data Freshness for the full picture and the one-time backfill step.
No CIM data-model acceleration needed for dashboards
An interim build had the four HTTP / DNS / proxy dashboards (Proxy, Web Dispatcher, Cloud Connector, DNS Analytics) read from CIM accelerated data models. That approach was removed before this release: when a customer had not accelerated those models (the common case), the queries fell back to a raw full-scan — exactly the slowness this release set out to fix. Those four dashboards now read dedicated KV-Store rollups, so they are fast regardless of the customer’s CIM-acceleration state. The LogServ App’s CIM tagging (eventtypes + tags) for Enterprise Security correlation is unaffected — see Enterprise Security → CIM Compliance.
New features¶
- “Run backfill” — Dashboard Data settings tab — a new Settings → Dashboard Data tab seeds the rollup collections on first install. It dispatches each rollup’s aggregation searches as top-level jobs (immune to the subsearch wall-clock limits that truncate a bundled backfill at high volume), with a progress bar, completeness banner, and per-rollup status. Idempotent and resumable. An admin clicks this once after installing on a high-volume instance to populate dashboard history immediately; otherwise the hourly aggregation seeds history going forward. See Dashboard Performance & Data Freshness → Backfilling on first install.
- 365-day cache retention — all rollup-retention searches keep a full year of rolled-up history. The install backfill seeds 30 days; the cache then grows to a year organically via the hourly aggregation (seed-and-grow).
- Per-panel action toolbar — every chart and table panel header now carries Open in Search · Download (CSV) · Inspect (Job Inspector) · Refresh plus a “<1m ago” last-run stamp. KPI single-value cards get the loading spinner but no toolbar.
- Universal loading spinner — every chart / table renders the orange-dot spinner + “Loading data…” while its search is in flight (KPI cards show a small spinner instead of a dash), replacing the old plain “Loading…” text.
Role Activity + Sourcetype Mapping performance (build 243)¶
The last two raw-scan panel groups were moved onto KV-Store rollups so they stay fast at high event volume:
- Sourcetype Mapping (Host Details → Sourcetype Mapping tab + Data Pipeline Overview → Linked Graph) now reads a new
logserv_stmap_rollupwithsourcenormalized (UUIDs, dates, and long digit-runs stripped to collapse per-day / per-tunnel variants into logical sources). This cut the search from ~50 s to ~2 s over a 30-day window and the graph from 4,000+ nodes to a few hundred. User-visible change: the graph now shows normalized logical sources (e.g. one…/audit-log_<id>_<date>.csvnode) instead of one node per tunnel-UUID per day. - Role Activity (Host Details → Role Activity tab) — the 7 per-host breakdown panels now read a new
logserv_hostrole_rollup(metric discriminator), reproducing the same value / count / percent breakdown byte-exact, ~8× faster. No visible change.
Adds 2 rollup collections (24 → 26 hourly aggregates; 24 → 26 retention searches) — fully within the existing staggered schedule (now :03–:28 aggregates / :30–:58 daily).
Scheduling & Enterprise Security (build 242)¶
- Enterprise Security content shipped disabled by default. (Superseded in build 249 — the ES content now ships enabled by default; see the build-249 note below.) In build 242 all 22
splunk_sap_logserv_es_*saved searches shipped withdisabled = 1. The ES content is dual-mode (it targets the ES Notable / Risk / Asset & Identity frameworks and CIM data models that no-op without ES installed) and no dashboard reads any ES output. See Enterprise Security → The ES schedule. - Scheduled searches re-staggered into three non-overlapping bands — the 24 hourly rollup aggregates spread one-per-minute across
:05–:28(was all at:05), retention + the 2 daily beaconing aggregates moved to an off-peak:30–:58band, and the (disabled) ES searches re-croned to the back of the hour. No two enabled scheduled searches share an(hour, minute), eliminating the previous:05burst and two same-minute collisions. Dispatch windows are unchanged, so data freshness is unaffected. See Dashboard Performance & Data Freshness → Scheduled-search schedule.
Enterprise Security enabled by default + AI Assistant prompt rework (build 249)¶
- The 22
splunk_sap_logserv_es_*searches now ship enabled by default, reversing build 242’s disabled-by-default decision. They run on a re-staggered, collision-free schedule (no two enabled scheduled searches share an(hour, minute)): 16 correlation searches hourly in the disjoint minutes:29/ odd:31–:59, the 2 Asset/Identity feeds every 4 hours at:00/:01, and the 4 behavioral-anomaly searches once daily at:02. To fit the collision-free schedule, eight correlation searches that ran every 5–15 minutes now run hourly (with matched 65-minute dispatch windows), and the four anomaly searches run daily instead of hourly — a daily run still evaluates every hourly bucket of the prior day, so no detections are missed. The content stays dual-mode (action.notable/action.riskno-op without ES). To disable or re-tune, see Enterprise Security → Disabling or tuning the ES content. - The 13 ES AI Assistant Security-pack prompts were reworked to function as interactive prompts. Dispatched by name, they had been erroring on click ever since build 242 disabled their searches; enabling the searches fixes that, and the SPL was repaired — the
anomaly_topology_edge_volumeFATALinputlookup … whereerror, the dead-constantis_business_hours/is_weekendoff-hours fields (replaced with inline_time-based logic), theservice_account_interactivefield bug, and the structurally-emptyafter_hours_admin_data_access. The three 30-day anomaly prompts were converted to a daily cadence. Intent map bumped to v0.0.11.
Dependency security hygiene — react-router 7.18.1 (build 252)¶
Bumped react-router-dom from 7.14.2 to 7.18.1 (patched line) so dependency / SCA scanners no longer flag the App against GHSA-4hjh-wcwx-xvwj — a __manifest-endpoint DoS in react-router 7.0.0–7.14.x. The App was never exposed to it: it is a client-side single-page app served as static assets by Splunk Web and routed entirely by <HashRouter> (Declarative Mode, which the advisory explicitly exempts), with no React Router / Remix server runtime and therefore no __manifest endpoint. This is a hygiene bump only — no behavior change (routing was re-verified live across the index, settings, dashboard, and topology routes with zero errors).
Whole-estate AI Assistant host prompts moved onto a KV-Store rollup (build 251)¶
Four predefined prompts scan the entire estate by host — Top hosts by event volume, Noisiest hosts trend, Distinct hosts seen, and Hosts with the biggest event-volume drop. They were raw | top host / dc(host) / per-host-timechart full-scans, so on a large dataset they exceeded the AI Assistant’s 30-second request timeout at wide windows (e.g. Top hosts at −30 days took > 150 s and aborted with “signal is aborted without reason”). Build 251 rewrites all four to read from the existing logserv_hostdetails_rollup KV-Store rollup (hourly (host, bucket) counts), so each returns sub-second at any window — measured −30 d went from > 150 s (abort) to 0.6 s, and the dropdown window still drives the result. The reads are byte-exact to the original SPL (the rollup uses the same search-time host field, so the displayed hosts and counts are unchanged), and the rollup is the one that already powers the Host Details dashboard (no new collection or scheduled search). On a fresh install the prompts populate older windows once the Dashboard Data backfill has run, the same as every dashboard. See Predefined Prompts.
AI Assistant prompt time-range dropdown now bounds the search (build 250)¶
The Time range dropdown in the AI Assistant’s “Browse predefined prompts” window (Last 1h … Last 30d) now actually bounds the dispatched saved search. Previously the selected window was silently dropped, so every predefined prompt ran unbounded over the whole index through the Splunk MCP Server — on a large dataset this took minutes and the prompt timed out client-side with “Error: signal is aborted without reason.” The fix flattens earliest_time / latest_time to the MCP run_saved_search tool’s top-level arguments (where App 7931 expects them) instead of nesting them under an ignored arguments object. No fixed window is baked into the saved searches — the dropdown drives the time range end-to-end, and both the canned-prompt path and the AI-driven path are fixed. See Predefined Prompts.
Azure queue-driven ingest (dedicated add-on)¶
Azure ingest is the Azure twin of Splunk_TA_aws’s SQS-Based S3 input, and ships as a dedicated, first-party Heavy-Forwarder add-on — Splunk TA for SAP LogServ on Azure (splunk_ta_sap_logserv_azure), installed per-HF (not via the Deployment Server). Its sap_logserv_azure_queue modular input consumes Azure Event Grid → Storage Queue BlobCreated notifications, fetches each LogServ blob over a SAS, and emits its NDJSON via the native EventWriter, so events flow through the Heavy Forwarder’s index-time pipeline and reuse the LogServ Data TA’s existing sourcetype routing, Filters nullQueue, _time drop, and cloud_provider / splunk_solution stamping unchanged (it emits sourcetype = sap_logserv_logs and stamps _meta = cloud_provider::azure). It is stdlib-only (no Azure SDK, Splunk Cloud-clean) and inert until an input instance is configured. This is the model SAP’s LogServ-on-Azure collector uses (Storage Queue notifications), and it replaces the Splunkbase-add-on polling approach the original v0.0.5 Azure support used. Installing the input on the forwarder tier — with the SAS in the add-on’s own local/, never Deployment-Server-managed — makes Azure ingest symmetric with AWS and removes the per-host-secret-inside-a-DS-app fragility of earlier v0.0.6 iterations (the old system/local SAS dance + sas_token = ****** bundle invariant are gone). Per-instance index and event_sourcetype (both default sap_logserv_logs) let one HF run multiple Azure inputs. Per-HF install + input configuration are documented in SAP LogServ on Azure — Setup Guide. AppInspect Cloud posture: 0 errors / 0 failures / 0 future_failures (the add-on’s stdlib-only modular input adds no gating findings; the input-removed Data TA returns to its 11-warning baseline).
Changed (user-visible panel shapes)¶
A few panels changed shape as a consequence of reading from hourly rollups instead of raw events:
- All response-time charts now show Avg + Max by hour instead of p50 / p95 / p99 percentiles. Averages and maxima roll up byte-exact across hourly buckets (Avg = Σsum ÷ Σcount, Max = max-of-per-bucket-max); percentiles cannot be merged across buckets. Affects Web and API Performance (“Response Time (Avg / Max) Over Time”, and the “Slow URIs / Slow Clients” tables now show a Max (ms) column in place of p95) and HANA Trace (“Operation Duration (Avg / Max)”).
- HANA Trace “Slowest SQL Operations” is now a top-operations-by-max-duration table (operation, max ms, avg ms, event count) — the per-event
_time/ host columns cannot survive an aggregate. - Web Dispatcher “URIs by Request Count” dropped its “Unique Clients” column (a 3-dimension grain would explode at scale).
- Panels that remain raw (and are therefore unaffected): Network Perimeter “Suspicious Activity Indicator”, the DNS / Network-Perimeter beaconing tables, Web Dispatcher “Slowest Request Traces”, and Cloud Connector “Audit Log” — streamstats / per-event listings that cannot be rolled up byte-exact. (The beaconing and Slowest-Traces panels are now backed by per-day / per-hour rollups so they stay responsive to the time-range picker.)
Fixed issues¶
While re-expressing panels, three pre-existing display bugs (all string-vs-number / match()-in-base-search predicate mistakes that silently returned 0) were found and fixed:
- Cloud Connector HTTP Error Rate — the KPI compared a string
is_errorfield against the number1and was stuck at 0%; re-expressed as thestatus >= 400fraction (now ~7.3% on test data). - Change & Configuration “Password Change” / “User Change” KPIs — a Linux
match(_raw, …)clause sat in base-search position wherematch()(eval-only) silently no-ops; moved to a post-base| where. icm_is_errorpredicate — the same string-vs-number trap (icm_is_error = 1vs the field’s string"true") in the Environment Health severity rollup and thelogserv_top_error_categoriesAI prompt; fixed to= "true".
Third-party software attributions¶
THIRD-PARTY-NOTICES.md was refreshed for v0.0.6 and now lists 1236 unique top-level npm packages (adds elkjs@0.11.1, EPL-2.0, used by the Environment Topology layout engine — previously omitted). The file is generated deterministically from the build’s node_modules/ tree by yarn build, shipped at the root of the installed app directory and mirrored at the GitHub source-tree root, alongside the CycloneDX 1.4 SBOM.json. See Third-Party Software.
Known issues¶
- The hourly rollup data layer means rolled-up panels are accurate to the most-recently-completed hour; sub-hour time-range selections (e.g. “Last 15 minutes”) read from the hourly buckets and so reflect completed hours rather than the live partial hour. Use the raw Search app (via the per-panel Open in Search toolbar action) for live sub-hour investigation.
- On a fresh install at high event volume, dashboards show empty until the first hourly aggregation runs or an admin runs the Dashboard Data → Run backfill step.
Version 0.0.5¶
AI Assistant LLM functionality intentionally disabled pending review
The v0.0.5 release ships with the AI Assistant’s LLM-driven path disabled at compile time pending internal review of the OWASP LLM Top 10 controls. Every customer running v0.0.5 runs the templates-only build variant — there is no separate “regular” build published in this release. What’s still active: the predefined-prompt path (61 canned prompts via the Splunk MCP Server), tool tiles in the right pane, drill-down chips, audit log, all 21 dashboards + the Environment Topology view, per-dashboard auto-refresh picker, Download PNG. What’s disabled: free-form chat input, the model picker, the Power Mode toggle, the Provider Credentials Settings tab, and all vendor (Anthropic / OpenAI / Azure / Bedrock) traffic. The LLM-driven path will be re-enabled in a future release once review concludes — the type-system enforcement, privacy tiers, and OWASP Top 10 hardening are designed and implemented, just gated off via the build flag for now. See the AI Assistant → Templates-only Build docs page and the AI Assistant → OWASP LLM Top 10 Compliance page for the full picture.
Compatibility¶
| Splunk platform versions | 9.4.3 and later |
| CIM | 5.1.1 and later |
| Supported OS for data collection | Platform independent |
| Vendor products | SAP LogServ for SAP ECS in Amazon Web Services (AWS) and Microsoft Azure |
| AI Assistant prerequisite | Splunk MCP Server (Splunkbase App 7931) v1.1.0 or later, on the search head where the LogServ App is installed |
| Azure ingest | A dedicated first-party add-on — Splunk TA for SAP LogServ on Azure (splunk_ta_sap_logserv_azure), installed per Heavy Forwarder — ingests Azure Blob via Event Grid → Storage Queue notifications (Azure deployments only; SAP provisions the queue + SAS) |
Major architecture change¶
The LogServ App is fully rewritten as a React-based application. Dashboard Studio v2 is no longer used for any of the 21 dashboards. The app now ships as a single React bundle built on @splunk/react-ui, @splunk/visualizations, and @xyflow/react. The Data TA architecture is unchanged from v0.0.4.x — only the UI App tier has been rewritten.
Implications for upgraders:
- Search-time field extractions are unchanged — your existing custom searches, alerts, and reports against
sap_logserv_logscontinue to work without modification. - Dashboard URLs have changed — old DS v2 deep links (
/app/splunk_app_sap_logserv/<view>?form.global_time...) are replaced with React Router hash routes (/app/splunk_app_sap_logserv/home#/<route>?earliest=...&latest=...). Time-range query params are preserved. - Splunk 9.4.3+ remains the minimum version. No new floor.
- No data re-ingest required — the upgrade is UI-only.
New features¶
-
AI Assistant — Splunk-aware chat panel with two paths:
- Predefined prompts (no LLM call): browse 61 saved searches across three packs (
sap_basis15,security28,operations18) plus a context-aware Dashboard Focused tab that auto-filters to prompts relevant to the current dashboard. Each prompt dispatches via the Splunk MCP Server and renders a tile in the right pane with a static interpretation + suggested-next-steps card. No vendor LLM is involved in this path. - Free-form prompts (LLM-driven): the same MCP tool path is available to one of four AI providers (Anthropic, OpenAI, Azure OpenAI, AWS Bedrock); the LLM picks tools, the orchestrator dispatches, and the LLM synthesizes a narrative response. Critical privacy invariant — enforced by the TypeScript type system at build time, not by policy: no event data from your Splunk instance is ever transmitted to any AI vendor. The compiler refuses to put any tool-result value into the outbound payload — there is no runtime check, no flag to flip.
- Predefined prompts (no LLM call): browse 61 saved searches across three packs (
-
Three privacy tiers for the free-form path, admin-selectable in Settings:
- Tier 0 — Ollama-based local-only (future release).
- Tier 1 (default) — cloud LLM as SPL generator. Tool result summary fed back is only
count + timing. The AI sees no row data and no aggregates. - Tier 2 (admin opt-in) — adds aggregated metadata: cardinality, per-column top-N values + counts, min/max/avg/sum (numeric), and time range. Still no raw rows.
-
Environment Topology — graph-based view of SAP systems, integration partners, and endpoints. Built on
@xyflow/reactwith a force-directed initial layout, self-derived IP→SID inventory drawn from multiple SAP sourcetypes (gateway L=, HANA tracelogs, ICM peer fields, saprouter peer hostnames), per-node sidebar tabs (Programs, Calls/Hr, Errors, Hosts), and named saved layouts persisted via Splunk KV Store (schema v4 — viewport zoom + pan + enabled-types + selected-node + active-tab + snap-mode). Data is refreshed hourly by three scheduled saved searches; manual Refresh button in the toolbar for on-demand re-fetch. -
Drill-down chips — every tool result tile in the AI Assistant’s right pane carries a
↗ Dashboardchip (when a related OOTB dashboard is mapped) and a↗ Run SPLchip that opens Splunk’s Search app with the dispatched SPL pre-populated and the dispatch’s exact earliest/latest pre-applied. Same chips render alongside[→ saved_search]citations in the chat narrative on the left pane. Dashboards themselves also got drill-downs: ~70 KPIs / charts / tables / table rows across 19 dashboards open contextual cross-cutting searches with current time range preserved. -
Per-dashboard auto-refresh picker — every dashboard’s title row now carries a Refresh picker (Never / 30s / 1m / 5m / 15m / 30m / 1hr) with per-user-per-dashboard cadence persisted to a new KV Store collection (
logserv_dashboard_refresh). All charts and KPIs re-run on each tick via a shared context nonce. -
OWASP LLM Top 10 (2025) compliance — every item has a matching control. Highlights: prompt-injection sanitization with role-marker + jailbreak-pattern filtering; type-bounded data redaction; a CycloneDX 1.4 SBOM shipped with every build; tamper-evident audit log with optional HEC forwarder; per-user rate limit (configurable, default 30/hr); USD spend cap; SPL static-analysis guard blocking write/delete/alert operators; PII redaction for
email/user(name)/*_ip/mac/account(hostname opt-in); session tool-call cap; jailbreak pattern detection on user input. See OWASP LLM Top 10 Compliance for the full controls list per item. -
Templates-only build variant — a deployable variant of the LogServ App that disables the LLM-driven flow at compile time. The MCP path + 61 canned prompts + tool tiles + drill-down chips + audit log all stay fully active so the solution can be demonstrated end-to-end without enabling any LLM provider. UI cues: chat input disabled with explanatory placeholder; Send button disabled; model picker hidden; Power Mode toggle hidden; Provider Credentials Settings tab hidden; cyan info-tone banner explains the build mode. Defense in depth: the LLM dispatch entry point bails immediately with a system notice if reached at runtime.
-
Power Mode — role-gated
✦ Powertoggle in the AI Assistant chat input. Admin assigns a list of Splunk roles (viaservices/authorization/roles) that may see the toggle; when on, every prompt forces a saved-search dispatch before LLM synthesis (forced-RAG). State persists per-tab in sessionStorage. Audit events tag the toggle state for SOC pivot analysis. -
TIME-WINDOW REASONING primer rules — the AI Assistant’s system primer (Tier 1 + Tier 2) now teaches the LLM to: (a) identify the dispatch window before claiming severity, (b) normalize cumulative count to events/hour or events/day before ranking, (c) for any finding ranked
[severity:high]or[severity:critical], dispatch ONE additional verify query withearliest=-24h latest=nowBEFORE writing the narrative, and (d) state the window precisely in narrative (“X events in the last 24h” vs. “X cumulative over the search’s rolling window”). The result: the AI now self-corrects in one turn instead of needing a follow-up prompt to re-rank cumulative-noise findings. -
HostDetails multi-host filter + 3-tab layout — the Host Details dashboard’s host picker is now a
Multiselectwith filter input + Select-All-Matches semantics. Multi-host scope is reflected in URL (?hosts=h1,h2,h3) with localStorage persistence. SPL builders splice ahost IN (...)clause when 2+ hosts are selected. Three tabs: Overview (5 KPIs + charts + Host Inventory + Severity Timeline), Role Activity (7 role-specific panels withhideWhenNoData), Sourcetype Mapping (Sankey of source → sourcetype). -
Data Pipeline Overview dashboard-wide host filter — Multiselect + Top-N picker lifted from the chart-level actions slot to the dashboard’s title row. Filter scope expanded from one chart to all 4 KPIs + 4 panels + the Sourcetype Mapping linked graph on the second tab.
-
Path B sourcetype migration — the legacy
[set_srctype_for_syslog]transform has been split into four dedicated routing transforms producing four new sourcetypes:linux:cron,linux:warn,linux:sudolog,linux:slapd. This clears the AppInspect pretrained-sourcetype warning and avoids field-extraction collisions withSplunk_TA_nix’s built-in[syslog]stanza. Existingsourcetype=syslogdata ages out per index retention; dashboards OR both old + new during the transition. -
Branded LS app icons — orange “LS” mark on a dark rounded-square frame. Both the UI App and the Data TA ship the same icon set at 36×36 + 72×72 in regular + Alt variants.
-
Splunk-pattern legal acknowledgement — two compile-time legal/liability modals gate the master
enabledtoggle and the audit-forwarder-disabled save (matching Splunk’ssplunk_instrumentationoptInVersionframework). User identity, Splunk-stamped IP, timestamp, and a SHA-256 of the disclaimer revision are recorded in the audit log so subsequent acknowledgement reviews can prove which revision was acknowledged.
Enhancements¶
- 21 React-based dashboards plus the new Environment Topology view — every one of the 20 v0.0.4.2 dashboards is a fresh React implementation, a new Multi-Cloud Overview dashboard was added (21 dashboards in total), and the Environment Topology view is a new graph-based surface unique to v0.0.5. All dashboards use the unified dark theme (
#0d1117page background,#141b2dpanel fill,#0877a6panel outline) and ship the per-dashboard auto-refresh picker. - Saved-Layout schema v4 — the topology view’s saved layouts now persist viewport (zoom + pan), enabled integration types, selected node, active right-sidebar tab, and snap-mode in addition to the v3 node + panel positions. Schema migration is in-memory: v1 / v2 / v3 records still load.
Multiselect+Top-Npicker as a reusable title-row pattern — labelless inline cluster matching the visual idiom across HostDetails and Data Pipeline Overview.- AI Assistant prompt browser tab persistence — the last selected pack tab is remembered across modal-open events, persisted per-tab via sessionStorage. Persists only when the user actually picked a prompt, not on casual tab-flipping.
- Static guidance card per canned prompt — each predefined prompt’s intent-map entry includes an
interpretationparagraph + bulletednextSteps. Surfaced as a “How to read this result” card after the tool tile lands. Skipped on the AI-driven path (the LLM writes its own commentary). 126 next-step entries split: 64 plain · 57 canned-prompt links · 5 custom-SPL links. - Dashboard Focused prompt browser tab — first-position tab in the prompt browser that filters the 61 prompts down to those mapped to the current dashboard. Auto-hides when no prompts match. Pack-origin chips on each card so users can find the prompt back in its home pack.
- Audit Log Settings tab — read-only browser of the
logserv_ai_assistant_auditindex with time-range / category / user / limit filters; per-row JSON expand. Inline disclaimer covers the tamper-resistance threat model and recommends HEC-forwarder mitigation. 12 audit categories with distinct gradient-fill chip colors. - HEC audit forwarder — admin-configurable forwarding of audit events to a separate Splunk / SIEM / S3-with-Object-Lock destination. Browser-side dual-write at flush time. Failure events captured as a separate
audit_forwarder_failurecategory so disabled / down forwarders are visible in the audit log itself. Visible<T>brand types — outbound-message types are taggedVisibleand unwrap explicitly; the type system refuses to put aHidden<MCPToolResult>into an outbound vendor payload, mechanically enforcing the privacy boundary.- Dynamic timechart span — every time-series chart’s SPL passes a
timechartSpancomputed from the current time range so 30-day windows don’t render with 700 data points. Helper atutils/timechartSpan.ts.
Fixed issues¶
- Stale aggregate framing in AI Assistant top-N responses — the LLM previously cited cumulative aggregates (“4,799 failed authentications”) as if they were active rates, leading to misleading “lock the accounts today” recommendations. Build 171’s TIME-WINDOW REASONING primer rules now force a verify query before high-severity claims, and the same cumulative number gets correctly downgraded with explicit “stale long-window aggregate, not an active brute-force” framing.
- Splunk risky-command safeguard on
nextSteps.spl— two intent-map deep-dive strings used| map maxsearches=1 search="..."which Splunk flags as risky. Rewrote to first-class subsearch syntax. Intent map version bumped v0.0.8 → v0.0.9. - AZ field bleeding into next osquery section — the Host Inventory panel’s
zoneregex now stops at the#012osquery section separator ([^,#]+instead of[^,]+), so AZ values likeap-south-1ano longer carry trailing data from adjacent fields. - MCP cookie auth on same-session HTTP-only Splunk — verified empirically that the Splunk MCP Server v1.1.0 accepts cookie auth from the same Splunk Web session that’s serving the React app, so the default
mcp_server_urlworks on HTTP-only Splunk with no bearer token configured. The optional bearer token layers on top viaAuthorization: Bearerand is invalidated on 401 with one retry. - Splunk
services/authorization/rolesendpoint — Multiselect for the Power Users field reads roles from the correct path;services/authentication/roles(a common typo) silently 404s and produces a stuck “Loading roles…” UI. - Splunk Web static-asset cache busting — every meaningful code change bumps
[install] buildinapp.confso browsers don’t serve stale bytes after deploy. - Webpack
style-loaderrequirement — addingimport '@xyflow/react/dist/style.css'exposed a latent webpack-config gap where CSS was being compiled but never reaching the DOM. Bothstyle-loaderANDcss-loaderare now in the webpack rules.
Restyled (visual conventions)¶
- 21 React dashboards with the unified dark-theme card style:
#0d1117page,#141b2dpanel fill,#0877a6panel outline, 3 px rounded corners, 5 px inset, 12 px panel gaps. Equivalent to the v0.0.4.2 DS v2 look but rebuilt natively in styled-components. - Severity dots — chat findings render with a colored dot (yellow → orange → red → dark-red for low → medium → high → critical) using a radial gradient so they read as glossy beads matching the donut-chart palette aesthetic.
- Win11-style 8-dot loading spinner — replaces the prior cyan-arc indicator in AI Assistant streaming + tool-executing states. CSS-only via single keyframe + per-dot
--anglevariable + staggeredanimation-delay. Reused in the Topology canvas loading overlay (extracted to a sharedSpinnercomponent). - Cyan-light dotted-underline citation links — the AI’s
[→ saved_search]citations render as clickable scroll-to-tile spans; sibling↗ Dashboardand↗ Run SPLchips use the same visual idiom. - Compact Multiselect with Select-All-Matches — HostDetails + Data Pipeline Overview both use
@splunk/react-ui/Multiselectwithcompact + filter + selectAllAppearance="checkbox"so typing into the filter narrows the dropdown and the Select All control auto-renames to “Select all matches”. - Glossy severity-dot gradients —
radial-gradient(circle at 35% 30%, ...)so dots read as 3D beads not flat circles. - Audit-log filter chips with per-category gradients — 12 categories each get a distinct 3-stop linear gradient with mid-stop ~35–45% luminance for white-text readability, dim-when-unchecked via layered translucent-black wash so the text stays readable.
Known issues¶
- Tier 0 (Ollama, air-gapped) is not yet shipped. Tier 0 currently returns “not yet implemented” if selected. Planned for a future release.
hideWhenNoDatapanel-disappearance behavior continues to apply on HostDetails Role Activity tab. Expected behavior, but empty tabs can feel sparse on hosts that only forward a single sourcetype.
Splunk Cloud compatibility hardening¶
Post-initial-release iterations within the v0.0.5.0-beta line that brought the packages to Splunk Cloud Victoria 10.x install-ready posture. All changes are backwards-compatible with on-prem Splunk Enterprise — admins on Enterprise see zero behavior change.
-
Splunk Cloud Victoria install support — both the LogServ App and the Data TA now pass
splunk-appinspect inspect --mode precert --included-tags cloudcleanly. Posture: App = 0/0/0/8/112 (errors / failures / future_failures / baseline warnings / success); Data TA = 0/0/0/11/131. Cleared a Cloud-Victoria-only runtime failure where the LogServ App’s Mako template atappserver/templates/home.htmlwas being stripped by the Cloud edge proxy because it contained a<% page_path = ... %>Python code block (Splunk Cloud Victoria enforces no Python code blocks in Mako templates at runtime, even thoughsplunk-appinspectflags it only as a warning). The fix inlines the page-path expression directly into${make_url(...)}. Without this, the home view returned HTTP 500 withTopLevelLookupExceptionon Splunk Cloud Victoria. -
ISC BIND + Squid parsing absorbed natively — the parsing from the (archived) Splunk Add-on for ISC BIND v2.0.0 and Splunk Add-on for Squid Proxy v2.1.0 is now bundled in the LogServ App, eliminating the need to install those separately. See Supported Log Types → ISC BIND and → Squid Proxy. Customers who have either standalone TA installed will see a one-time dismissible banner on the LogServ App home view recommending uninstall (otherwise both TAs’ parsing runs in parallel, causing duplicate field extraction).
-
sc_subadminenablement across both packages — Splunk Cloud Victoria deployments commonly reservesc_adminfor Splunk Cloud Operations staff, leavingsc_subadminas the customer’s effective top admin role. Both packages now ship withsc_subadminin theirmetadata/default.metawrite ACL (write : [ admin, sc_admin, sc_subadmin ]). The Data TA’smetadata/default.metais post-build-patched byadditional_packaging.pybecause UCC’s stock build template would silently overwrite the source-level value; a standalone repair script also exists attools/scripts/patch_data_ta_sc_subadmin_metadata.pyfor patching already-built tarballs. The Data TA’s[script:splunk_ta_sap_logserv_deployment_push]capability also changed fromadmin_all_objectsto the Splunk-standardedit_deployment_serverso the in-app deployment-push UI works for customer-tier admins. See Splunk Cloud Victoria Notes for the full role-tier mapping. -
AI Assistant settings + T&C acknowledgements migrated to KV Store — Splunk’s REST framework hardcodes
admin_all_objectsas a capability gate on/configs/conf-X/writes, IN ADDITION TO the object metadata ACL. On locked-down Splunk Cloud Victoria deployments wheresc_subadmindoesn’t holdadmin_all_objects, every conf-file write would 403 — including AI Assistant Settings → Save Defaults and every legal-T&C modal Submit. The two mutable conf-file backed stores have been migrated to KV Store collections (logserv_ai_assistant_settings,logserv_ai_assistant_acks), which check only the collection-level metadata ACL — no capability requirement. A one-shot migration helper inApp.tsxcopies any pre-migrationlocal/*.confvalues into KV Store on first page load post-upgrade, so customers don’t lose customizations or re-prompt on legal modals. See the Splunk Cloud Victoria Notes page (section “AI Assistant settings + T&C acks in KV Store”). -
useIsAdminrecognizessc_admin+sc_subadmin— the React UI’s admin-gating hook (hooks/useIsAdmin.ts) expanded from a strictroles.includes('admin')check toroles.some((r) => ADMIN_TIER_ROLES.includes(r))withADMIN_TIER_ROLES = ['admin', 'sc_admin', 'sc_subadmin']. Without this, the AI Assistant Settings page would have rendered a 403 “Admin access required” fallback for customer-tier Splunk Cloud admins. -
Audit-index renamed
logserv_ai_assistant_audit— across two hops:_ai_assistant_audit→ai_assistant_audit(dropped the underscore prefix because AppInspect’scheck_lower_cased_index_namesrejects custom-app indexes starting with_) →logserv_ai_assistant_audit(added thelogserv_namespace prefix so the index can’t collide with any other app that happens to define a genericai_assistant_audit). Functional behavior unchanged across all three names. Both indexes the Data TA provisions are macro-configurable viasap_logserv_idx_macroandsap_logserv_audit_idx_macro. Customers with existing audit data under either of the older index names will see that data become orphaned on disk after upgrade — not queryable via the new name. Audit retention horizons are typically short and a clean break is acceptable. -
Splunk MCP Server JWT
aud = mcprequirement documented — Splunk Cloud Victoria’s edge proxy auto-injects a JWT into every/__raw/splunkd request, and the Splunk MCP Server (Splunkbase App 7931) validates theaudclaim against the literal"mcp". Common Splunk Cloud Victoria default audiences (e.g.,"Demo"on non-production stacks) cause the MCP health probe to receive a 403Invalid token audienceerror, which surfaces as the AI Assistant SETUP REQUIRED banner. The fix is customer-side (re-mint the MCP token withaudience=mcpOR file a Splunk Cloud Support ticket asking them to align the stack’s MCP audience). This is a server-side App 7931 configuration; the LogServ App is audience-agnostic. See Splunk MCP Setup → Splunk Cloud — JWTaudclaim must bemcp. -
Data TA Cloud-vetting fixes — cleared 6 pre-existing AppInspect failures + 2 future_failures that had been blocking the Data TA on Splunk Cloud: 4-part SemVer corrected to 3-part (
0.0.5),python.version = python3flag added on scripted-input stanzas,python.required = 3.13added on scripted inputs + admin_external handlers,solnlib<8.0.0pinned inrequirements.txtto drop AArch64-incompatible protobuf + gRPC + OpenTelemetry binaries that solnlib 8+ pulls in transitively (also cuts Data TA tarball size 82%, from 9.29 MB → 1.55 MB), illegalmaxTotalDataSizeMBindex property removed, executable shell script relocated alongsideadditional_packaging.py(one level up frompackage/) so UCC stops bundling it.
Microsoft Azure support¶
Superseded in v0.0.6
Azure ingest now uses the dedicated Splunk TA for SAP LogServ on Azure add-on (splunk_ta_sap_logserv_azure) and its sap_logserv_azure_queue input (Event Grid → Storage Queue notifications), installed per Heavy Forwarder. The Splunkbase Microsoft-Cloud-Services polling approach described below is the original v0.0.5 implementation, retained here as a release record. See the Azure Setup Guide for the current setup.
The v0.0.5.0 release adds full Microsoft Azure Blob Storage support alongside the existing AWS S3 ingest. Architectural pattern is symmetric with AWS: the LogServ Data TA pairs with the Splunk Add-on for Microsoft Cloud Services (Splunkbase App 3110, v5.0+) on the Heavy Forwarder tier, instead of Splunk_TA_aws. Validated end-to-end against a real Azure subscription with the production deployment topology (DS → HF distribution, SAS credential HF-local, NOT pushed via DS).
-
Azure Blob Storage ingest — the
mscs_storage_blobinput from the Splunk Add-on for Microsoft Cloud Services polls a configured Azure Blob container under thelogserv/prefix, downloads each new blob (gzipped NDJSON), and emits events withsourcetype = sap_logserv_logs. The LogServ Data TA’s existing index-time routing transforms then key on thesourcefield’sclz_dir/clz_subdirsegments — identical to the AWS S3 pipeline. No new Data TA configuration required; the routing transforms ARE the multi-cloud abstraction layer. -
cloud_providerindexed-field attribution — the Azure input stanza sets_meta = cloud_provider::azure, which Splunk persists as an INDEXED field on every event ingested through that input. AWS-ingested events have nocloud_providerfield on disk (legacy data + AWS S3 input pre-dating Azure support); a new search-time macrosap_logserv_cloud_provider_default_macro(eval cloud_provider=coalesce(cloud_provider, "aws")) provides the AWS default for cross-cloud reporting. Result: every event in the index reports acloud_providervalue ofawsorazure, regardless of when or where it was ingested. -
Multi-Cloud Overview dashboard — new platform-tier dashboard surfaces the per-provider ingest split (event count + sourcetype breakdown + recent activity), built on top of the
sap_logserv_cloud_provider_default_macro. Lives under the Platform navigation group as the 23rd registered dashboard. Useful for capacity-planning across cloud providers + confirming the Azure ingest is healthy. -
Four authentication recipes documented — the Azure Setup Guide covers four Azure auth paths: (a) Account-key + SAS (testing-grade), (b) Shared Access Signature with container scope (production-friendly, time-bounded), (c) Service Principal with
client_secret, (d) Managed Identity (no credential stored on the HF — preferred for HFs running on Azure VMs / AKS / Azure App Service). Recipes are independent of the rest of the setup; pick whichever fits the customer’s Azure security posture. -
Production deployment topology table — same DS → HF distribution pattern as
Splunk_TA_aws. Splunk_TA_microsoft-cloudservices is distributed by the Deployment Server to the Heavy Forwarder server class; Search Head and Indexer do NOT have the add-on. SAS credentials and account configuration stay in HF-local config (NOT pushed via DS — environment-specific per-HF). -
Compact-JSON requirement called out — the LogServ Data TA’s index-time routing transforms use whitespace-strict regex (
(?=.*"clz_dir":"abap")) that bypasses silently on pretty-printed JSON. The SAP LogServ collector emits compact JSON natively, but any custom intermediate pipeline that re-formats blobs with": "separators would land events at the bootstrapsap_logserv_logssourcetype. Customer-facing docs call this out as a warning. -
Data TA Cloud Provider tab +
splunk_solutionindexed field — the Data TA’s Configuration page gains a second tab, Cloud Provider, with a dropdown (AWS / Microsoft Azure / Not set; default Not set) that stamps an indexedcloud_providerfield on every event the TA processes — a TA-managed alternative to setting_meta = cloud_provider::aws|azureper input. On a Deployment Server the selection deploys to Heavy Forwarders via the same Deploy to Forwarders flow as the Filters tab. Separately, the Data TA now always stamps an indexedsplunk_solution = splunk_for_sap_logservfield on every event (no UI; ships active) so events that flowed through this solution remain identifiable even when the same index also receives data from other solutions. Both fields are written at index time viaWRITE_METAtransforms on the bootstrapsap_logserv_logssourcetype.splunk_solutionis intentionally distinct from the per-sourcetypevendor_productsearch-time field that dashboards and CIM mapping use — the two coexist and do not collide. For a mixed-cloud Heavy Forwarder (one HF ingesting both AWS and Azure), leave the dropdown at Not set and attribute per input via_meta. See Configuring Filters → Cloud Provider Attribution.
See the Azure Setup Guide for full step-by-step setup, prerequisites, and troubleshooting.
Splunk Enterprise Security integration¶
The LogServ App ships an out-of-the-box Splunk Enterprise Security (ES) content pack. Everything is dual-mode — it works with or without ES installed: the action.notable=1 / action.risk=1 directives silently no-op when ES is absent, and the Risk Notable’s Risk.All_Risk data-model search returns 0 rows without ES.
-
CIM compliance — 18 eventtypes + matching tags route SAP-specific events (and the absorbed ISC BIND + Squid parsers) into the Authentication / Change / Network_Sessions / Web CIM data models. A new
app.manifestdeclares a hard dependency onSplunk_SA_CIM ≥ 5.0.0. See CIM Compliance. -
19 detection correlation searches + 1 Risk Notable + 2 Asset/Identity feeds — organized as 6 base/starter searches (HANA privilege escalation, cross-stack auth-failure burst, ABAP gateway anomalous peer, SCC ACCESS_DENIED burst, HANA failed CONNECT spike, Linux OOM-killer burst), 6 cross-stack detections, 3 threat-intel searches, and 4 behavioral / anomaly detections. All emit
action.notable=1for ES Notable Review andaction.risk=1for RBA. The Risk Notable threshold search fires aseverity=criticalnotable when accumulated risk on a single object reaches ≥ 100 in 24h. Two scheduled saved searches emit Asset & Identity feed CSVs every 4h. See Correlation Searches & RBA. -
Threat-intel framework — three customer-managed CSV lookups (
logserv_ti_malicious_domains,logserv_ti_malicious_ips,logserv_ti_compromised_credentials) ship empty and are populated by the customer; the 3 threat-intel correlation searches join DNS / proxy / authentication events against them. No separate Splunkbase install or ES Threat Framework dependency. See Threat Intelligence Integration. -
Behavioral / anomaly detections — statistically-baselined (Z-score via built-in SPL
eventstats, no MLTK dependency) detections for per-user auth volume, per-host webdispatcher response time, per-edge topology call volume, and per-admin off-hours activity. See Behavioral & Anomaly Detections.
All ES detections are also AI Assistant-dispatchable — they appear as prompts in the Security pack of the predefined-prompt browser. See Enterprise Security Integration for the full overview.
Third-party software attributions¶
The v0.0.5.0 LogServ App ships with THIRD-PARTY-NOTICES.md at the root of the installed app directory (and at the root of the GitHub release source tree). The file lists all 1235 unique top-level npm packages bundled with the React app — names, versions, declared licenses, repository URLs, and full LICENSE / NOTICE / COPYING text where available. License posture: 1012 MIT, 64 ISC, 57 Apache-2.0, 46 BSD-3-Clause, 22 BSD-2-Clause, 11 @splunk/* (covered as a Splunk Extension under §1.C of Splunk General Terms), plus a long tail of permissive licenses. No GPL / AGPL / LGPL components. See Third-Party Software for the full license-distribution summary and refresh policy.
A CycloneDX 1.4 SBOM (SBOM.json) is also regenerated on every build and shipped inside the package alongside THIRD-PARTY-NOTICES.md.
Version 0.0.4.2-beta¶
Compatibility¶
| Splunk platform versions | 9.4.3 and later |
| CIM | 5.1.1 and later |
| Supported OS for data collection | Platform independent |
| Vendor products | SAP LogServ for SAP ECS in Amazon Web Services (AWS) |
New features¶
- 3 new SAP service sourcetypes —
sap:sapstartsrv(SAP Start Service / Host Control Agent with auth and SSL/TLS negotiation fields),sap:saphostexec(SAP Host Agent execution logs), andsap:saprouter(SAP Router connection and trace logs). These cover thesap/sapstartsrv,sap/saphostexec, andsap/saprouterlog types in the LogServ S3 bucket. - 28 total sourcetype routing transforms with
@logserv_filterannotations for index-time filter support. - ~176 total search-time directives (EXTRACT, EVAL, FIELDALIAS) across all SAP-specific sourcetypes in the LogServ App.
- 15 new dashboards in the LogServ App, bringing the total to 20. Dashboards are organized into 4 purpose-driven navigation groups plus a top-level Environment Health landing page (reorganized from the previous 3-group structure so that the top menu is balanced and each group answers a specific class of question):
- Top-level — Environment Health (default landing)
- Applications (5 dashboards) — the SAP app runtime itself: ABAP Network & Security, ABAP Operations, Work Process Performance (new), HANA Audit, HANA Trace
- Integration (5 dashboards) — how SAP talks to other systems: SAP Services, SAP Router (new), Cloud Connector, Web Dispatcher, Web and API Performance (new)
- Security (3 dashboards) — cross-source synthesis for security posture and compliance: Network Perimeter (new), Cross-Stack Authentication (new), Change & Configuration Activity (new)
- Platform (6 dashboards) — infrastructure, ingest, and forensics: Data Pipeline Overview, DNS Analytics, Linux System & Security, Windows Events, Proxy Analytics, Host Details
- 6 new dashboards from Phase 2 (added after the original 14):
- Cross-Stack Authentication — unified authentication failure analysis across SAP, HANA, and Windows layers, with per-layer KPIs, source-IP aggregation, and per-layer recent-failure tables
- SAP Router — SAP Router connection activity, error analysis, and network boundary monitoring (separated out of SAP Services to give router its own investigation surface)
- Work Process Performance — SAP ABAP work process utilization with all 13 SAP-standard dev_w* trace category codes, dispatcher health, and function-level activity
- Web and API Performance — Web Dispatcher four-stage request timing (
dt1-dt4), response-time percentiles, TLS version and cipher-suite distributions, and a cross-source panel overlaying HTTP error rate against Cloud Connector auth failure rate - Network Perimeter — unified network-boundary view synthesizing firewall drops, proxy outbound traffic, and DNS resolution into one dashboard; includes firewall-drops-by-protocol, top outbound domains with byte volumes, and a cross-source Suspicious Activity Indicator table ranking internal hosts by combined beaconing-DNS + denied-proxy signal score
- Change & Configuration Activity — compliance-focused audit trail unifying HANA user/role/privilege/DDL changes, Windows account and group modifications (15 canonical security EventCodes), and Linux sudo + useradd/usermod/userdel/passwd activity; includes source-prefixed operator identities, a category taxonomy, and two compliance-focused “Recent” tables (Privileged Changes + After-Hours Changes)
- Environment Health dashboard — Cross-cutting operations view with 6 KPIs, 6 category-specific error trend charts (ABAP, HANA, Security, Web/Network, Cloud Connector, OS/Infra), critical events table, host error matrix, and performance panels. Every panel drills down to the relevant detailed dashboard. Now set as the default landing page.
- Tabbed Data Pipeline Overview — Two tabs: “Overview” (5 KPIs + 14-column Sourcetype Summary table + Host Latest Activity) and “Linked Graph” (full-width source-to-sourcetype link graph). The Sourcetype Summary table includes Status (Fresh/Stale/Very Stale), Trend sparkline, % of Total, Avg/Day, Volume, App Errors, Hosts, Sources, Events (1h), First Seen, Last Seen, and Lag columns.
- HANA Audit security panels — Three new panels surface the rich
sap:hana:auditfield set: Risk-Tiered Event Timeline (stacked column byrisk_level), After-Hours / Weekend Admin Activity (table filtered to admin users outside business hours), and High-Risk Events (table ofis_critical=trueevents with SQL Statement column). - KPI sparklines — ~75 KPIs across all 21 dashboards display an inline daily-trend sparkline below the headline number, using a single-source
timechart + eventstatspattern. Five flavors: count-based, distinct-count, rate, formatted-volume, and per-day re-detection. One acknowledged exception: the Linux “Top Drop Source” KPI is a string value (<IP> (<count>)) with no sparkline. - Click-through drilldowns — Most KPIs, table rows, and chart points open a filtered Splunk search. Clickable table cells carry a cyan accent so the drilldown affordance is visible.
- KPI single values added to DNS Analytics (Total Queries, Unique Clients, Beaconing Domains), HANA Audit (Total Events, Failed Operations, Active Users), and Web Dispatcher (Total Requests, Error Rate, Avg Response Time). Access Denied Events KPI added to Cloud Connector; Top Drop Source KPI added to Linux.
- Enhanced DNS Analytics — Top Queried Domains, Top Clients by Domain Diversity (DGA detection), Query Type Distribution, and Top DNS Resolvers table.
- Enhanced HANA Audit — Top Users by Activity, Activity by Hour of Day (after-hours detection), and Client IP Analysis.
- Enhanced Web Dispatcher — Request Volume Over Time, Top URIs by Request Count, and Recent Errors (4xx/5xx).
- Host Details — 3-tab expansion — The Host Details dashboard is now organized into three tabs. Overview shows a 5-KPI row (Total Events, Data Volume, Active Sourcetypes, Errors/Criticals, Auth Failures), the Host Event Count by Sourcetype timeline, a cross-source Severity Timeline, Host Inventory (CPU/RAM/EC2/OS/region from osquery), Recent Authentication Events + Recent Errors & Criticals cross-source tables, Top Sources, Activity by Hour of Day, and Data Freshness per sourcetype. Role Activity contains seven role-specific panels (HANA Audit Activity, ABAP Work Process Mix, Web Dispatcher Traffic by Status, SAP Router Peers, Windows Event Codes, Sudo Commands, DNS Top Queries) that auto-hide via
hideWhenNoDatawhen the selected host has no data for that component. Sourcetype Mapping houses the full-width Sankey chart that was previously inline. - Cross-dashboard navigation — Every dashboard includes a Navigate to Dashboard dropdown with Go button that preserves the selected time range when switching between dashboards.
- In-dashboard documentation link (“More Info” button) — A cyan More Info button in the top-right of every dashboard’s toolbar row opens the corresponding online-documentation section in a new browser tab. The link targets the dashboard’s section within the appropriate category page (
.../dashboards/applications/#<dashboard-slug>, etc.) so users can jump from a live dashboard to its narrative documentation in one click. For multi-tab dashboards (Data Pipeline Overview, Host Details) the button appears on every tab.
Enhancements (per-dashboard restructures)¶
- SAP Services — Removed the 4 router-related panels (now on the SAP Router dashboard); featured SSL Authentication Failure Sources full-width; replaced Event Volume by Service line chart with a stacked column chart showing Normal vs Errors per service.
- Windows Events — Removed Security Event Actions chart and Top Users table (now on Cross-Stack Authentication); featured Top Event Codes full-width with 7 enriched columns (Event Code, Description, Source log, Severity, Events, Hosts, Last Seen).
- Proxy Analytics — Replaced single-slice donuts (Content Types → Cache Action Distribution column; HTTP Methods → Top Clients by Domain Diversity bar). Added new bottom row: Top URL Domains by Bytes Out + Bandwidth Over Time by Domain.
- DNS Analytics — Replaced the uninterpretable Volume & Packet Size scatter plot with a Top DNS Resolvers table; restructured row 2 to 4 panels including Query Type Distribution donut moved up to pair with the trend chart.
- ABAP Operations — Work Process Categories donut widened to 836 px with bottom legend showing all 13 friendly category names (uses the shared
wp_category_nameprops.conf EVAL). - Cloud Connector — Renamed “Error Rate” → “HTTP Error Rate” to clarify scope; added Access Denied Events KPI (4th KPI in row).
- Linux System & Security — Added Top Drop Source KPI surfacing the highest single-source firewall drop count in
<IP> (<count>)format (4th KPI in row).
Fixed issues¶
- DNS Analytics beaconing panels now use correct
message_type="Query"case (was"QUERY"). - Web Dispatcher data source had hardcoded Unix timestamps; replaced with
$global_time.earliest$/$global_time.latest$tokens. - Work Process Categories labels — The Work Process Categories panel on the ABAP Operations dashboard now displays meaningful names for all 13 standard SAP dev_w* trace component codes (A = ABAP Processor, B = Database Interface, C = Communication, D = Dispatcher, M = Memory Management, N = Network (NI), O = Enqueue / Lock, Q = RFC Queue, R = Roll Area, S = SQL / Statistics, T = Task Handler, X = RFC / CPIC, Y = Dynpro / Screen). Previously only A/B/C/M were mapped and the rest appeared as single-letter codes. The same
wp_category_namemapping is now also used on the Work Process Performance dashboard. - KPI panel alignment — KPI single-value widgets on all three-KPI dashboards are evenly spaced with the rightmost KPI outline aligned to the right edge of panels below.
- Right-edge symmetry — All rows on width=1920 dashboards now cap at R=1910; width=1600 dashboards cap at R=1590. Symmetric 10 px padding on both sides.
- HANA Trace component noise filter — Top Components, Component by Severity, and Source File Hotspots panels now filter out parsing artifacts (“INFO”, “of”, “service:”) that previously diluted real component data.
- Ingest Errors KPI on Data Pipeline Overview — Refined to exclude ExecProcessor noise (which wraps all scheduled-script output as ERROR-level regardless of the script’s actual log level). Filters to real Python ERRORs only.
- SSL Authentication Failure Sources panel (SAP Services) — Replaced the previous Sapstartsrv SSL/TLS Events panel which showed empty columns due to mismatched field extractions. Now aggregates by source IP using fields that actually exist in the data (auth_user, remote_ip, remote_port) and provides row drilldown to the full event set per IP.
- Empty-safe KPI pattern — All count-based and dc-based KPIs now display
0instead of###when the underlying search returns no events (uses a synthetic-row appendpipe wrap).
Restyled (visual conventions)¶
- Dashboard “card” style — All 21 dashboards use a unified visual treatment:
#0d1117page background,#141b2dpanel fill,#0877a6panel outline, rounded corners, 5 px inset between rect frame and inner viz. - KPI typography standardized —
majorFontSize: 36, explicitlabelColor: #7b8ea8,labelFontSize: 13, semanticmajorColor(#dc4e41red for errors, white for neutral counts, orange for warnings, teal for positive signals). The Linux Top Drop Source KPI usesmajorFontSize: 28as an acknowledged exception for its long-text string display. - Standard red consolidated — All red color variants (
#e86c5d,#af575a,#ff3b30,#ff2d55) normalized to single hex#dc4e41. - Tables — Hardcoded header background (
#1e2a3d), zebra-stripe alternating rows (#0d1520/transparent), fixed header. Cyan accent on clickable cells indicates drilldown affordance. - 12 px panel gaps — Exact horizontal and vertical spacing between every panel border across all dashboards.
- Dashboard descriptions — Every dashboard now displays a 1-line description below its title.
- “Go >” navigation button — Standardized: 120×25 px at top-left of every dashboard with 10 px padding above and below; majorFontSize 16.
- “More Info” documentation button — Standardized: 140×25 px at top-right of every dashboard, aligned with the right edge of the canvas (10 px padding from the right; x = canvas_width − 150). Same cyan fill
#0877a6, white text, majorFontSize 16 as the Go button. Opens the dashboard’s online-documentation section in a new browser tab viadrilldown.customUrlwithnewTab: true.
Known issues¶
- The dashboards in the LogServ App use Dashboard Studio v2 format and require Splunk 9.4.3 or later.
- Several Host Details panels (Host Inventory, Recent Authentication Events, Recent Errors & Criticals, and all seven Role Activity panels) use
hideWhenNoDataand will disappear for hosts that lack the underlying sourcetype data. For example, a Windows host without osquery data will not show the Host Inventory panel; an ABAP-only host will not show the HANA Audit Activity panel on the Role Activity tab. This is the dashboard adapting to the selected host’s role — not a bug — but empty tabs can feel sparse on hosts that only forward a single sourcetype.
Third-party software attributions¶
Version 0.0.4.1-beta¶
Compatibility¶
| Splunk platform versions | 9.4.3 and later |
| CIM | 5.1.1 and later |
| Supported OS for data collection | Platform independent |
| Vendor products | SAP LogServ for SAP ECS in Amazon Web Services (AWS) |
New features¶
- 12 new SAP application sourcetypes — 9 SAP ABAP types (
sap:abap:audit,sap:abap:dispatcher,sap:abap:enqueueserver,sap:abap:event,sap:abap:gateway,sap:abap:icm,sap:abap:messageserver,sap:abap:sapstartsrv,sap:abap:workprocess), 1 HANA trace type (sap:hana:tracelogs), and 2 SAP Cloud Connector types (sap:scc:audit,sap:scc:http_access). - Compound lookahead routing — New routing pattern for log types where the same
clz_subdirvalue appears under multipleclz_dirpaths (e.g.,auditexists under bothabap/andscc/). Uses regex lookahead to match both fields simultaneously. - Search-time SID/instance extraction — ABAP and HANA sourcetypes extract
sap_sidandsap_instancefrom thesourcemetadata field usingEXTRACT ... in sourcedirectives in the LogServ App. - ~128 total search-time directives across all SAP-specific sourcetypes.
Fixed issues¶
Known issues¶
- The dashboards in the LogServ App use Dashboard Studio v2 format and require Splunk 9.4.3 or later.
Third-party software attributions¶
Version 0.0.3-beta¶
Compatibility¶
| Splunk platform versions | 9.4.3 and later |
| CIM | 5.1.1 and later |
| Supported OS for data collection | Platform independent |
| Vendor products | SAP LogServ for SAP ECS in Amazon Web Services (AWS) |
New features¶
- Two-package architecture — The solution is now split into two packages: the Data TA (
splunk_ta_sap_logserv) for data collection and index-time processing, and the LogServ App (splunk_app_sap_logserv) for dashboards and search-time field extractions. See Architecture for details. - Built-in index-time filtering — Configure include/exclude patterns and time-based filters directly through the Splunk Web UI. Filtered events never consume Splunk license. See Configuring Filters.
- AWS Lambda-based filtering — New deployment option that filters S3 event notifications in AWS before they reach Splunk, reducing S3 GET request costs and SQS message volume. Available via the AWS Remote S3 Filter Setup Guide or the Connect to Filter Migration. Can be used alongside or independently of the native TA filtering.
- Deployment Server automation — When installed on a Deployment Server, the TA automatically stages filter configurations for distribution to Heavy Forwarders and provides a one-click “Deploy to Forwarders” button.
- Upgrade notifications — A system message banner alerts administrators when a TA upgrade adds support for new log types that are not covered by existing include filter patterns.
- Daily time filter refresh — A built-in scripted input automatically refreshes the time-based filter cutoff once per day to maintain accuracy of the rolling time window.
- SAP HANA Audit field extractions — 14 EXTRACT, 11 EVAL, and 16 FIELDALIAS directives for the
sap:hana:auditsourcetype. - SAP Web Dispatcher field extractions — 18 EXTRACT, 3 EVAL, and 6 FIELDALIAS directives for the
sap:webdispatcher:accesssourcetype.
Fixed issues¶
- Dashboards moved from Data TA to dedicated LogServ App package for proper distributed deployment support.
Known issues¶
- The dashboards in the LogServ App use Dashboard Studio v2 format and require Splunk 9.4.3 or later.
Third-party software attributions¶
Version 0.0.2-beta¶
Compatibility¶
| Splunk platform versions | 9.4.x, 10.0.x |
| CIM | 5.1.1 and later |
| Supported OS for data collection | Platform independent |
| Vendor products | SAP LogServ for SAP ECS in Amazon Web Services (AWS) |
New features¶
Fixed issues¶
- Drilldown on overview dashboard to host details dashboard had the wrong application name and displayed an error when clicking on the host name.
- Renamed the ‘logserv_web_dispatcher_access.xml’ dashboard to ‘logserv_web_dispatcher.xml’.
- Renamed the ‘sap_rise_host_details.xml’ dashboard to ‘logserv_host_details.xml’.
- Updated the ‘~/ui/nav/default.xml’ with updated dashboard names.
Known issues¶
- The dashboards included in this TA are Dashboard Studio dashboards that may not work with Splunk versions prior to 9.4.
Third-party software attributions¶
Version 0.0.1-beta¶
Compatibility¶
| Splunk platform versions | 9.4.x, 10.0.x |
| CIM | 5.1.1 and later |
| Supported OS for data collection | Platform independent |
| Vendor products | SAP LogServ for SAP ECS in Amazon Web Services (AWS) |
New features¶
Fixed issues¶
Known issues¶
-
Drilldown on overview dashboard to host details dashboard has the wrong application name and displays an error when clicking on the host name.
-
The dashboards included in this TA are Dashboard Studio dashboards that may not work with Splunk versions prior to 9.4.
Third-party software attributions¶
Third-Party Software Licenses¶
Splunk for SAP LogServ bundles open-source software from the npm ecosystem (the React-based LogServ UI App is a webpack-built single-page application). Each component carries its own license, and per those licenses we preserve attribution and bundle the full license text alongside the App.
Where to find the full notices¶
The complete list of bundled third-party packages — names, versions, declared licenses, and full license text — is delivered in two places:
- Inside the App tarball —
splunk_app_sap_logserv/THIRD-PARTY-NOTICES.md(the file is at the root of the installed app directory after extraction) - At the source-tree root — the same file lives at the root of the GitHub release source tarball
The file is generated deterministically from the resolved node_modules/ tree at build time, so its content matches exactly what shipped with the App version you have installed.
License-distribution summary (v0.0.6.0)¶
The v0.0.6.0 build includes 1236 unique top-level packages under node_modules/. The license breakdown:
| License (SPDX as declared) | Count | Inclusion obligation |
|---|---|---|
| MIT | 1012 | Copyright + license text (preserved in THIRD-PARTY-NOTICES.md) |
| ISC | 64 | Copyright + license text |
| Apache-2.0 | 57 | License text + NOTICE if present |
| BSD-3-Clause | 46 | Copyright + license text |
| BSD-2-Clause | 22 | Copyright + license text |
SEE LICENSE IN LICENSE.md (Splunk libs) |
11 | Covered as a Splunk Extension under §1.C of Splunk General Terms |
| BlueOak-1.0.0 | 4 | License text |
| CC0-1.0 / 0BSD / MIT-0 | 7 | Public-domain or near-public-domain (no obligation) |
| BSD-3-Clause AND Apache-2.0 | 1 | License text |
| MIT AND Zlib | 1 | License text |
| MIT OR Apache-2.0 | 1 | Either license; we attribute MIT |
| MIT OR CC0-1.0 | 1 | Either license; we attribute MIT |
| MPL-2.0 OR Apache-2.0 | 1 | We do not modify the file; either license is satisfied |
| MIT OR SEE LICENSE IN FEEL-FREE.md | 1 | MIT chosen |
| MPL-2.0 (axe-core) | 1 | License text only (we do not modify the source) |
| EPL-2.0 (elkjs) | 1 | License text only — file-level weak copyleft; we bundle the package unmodified |
| Python-2.0 | 1 | License text |
| CC-BY-4.0 / CC-BY-3.0 | 2 | Attribution preserved |
| (no declared license field) | 2 | See note below |
Notes¶
- No GPL/AGPL/LGPL components are included in the App. The license posture is fully compatible with commercial redistribution under the standard Splunkbase model.
- Two file-level weak-copyleft components —
axe-core(MPL-2.0) andelkjs(EPL-2.0, the Environment Topology layout engine) — are bundled unmodified. Both MPL-2.0 and EPL-2.0 are file-scoped copyleft (not project-scoped like GPL), and their obligations are satisfied by preserving the license text and not modifying the source, which we do. Neither is in the GPL/AGPL/LGPL family. - Two packages without a declared
licensefield —@mapbox/jsonlint-lines-primitives@2.0.2anduuid-v4@0.1.0— are present as transitive dependencies. Both are de-facto open-source and have been on the public npm registry for years; reviewers preparing legal attestations should consult the upstream repositories listed in the per-component entries ofTHIRD-PARTY-NOTICES.mdfor any final disposition. @splunk/*packages (11 total, declared asSEE LICENSE IN LICENSE.md) are covered as a Splunk Extension under §1.C of the Splunk General Terms — the standard mechanism for redistributing Splunk UI libraries inside a Splunkbase-distributed app.
Refresh policy¶
The THIRD-PARTY-NOTICES.md file is regenerated from the resolved node_modules/ tree at every release. v0.0.5.0 used a one-off generation pass; v0.0.6.0 and later auto-refresh the file as part of the standard yarn build pipeline (bin/generate-third-party-notices.js, run after the webpack output lands in stage/) so the notices and the bundled JavaScript artifacts always agree on what was shipped.
Supported Log Types¶
Overview¶
SAP ECS environment logs are not a singular data source but a collection of OS-specific, SAP environment, database, and other application logs.
Due to the nature of this solution, the SAP LogServ packages are not standalone integrations. To take full advantage of their capabilities (like CIM mapping), you need to install additional TAs as specified in the Prerequisites.
For a streamlined data ingestion process, all selected logs are ingested under one sourcetype: sap_logserv_logs. They are then assigned to a final sourcetype during parsing/indexing on the Heavy Forwarder (or Indexer in single-instance mode), based on the source field.
All events are in NDJSON format with metadata (like _time, host, source, etc.) and the _raw field containing the event contents.
To limit index size, only the _raw field is ingested from each event – metadata fields are either mapped to Splunk’s native metadata fields or dropped.
However clz_dir and clz_subdir fields are preserved to maintain backtracking capabilities. These fields correspond to the directory tree of the original data in object storage.
The Data TA also stamps two attribution fields at index time on every event: splunk_solution (always splunk_for_sap_logserv, identifying events that flowed through this solution) and cloud_provider (aws or azure, identifying the cloud the data was ingested from). The cloud_provider value is controlled by the Data TA’s Configuration → Cloud Provider tab; see Configuring Filters → Cloud Provider Attribution for details.
Ingest channel: AWS S3 or Azure Blob Storage
The sourcetype mappings below apply identically to both ingest channels — AWS S3 (via the Splunk Add-on for AWS) and Azure Blob Storage (via the Splunk TA for SAP LogServ on Azure add-on). The Data TA’s index-time routing transforms key on the source field’s clz_dir/clz_subdir segments, which the SAP LogServ collector writes the same way regardless of object-storage destination. See Azure Setup Guide for Azure-specific configuration; AWS S3 is covered under Prerequisites. Events from either channel carry an indexed cloud_provider field (aws or azure) for cross-cloud reporting.
LogServ Object Storage Path Structure¶
The log files in the SAP LogServ object storage location (AWS S3 bucket OR Azure Blob Storage container) follow this path pattern:
logserv/<clz_dir>/<clz_subdir>/<YYYY>/<MM>/<DD>/<filename>.json.gz
For example:
logserv/linux/messages/2025/09/15/messages-abc123.json.gz
logserv/hana/hanaaudit/2025/10/01/hana-xyz789.json.gz
logserv/dns/binddns/2025/11/20/dns-def456.json.gz
The clz_dir/clz_subdir values are used by the index-time filter to match include/exclude patterns. See Configuring Filters for details.
Sourcetype Mapping¶
SAP HANA Audit (LogServ App)¶
The LogServ App provides search-time field extractions for SAP HANA audit events, including 14 EXTRACT, 11 EVAL, and 16 FIELDALIAS directives.
| Source field value | Sourcetype assigned | Filter path |
|---|---|---|
| hana audit log | sap:hana:audit |
hana/hanaaudit |
SAP Web Dispatcher (LogServ App)¶
The LogServ App provides search-time field extractions for SAP Web Dispatcher access logs, including 18 EXTRACT, 3 EVAL, and 6 FIELDALIAS directives.
| Source field value | Sourcetype assigned | Filter path |
|---|---|---|
| web dispatcher access log | sap:webdispatcher:access |
webdispatcher/accesslog |
SAP ABAP Application Logs (LogServ App)¶
The LogServ App provides search-time field extractions for 9 SAP ABAP application log types. Each sourcetype includes sap_sid and sap_instance extraction from the source metadata field, plus type-specific field extractions.
| Source field value | Sourcetype assigned | Filter path |
|---|---|---|
| ABAP security audit log | sap:abap:audit |
abap/audit |
| ABAP dispatcher log | sap:abap:dispatcher |
abap/dispatcher |
| ABAP enqueue server log | sap:abap:enqueueserver |
abap/enqueueserver |
| ABAP event log | sap:abap:event |
abap/event |
| ABAP gateway log | sap:abap:gateway |
abap/gateway |
| ABAP ICM (Internet Communication Manager) log | sap:abap:icm |
abap/icm |
| ABAP message server log | sap:abap:messageserver |
abap/messageserver |
| ABAP sapstartsrv log | sap:abap:sapstartsrv |
abap/sapstartsrv |
| ABAP work process log | sap:abap:workprocess |
abap/workprocess |
SAP HANA Trace Logs (LogServ App)¶
The LogServ App provides search-time field extractions for HANA trace logs, including SID/instance extraction from the source path.
| Source field value | Sourcetype assigned | Filter path |
|---|---|---|
| HANA trace log | sap:hana:tracelogs |
hana/tracelogs |
SAP Cloud Connector (LogServ App)¶
The LogServ App provides search-time field extractions for SAP Cloud Connector audit and HTTP access logs.
| Source field value | Sourcetype assigned | Filter path |
|---|---|---|
| SCC audit log (CSV format) | sap:scc:audit |
scc/audit |
| SCC HTTP access log | sap:scc:http_access |
scc/tracelogs |
SAP Service Logs (LogServ App)¶
The LogServ App provides search-time field extractions for SAP host-level service logs. These are infrastructure services that run at the host control level (/usr/sap/hostctrl/) rather than within a specific SAP instance.
| Source field value | Sourcetype assigned | Filter path |
|---|---|---|
| SAP Start Service log (auth, SSL/TLS) | sap:sapstartsrv |
sap/sapstartsrv |
| SAP Host Agent execution log | sap:saphostexec |
sap/saphostexec |
| SAP Router connection and trace log | sap:saprouter |
sap/saprouter |
SAP Service Log Details
sap:sapstartsrvincludes fields for OS authentication failures, SSL/TLS negotiation errors (protocol version, cipher suite, peer addresses), and webmethod invocation failures.sap:saproutercovers both.logfiles (CONNECT/DISCONNECT/INVAL DATA events with connection IDs and host addresses) and.trcfiles (NiBuf/NiI error traces with peer/local addresses and return codes) as a single sourcetype.
Splunk Add-on for Unix and Linux¶
| Source field value | Sourcetype assigned | Filter path |
|---|---|---|
| /lastlog | lastlog | linux/linux_secure |
| /var/log/cron | linux:cron | linux/cron |
| /var/log/firewall | linux_secure | linux/linux_secure |
| /var/log/kernel | linux_secure | linux/linux_secure |
| /var/log/localmessages | linux_messages_syslog | linux/localmessages |
| /var/log/messages | linux_messages_syslog | linux/messages |
| /var/log/pacemaker(.log) | linux:slapd | linux/slapd |
| /var/log/slapd.log | linux:slapd | linux/slapd |
| /var/log/sssd(.log) | linux_secure | linux/linux_secure |
| /var/log/sudolog | linux:sudolog | linux/sudolog |
| /var/log/warn | linux:warn | linux/warn |
| /who | who | linux/linux_secure |
Splunk Add-on for Microsoft Windows¶
| Source field value | Sourcetype assigned | Filter path |
|---|---|---|
| WinEventLog:Application | XmlWinEventLog | windows/WinEventLog:Application |
| WinEventLog:(*.)Operational | XmlWinEventLog | windows/WinEventLog:Powershell |
| WinEventLog:Security | XmlWinEventLog | windows/WinEventLog:Security |
| WinEventLog:System | XmlWinEventLog | windows/WinEventLog:System |
Squid Proxy (squid:access)¶
Parsing absorbed natively into the LogServ App in v0.0.5.0 build 184 (from the archived Splunk Add-on for Squid Proxy v2.1.0 — no longer required as a separate install).
| Source field value | Sourcetype assigned | Filter path |
|---|---|---|
| /var/log/squid/access.log | squid:access | proxy/squid |
| /var/log/squid/cache.log | squid:access | proxy/squid |
| /var/log/squid/store.log | squid:access | proxy/squid |
ISC BIND (isc:bind:*)¶
Parsing absorbed natively into the LogServ App in v0.0.5.0 build 184 (from the archived Splunk Add-on for ISC BIND v2.0.0 — no longer required as a separate install).
| Source field value | Sourcetype assigned | Filter path |
|---|---|---|
| /var/lib/named/log/named/default.log | isc:bind:query | dns/binddns |
| /var/lib/named/log/named/general.log | isc:bind:network | dns/binddns |
| /var/lib/named/log/named/lame-servers.log | isc:bind:lameserver | dns/binddns |
| /var/lib/named/log/named/network.log | isc:bind:network | dns/binddns |
| /var/lib/named/log/named/notify.log | isc:bind:transfer | dns/binddns |
| /var/lib/named/log/named/queries.log | isc:bind:query | dns/binddns |
| /var/lib/named/log/named/resolver.log | isc:bind:network | dns/binddns |
| /var/lib/named/log/named/update.log | isc:bind:transfer | dns/binddns |
| /var/lib/named/log/named/xfer-out.log | isc:bind:transfer | dns/binddns |
Filter Path Column
The Filter path column shows the clz_dir/clz_subdir value used in the index-time filter include/exclude patterns. A -- means the log type does not currently have a filter-eligible transform. See Configuring Filters for details.
Prerequisites Overview¶
Splunk for SAP LogServ ships as two separately installable packages with distinct prerequisites. Use this page to plan what you need before starting installation.
The Two Packages¶
| Package | App ID | Role | Where it installs |
|---|---|---|---|
| LogServ Data TA | splunk_ta_sap_logserv |
Data collection from S3, index-time filtering, deployment server automation, ships the indexes.conf for the two indexes the solution writes to |
Single instance, OR Deployment Server + each Heavy Forwarder + Indexer |
| LogServ UI App | splunk_app_sap_logserv |
Dashboards, AI Assistant chat panel, search-time field extractions | Single instance, OR the Search Head only |
For single-instance deployments, both packages install on the same instance. For distributed topologies, each package goes to its own tier — never SCP a Data TA file to the Search Head, and never SCP a UI App file to a Heavy Forwarder. The Data TA carries indexes.conf defining both sap_logserv_logs (SAP data) and logserv_ai_assistant_audit (AI Assistant audit log); Splunk auto-creates them on indexer install, no separate Index App required.
Both indexes are macro-configurable — sap_logserv_idx_macro (SAP data, default index="sap_logserv_logs") and sap_logserv_audit_idx_macro (audit log, default index="logserv_ai_assistant_audit"). Customers who rename either index update the matching macro definition under Settings → Advanced search → Search macros. See Renaming an index for the full procedure (READ + WRITE paths).
Common Prerequisites (both packages)¶
- Splunk Enterprise 9.4.3 or later, or Splunk Cloud Platform
Splunk 9.4.3 is the minimum because the LogServ App’s React stack (@splunk/react-ui, @splunk/visualizations, @xyflow/react) requires the React component versions shipped with that release.
Package-Specific Prerequisites¶
Each package has its own additional prerequisites — install Splunkbase add-ons appropriate to that tier.
- Data TA Prerequisites — CIM-aligned add-ons for the sourcetypes the Data TA produces (Unix/Linux, Windows, Squid, ISC BIND), plus the cloud-storage ingest layer matching where your SAP ECS data lives: the Splunk Add-on for AWS (Splunkbase 1876) for AWS S3 ingest, or the first-party Splunk TA for SAP LogServ on Azure (
splunk_ta_sap_logserv_azure) for Azure Blob Storage ingest — installed per Heavy Forwarder, it consumes Azure Event Grid → Storage Queue notifications (see the Azure Setup Guide). The Data TA also auto-creates the two indexes (sap_logserv_logs+logserv_ai_assistant_audit) from its bundleddefault/indexes.confon first startup — no separate prereq. - LogServ App Prerequisites — the Splunk MCP Server (Splunkbase App 7931) for the AI Assistant’s predefined-prompt dispatch path, plus the optional Splunk AI Assistant (App 200) recommended companion.
Multi-cloud ingest
AWS S3 and Azure Blob Storage are first-class ingest channels. AWS S3 ingest uses the Splunk Add-on for AWS on the Heavy Forwarder tier; Azure Blob Storage ingest uses the first-party Splunk TA for SAP LogServ on Azure add-on (splunk_ta_sap_logserv_azure), installed per Heavy Forwarder (Event Grid → Storage Queue). The same LogServ Data TA + LogServ App handle both: events from either channel land under sap_logserv_logs and route to the same downstream sourcetypes. See the Azure Setup Guide for Azure-specific configuration.
Decision Tree¶
| Your situation | What you need |
|---|---|
| Single Splunk instance running the full LogServ solution | Both prerequisite sets — Data TA + App, plus the Splunk Add-on for AWS (1876) for AWS S3 ingest, or the LogServ Azure add-on (splunk_ta_sap_logserv_azure) for Azure Blob ingest |
| Distributed Splunk with on-prem Search Head | Data TA prereqs on DS + each HF + the indexer; App prereqs on the SH; the AWS S3 add-on (AWS ingest) or the LogServ Azure add-on (Azure ingest) on each HF |
| Distributed Splunk with Splunk Cloud Search Head | Data TA prereqs on DS + each HF; App prereqs on the Splunk Cloud SH; the AWS S3 add-on (AWS ingest) or the LogServ Azure add-on (Azure ingest) on each HF; Splunk Cloud admin handles the indexer tier (Data TA installed there provides the index defs) |
| Splunk Cloud Search Head only (no on-prem ingest tier) | App prereqs only — your Splunk Cloud admin handles the data tier (including the AWS S3 add-on for AWS ingest or the LogServ Azure add-on for Azure ingest) and the indexer tier separately |
Next Steps¶
- Quick Install Reference — single-page matrix mapping every Splunkbase add-on + LogServ component to the tier(s) where each gets installed
- Data TA Prerequisites — for the data collection tier
- LogServ App Prerequisites — for the dashboards + AI Assistant tier
- On a single-instance deployment the Data TA auto-creates the SAP data + AI Assistant audit indexes on first install; on distributed / indexer-cluster / Splunk Cloud deployments you create them on the indexer tier. No separate Index App is required. See Create the indexes.
- Architecture — full topology overview
Quick Install Reference¶
A single matrix mapping every Splunkbase add-on, prerequisite, and LogServ component to the tier(s) where each gets installed. Use this as a pre-install checklist; for full install steps see the per-package pages linked from each row.
Package Matrix¶
Single-instance Splunk
For a single-instance Splunk deployment (one host playing every role), install every required app on that one host. The matrix below is for distributed topologies — column headings refer to specific tiers. SH = Search Head, IDX = Indexer, HFs = Heavy Forwarders, DS = Deployment Server.
| App | Splunkbase | Required? | SH | IDX | HFs | DS |
|---|---|---|---|---|---|---|
LogServ Data TA (splunk_ta_sap_logserv) |
this repo | required | — | ✓ (indexes.conf) | ✓ (via DS) | ✓ (filter UI) |
LogServ App (splunk_app_sap_logserv) |
this repo | required | ✓ | — | — | — |
| Splunk Add-on for Unix and Linux | 833 | required (field extraction) | ✓ | — | — | — |
| Splunk Add-on for Microsoft Windows | 742 | required (field extraction) | ✓ | — | — | — |
| Splunk Add-on for AWS | 1876 | required if SAP ECS in AWS | — | — | ✓ (S3 inputs) | — |
| Splunk MCP Server | 7931 v1.1.0+ | required for AI Assistant | ✓ | — | — | — |
| Splunk AI Assistant | 200 | recommended companion to 7931 | ✓ | — | — | — |
Notes¶
- Indexer rationale. The Data TA goes on the indexer because it bundles
indexes.conf. See Why does the Data TA need to go on the Indexer? for the trade-off + opt-out path. - OS field-extraction add-ons go on the SH only. The Unix/Linux (833) and Windows (742) TAs carry only search-time content (props/transforms/eventtypes/tags/lookups for the parsing the LogServ App’s dashboards consume); none of them need to run on the indexer or HFs for our pipeline. They are required for the OS-level dashboards to fully populate — the LogServ App ships no
XmlWinEventLogextraction of its own, so without add-on 742 on the search tier the Windows dashboard’s Event Codes, Severity Distribution, Critical/Error, and Service Events panels render empty even though the events index fine (see Windows dashboard). They are also what makes the OS sourcetypes CIM-compliant for Enterprise Security. Tier: install on the Search Head (Splunk Cloud: the Cloud SH via self-service app management) — not the HF or indexer; on Splunk Cloud the search-time extraction runs on the SH and is replicated to the indexer search peers via the knowledge bundle. If your installation also uses one of these TAs’ scripted inputs for some other purpose (e.g., thecpu.sh/vmstat.shmodular inputs in Splunk_TA_nix), follow that TA’s own installation guidance for the indexer/HF side — that usage is independent of this app. - No standalone Squid Proxy or ISC BIND add-ons needed. Their parsing was absorbed into the LogServ App in v0.0.5.0 build 184 (Squid Add-on 2965 v2.1.0 — archived on Splunkbase; ISC BIND Add-on 2876 v2.0.0 — archived). If you have either standalone TA installed alongside the LogServ App, the App’s home view shows a one-time dismissible banner recommending uninstall via
Settings → Manage Apps(otherwise both TAs’ parsing applies in parallel — duplicate field extraction). - AWS Add-on (1876). Only needed when SAP ECS data lives in AWS S3. The TA owns the SQS-based S3 inputs that pull data from the dest bucket; the LogServ Data TA then sourcetype-routes events as they’re parsed on HFs. The actual
index = sap_logserv_logssetting that sends events to the right place lives in this TA’s S3 input config — not in the LogServ Data TA. - Azure Blob Storage ingest — LogServ Azure add-on, per HF. When SAP ECS data lives in Azure Blob Storage, ingest is handled by the first-party Splunk TA for SAP LogServ on Azure add-on (
splunk_ta_sap_logserv_azure) and itssap_logserv_azure_queuemodular input (the Azure twin of the AWS SQS-S3 input): an Azure Event Grid subscription dropsBlobCreatednotifications onto a Storage Queue, and the input consumes the queue and fetches each blob over a SAS. It emitssourcetype = sap_logserv_logsso the LogServ Data TA’s routing applies identically to the AWS path, and stamps_meta = cloud_provider::azure. Install the Azure add-on directly on each Heavy Forwarder (not via the Deployment Server) — its SAS lives in the add-on’s ownlocal/. Customers ingesting from BOTH clouds install the AWS Add-on (1876) for the S3 path and the LogServ Azure add-on for Azure, both on the HF tier. See the Azure Setup Guide for the full setup (Event Grid + Storage Queue + per-HF install). - MCP Server (7931). Required for the AI Assistant’s predefined-prompt path even when the LLM-driven path is disabled. Without it, the AI Assistant chat panel can’t dispatch saved searches.
- Splunk AI Assistant (200). The LogServ App uses only the core
splunk_run_saved_searchandsplunk_run_queryMCP tools (which work standalone against 7931), but App 200 follows Splunk’s documented co-install pattern and unlockssaia_*-prefixed MCP tools that may be used in future LogServ releases.
Per-Topology Checklists¶
Single Splunk instance¶
Install all required + recommended apps on the same instance. Splunk auto-creates both indexes (sap_logserv_logs + logserv_ai_assistant_audit) when the Data TA loads on first start.
Distributed (DS + HFs + on-prem SH+IDX)¶
| Tier | Install |
|---|---|
| Search Head | LogServ App, MCP Server (7931), Splunk AI Assistant (200), CIM add-ons (Unix/Linux, Windows) |
| Indexer | LogServ Data TA (provides indexes.conf for both indexes). The CIM add-ons are not needed here — they carry only search-time content. |
| Deployment Server | LogServ Data TA (manages filter UI + pushes Data TA to HFs) |
| Heavy Forwarders | Receive LogServ Data TA via the DS automatically. For AWS S3 ingest, install the AWS add-on (1876); for Azure Blob Storage ingest, install the LogServ Azure add-on (splunk_ta_sap_logserv_azure) directly on each HF — not via the DS (see the Azure Setup Guide). The CIM add-ons are not needed here. |
Distributed (DS + HFs + Splunk Cloud SH)¶
| Tier | Install |
|---|---|
| Splunk Cloud Search Head | LogServ App, MCP Server (7931), Splunk AI Assistant (200), CIM add-ons (Unix/Linux, Windows) |
| Splunk Cloud Indexer tier | Splunk Cloud admin handles. Either (a) install the LogServ Data TA there to use the bundled index defs, OR (b) the Cloud admin manually creates sap_logserv_logs and logserv_ai_assistant_audit via the Splunk Cloud UI — see Why does the Data TA need to go on the Indexer?. |
| Deployment Server | LogServ Data TA |
| Heavy Forwarders | Receive LogServ Data TA via the DS. For AWS S3 ingest, install the AWS add-on (1876); for Azure Blob Storage ingest, install the LogServ Azure add-on (splunk_ta_sap_logserv_azure) directly on each HF — not via the DS. |
Next Steps¶
- Architecture — full topology diagram + the why behind the package split
- Data TA Prerequisites — Splunkbase TA prereq detail (which CIM add-on covers which sourcetype)
- LogServ App Prerequisites — MCP Server + AI Assistant prereq detail
- Installing the Data TA — full install procedure including the indexer-tier rationale
- Installing the LogServ App
Upgrading from v0.0.5 to v0.0.6¶
v0.0.6 is a dashboard-performance release — the feature set is unchanged from v0.0.5. The upgrade is UI-App-only and requires no data re-ingest: search-time field extractions, sourcetype routing, and the Data TA are all unchanged. This page covers what changes, the two things to do after upgrading, and how to roll back.
The two things to know before you upgrade
- Dashboards look empty until the rollup cache is populated — run the one-click backfill after upgrading (or wait for the hourly aggregation to fill them in over the following day).
- Enterprise Security search cadences change — v0.0.6 ships the ES content enabled by default on a re-staggered, collision-free schedule; the eight previously-sub-hourly correlation searches now run hourly and the four anomaly searches run daily. Re-tune any of them in
local/savedsearches.confif you want different cadences.
Data TA (splunk_ta_sap_logserv) — effectively a no-op¶
The v0.0.6 Data TA is byte-identical to the v0.0.5 Data TA (its internal app.conf version stays 0.0.5; the 0.0.6.0 in the filename is snapshot-naming continuity only). Sourcetype routing, index-time filtering, Deployment Server automation, and the index definitions (sap_logserv_logs, logserv_ai_assistant_audit) are unchanged.
If you are already on the released v0.0.5 Data TA, installing the v0.0.6 Data TA changes nothing — you can skip it, or reinstall it harmlessly. There is no change to the Heavy Forwarder / Deployment Server tier.
UI App (splunk_app_sap_logserv) — what changes¶
Dashboards populate from a cache that starts empty¶
v0.0.6 dashboards read most panels from KV-Store rollup collections that are created empty on upgrade. Until they are populated, rolled-up panels show no data. Two ways they fill:
- Run the backfill once (recommended on any non-trivial install): Settings → Dashboard Data → Run backfill seeds 30 days of history immediately. It is idempotent and resumable.
- Otherwise the hourly aggregation searches fill the cache one hour at a time going forward, so dashboards fill in over the following day.
The tstats-tier panels (Data Pipeline Overview, Host Details counts, Multi-Cloud Overview, and the count KPIs) work immediately — they read the index directly and need no rollup. See Dashboard Performance & Data Freshness.
Enterprise Security content stays enabled, on a new schedule¶
The 22 splunk_sap_logserv_es_* saved searches ship enabled by default in v0.0.6 (as they did in v0.0.5), but on a re-staggered, collision-free schedule. To fit it, the eight correlation searches that previously ran every 5–15 minutes now run hourly, and the four behavioral-anomaly searches run daily instead of hourly — a daily run still evaluates every hourly bucket of the prior day, so no detections are missed, and the two heavy 30-day scans no longer run every hour.
- No ES installed → the searches run but their
action.notable/action.riskdirectives no-op; their results stay searchable and power the AI Assistant Security-pack prompts. If you’d rather not incur the scheduled load, see Enterprise Security → Disabling or tuning the ES content. - ES installed → Notable / Risk / Asset & Identity output continues, on the new cadence. See Enterprise Security → The ES schedule.
- If you had explicitly set ES search state or cadence in
local/savedsearches.conf, that local override persists and wins over the new default.
New scheduled searches, new collections, and a restart¶
The upgrade adds the rollup-aggregate / retention / beaconing scheduled searches and ~29 KV-Store rollup collections. A Splunkd restart is required for the collections to be created and the new searches to register — Splunk Web’s “Install app from file” upgrade prompts for it. The scheduled searches are staggered (hourly aggregates at :05–:28, retention at :30–:58) so the scheduler never bursts — see Scheduled-search schedule.
Visible UI / panel changes (cosmetic — no action needed)¶
- Every chart and table panel header gains a toolbar (Open in Search · Download CSV · Inspect · Refresh) and a loading spinner.
- All percentile charts (p50 / p95 / p99) become Avg + Max by hour; HANA Trace “Slowest SQL Operations” becomes a top-by-max table; Web Dispatcher “Top URIs” drops its “Unique Clients” column. (See Release Notes → Changed.)
- Rolled-up panels are now hourly-fresh rather than real-time. Sub-hour selections (e.g. “Last 15 minutes”) reflect the last completed hour — use a panel’s Open in Search action for live drill-down.
- Your browser may briefly serve a cached bundle; a hard refresh picks up the new build.
What is preserved¶
- All
local/configuration survives the upgrade — LLM credentials (passwords.conf),ai_assistant_settings.conf, audit acknowledgements, and telemetry. - Search-time field extractions and sourcetype routing are unchanged — existing custom searches, alerts, and reports against
sap_logserv_logskeep working. - Dashboard URLs / routes are unchanged from v0.0.5 (both are the React app).
- No data re-ingest is required — existing indexed data is read as-is.
- The Environment Topology graph keeps working (its base collections persist with data); its right-pane detail tabs are new rollups and fill via the same backfill.
Recommended upgrade sequence¶
- Install the v0.0.6 UI App tarball over v0.0.5 (Apps → Install app from file → Upgrade), and restart when prompted.
- The Data TA is a no-op — skip it, or reinstall harmlessly (no behavior change).
- Hard-refresh the browser.
- Run Settings → Dashboard Data → Run backfill to populate dashboard history immediately.
- If you use Splunk Enterprise Security, re-enable the
splunk_sap_logserv_es_*searches.
Rollback¶
Reinstalling the v0.0.5 UI App tarball reverts cleanly — it is a default/ content swap, and your local/ configuration is preserved. The now-unused rollup collections are harmless and can be left in place. The Data TA needs no rollback (it is unchanged).
At a glance¶
- UI-App-only upgrade; no data re-ingest, no Data TA change.
- Run the Dashboard Data → Run backfill once so dashboards aren’t empty.
- Re-enable the ES searches if you run Enterprise Security.
- A Splunkd restart is needed for the new collections and scheduled searches.
Ended: Getting Started
LogServ Data TA ↵
Data TA Prerequisites¶
This page covers the prerequisites for the LogServ Data TA (splunk_ta_sap_logserv) — the data-collection + index-time-filtering side. For the LogServ App’s prerequisites (the AI Assistant’s MCP Server dependency), see LogServ App Prerequisites.
Splunk Platform Requirements¶
- Splunk Enterprise 9.4.3 or later, or Splunk Cloud Platform
Required Splunk Add-ons¶
The LogServ App depends on two CIM Splunk Technical Add-ons for Linux + Windows sourcetype definitions and CIM mapping. Install on the Search Head only (they carry only search-time content for our pipeline — see Quick Install Reference for the per-tier matrix):
No standalone Squid Proxy or ISC BIND add-ons needed
Previous versions of this app listed the Splunk Add-on for Squid Proxy (Splunkbase 2965, now archived) and Splunk Add-on for ISC BIND (Splunkbase 2876, now archived) as additional prerequisites. Both add-ons’ parsing has been absorbed natively into the LogServ App as of v0.0.5.0 build 184. Do not install the standalone add-ons. If either is detected at runtime, the LogServ App’s home view shows a one-time dismissible banner recommending uninstall via Settings → Manage Apps to avoid duplicate field extraction.
SAP ECS running in Amazon Web Services (AWS)¶
If you have SAP ECS running in Amazon Web Services (AWS) you need to install this additional Splunk Technical Add-on as well. Install it on the Heavy Forwarders only — not on the Search Head or Indexer. The HFs run the SQS-based S3 inputs that pull data from the dest bucket (and own the index = sap_logserv_logs setting on those inputs); the AWS Add-on carries no search-time content the App’s dashboards need, so it has no role on the SH or indexer tier. This matches the per-tier Quick Install Reference matrix (AWS Add-on → HFs column only) and mirrors the per-HF install of the Azure add-on below.
- Splunk Add-on for Amazon Web Services (AWS) Download
- Splunk Add-on for Amazon Web Services (AWS) Documentation
Additional configuration instructions for the Splunk Add-on for Amazon Web Services (AWS) are provided in the Setup guides after the prerequisite steps have been completed so just install for now.
SAP ECS running in Microsoft Azure¶
If your SAP ECS data lands in Microsoft Azure Blob Storage, install the first-party Splunk TA for SAP LogServ on Azure add-on (splunk_ta_sap_logserv_azure) on each Heavy Forwarder — the Azure counterpart to the Splunk Add-on for AWS, and shipped alongside the LogServ App + Data TA in this release. Its sap_logserv_azure_queue modular input consumes Azure Event Grid → Storage Queue notifications, fetches each blob over a SAS, and emits its NDJSON into the same index-time pipeline as the AWS path. In a RISE / SAP ECS deployment, SAP provisions and manages the storage account, Storage Queue, Event Grid subscription, and SAS in the SAP ECS Azure account — you create nothing in Azure; you only install the add-on and configure one input with the values SAP gives you.
Installation + configuration instructions — installing the add-on per Heavy Forwarder (directly, not via the Deployment Server), the parameter values to obtain from your SAP support contact, and the input fields — are in the Azure Setup Guide. The downstream pipeline (sourcetype routing, dashboards, ES integration) is identical between AWS and Azure deployments.
Next Steps¶
Next steps:
Installing the Data TA¶
This page covers installing the Data TA (splunk_ta_sap_logserv). For the LogServ App installation, see Installing the LogServ App.
High Level Steps¶
Below are the high level steps for installing the Data TA. Follow them in order.
Steps 4 and 5 are alternative paths — complete the one that matches your Splunk environment.
- Create a default events index
- Download the Data TA
- Identify where to install the Data TA based on your topology
- Install the Data TA in Splunk Cloud (if applicable)
- Install the Data TA in Splunk Enterprise (if applicable)
1. Create the indexes¶
The solution uses two indexes:
| Index | Purpose | Default name | Macro |
|---|---|---|---|
| SAP data index | Receives every event the Data TA forwards (logs ingested from S3/Azure and routed to the appropriate sourcetype) | sap_logserv_logs |
sap_logserv_idx_macro |
| AI Assistant audit index | Receives every audit event the AI Assistant writes — canned-prompt dispatches, free-form vendor calls (when LLM path is enabled), security blocks, privacy-tier elevations, legal acknowledgements | logserv_ai_assistant_audit |
sap_logserv_audit_idx_macro |
How these indexes get created depends on your topology:
- Single instance (Data TA + LogServ App on one box) — nothing to do. The Data TA ships
default/indexes.confdefining both indexes, and Splunk auto-creates them the first time the Data TA loads, because that one instance is the indexer. - Any topology where the indexer is a separate tier (Deployment Server + Heavy Forwarders + on-prem indexer(s), an indexer cluster, or Splunk Cloud) — you create the indexes on the indexer tier yourself. The Data TA is installed on the DS + HFs, which do not store data, so its bundled
indexes.confnever reaches the indexer. See Creating the indexes on a separate indexer tier below.
Why the Data TA can’t create the index on a separate indexer
An indexes.conf stanza only takes effect on an instance that both has the config and has an indexing role (stores buckets on disk). In a distributed deployment the Data TA lives on the Deployment Server and Heavy Forwarders — neither of which indexes data (the DS distributes apps; HFs parse + forward to the indexer). So the index must be defined on the indexer tier independently of the Data TA. This is standard Splunk practice: index definitions are an indexer-tier concern, delivered the way that tier is managed.
Note
Both the Data TA and the LogServ App include a macro named sap_logserv_idx_macro that resolves to index="sap_logserv_logs". The LogServ App also includes sap_logserv_audit_idx_macro for the audit index. If you use a different index name, follow the Renaming an index procedure below.
Renaming an Index¶
Both indexes are macro-configurable, so customers who need different names (e.g., a corporate naming convention) don’t have to fork the app — they update the macros (and, for the audit index, one config field).
To rename the SAP data index¶
- Pick a new name (e.g.,
splunk_audit_my_org_sap). - Create the index under that new name. Either:
- Add a custom
local/indexes.confto the Data TA with a stanza for your new name ([my_new_index_name]plus the samehomePath/coldPath/thawedPathsettings), OR - Create the index manually through Splunk Web’s Settings → Indexes → New Index UI. (See Splunk Cloud or Splunk Enterprise docs.)
- Add a custom
- Update the macro definition. Open Settings → Advanced search → Search macros, find
sap_logserv_idx_macro, and edit the definition fromindex="sap_logserv_logs"toindex="my_new_index_name". - Redirect the ingest pipeline to the new index name. The actual
index = ...setting that determines where ingested events land lives in the Splunk_TA_aws add-on’s S3 input config (the SQS-based S3 inputs that own the data ingest path), NOT in this Data TA. Update eachfiltr2_logserv_s3_*input’sindexfield to point at the new name. See AWS Remote S3 Filter Setup Guide for where these inputs are configured.
The Data TA’s default [sap_logserv_logs] stanza will still create that index unless you remove or override it via your custom local/indexes.conf. If your environment doesn’t need the default, that’s harmless; if it bothers you, override the stanza locally.
To rename the AI Assistant audit index¶
- Pick a new name (consider keeping the underscore prefix — Splunk uses underscore-prefixed names for internal / operational indexes, and excludes them from default-index searches).
- Create the index under that name (same options as above — local indexes.conf override, OR Splunk Web Settings UI).
- Update the macro definition. Open Settings → Advanced search → Search macros, find
sap_logserv_audit_idx_macro, and edit the definition fromindex="logserv_ai_assistant_audit"toindex="<your_new_name>". This controls READS — the in-app Audit Log Viewer + any user-written queries will resolve the macro to your renamed index. - Update the LogServ App config. Open Settings → AI Assistant → General → Audit & Telemetry, set the Audit index name field to your renamed index, and Save Defaults. This controls WRITES — the AuditWriter posts events to the configured index name.
The conf field controls writes; the macro controls reads. They MUST point at the same index, but Splunk doesn’t auto-sync them — keep them aligned manually whenever you rename.
2. Download the Data TA¶
Download splunk_ta_sap_logserv-0.0.6.tar.gz from the GitHub repository.
v0.0.4.3 changes — Path B Linux sourcetype migration
The v0.0.4.3 Data TA replaces the legacy [set_srctype_for_syslog] transform (which routed cron + warn + sudolog + slapd into Splunk’s pretrained syslog sourcetype) with four dedicated transforms producing four new sourcetypes: linux:cron, linux:warn, linux:sudolog, linux:slapd. This clears Splunkbase precert’s pretrained-sourcetype warning and avoids field-extraction collisions with Splunk_TA_nix’s built-in [syslog] stanza. Existing data with sourcetype=syslog ages out per index retention; the LogServ App’s dashboards OR both old + new sourcetypes during the transition.
3. Where to install¶
Refer to the Architecture page for the full install matrix. In summary:
| Your Topology | Install the Data TA On | Create the indexes On |
|---|---|---|
| Single instance | The single Splunk instance | Auto-created by the Data TA — nothing to do |
| Deployment Server + HFs + on-prem indexer(s) | The Deployment Server (manages filter rules + distributes to HFs). Not on the indexer(s) or search head. | The indexer tier, manually — see Creating the indexes on a separate indexer tier |
| Splunk Cloud | Your HF / Inputs Data Manager (IDM) ingest tier, per Splunk’s add-on-on-Cloud guidance. The Cloud indexer tier is Splunk-managed. | Via the Splunk Cloud console / ACS — see below |
Warning
If you are using a Deployment Server to manage Heavy Forwarders, install the TA on the Deployment Server only. Do not install the TA directly on the Heavy Forwarders — the DS will distribute it automatically when you configure filters. See Configuring Filters for details. Likewise, do not install the Data TA on a standalone indexer or search head — it’s a data-collection add-on, not an indexer/search-tier app.
Creating the indexes on a separate indexer tier¶
When your indexer is a separate tier from where the Data TA runs (any distributed deployment), create the two indexes on the indexer tier yourself. Use the same settings the Data TA’s default/indexes.conf uses so paths and retention match:
[sap_logserv_logs]
homePath   = $SPLUNK_DB/sap_logserv_logs/db
coldPath   = $SPLUNK_DB/sap_logserv_logs/colddb
thawedPath = $SPLUNK_DB/sap_logserv_logs/thaweddb

[logserv_ai_assistant_audit]
homePath               = $SPLUNK_DB/logserv_ai_assistant_audit/db
coldPath               = $SPLUNK_DB/logserv_ai_assistant_audit/colddb
thawedPath             = $SPLUNK_DB/logserv_ai_assistant_audit/thaweddb
frozenTimePeriodInSecs = 7776000
Pick the method that matches how your indexer tier is managed:
Standalone indexer (Splunk Enterprise)¶
Either:
- Splunk Web: Settings → Indexes → New Index — create
sap_logserv_logs, thenlogserv_ai_assistant_audit. Leave the default paths; set the audit index’s retention (Frozen time period) to7776000seconds (~90 days) if you want to match the bundled default. Or - Config file: add the stanzas above to
$SPLUNK_HOME/etc/system/local/indexes.conf(or a small index-definition app of your own) on the indexer and restart Splunkd.
Indexer cluster¶
Add the stanzas above to an indexes.conf inside a configuration bundle app under the cluster manager’s $SPLUNK_HOME/etc/manager-apps/<your_index_app>/local/ (or master-apps/ on older versions), then push the bundle (Settings → Indexer Clustering → Edit → Distribute Configuration Bundle, or splunk apply cluster-bundle). All peer nodes receive the index definitions. Do not install the Data TA in the cluster bundle — only the indexes.conf.
Splunk Cloud¶
The Cloud indexer tier is Splunk-managed — you cannot install apps on it. Create both indexes through the Splunk Cloud console (Settings → Indexes → New Index) or with the Admin Config Service (ACS) CLI/API. Set the audit index’s retention to match if desired. The Data TA still goes on your HF / IDM ingest tier as usual.
Why the Data TA can’t do this for you on a separate indexer
An indexes.conf only takes effect on an instance that both has the config and indexes data. In a distributed deployment the Data TA runs on the Deployment Server + Heavy Forwarders, which don’t store data — so its bundled indexes.conf is inert there and never reaches the indexer. Index definitions are therefore an indexer-tier concern, managed through that tier’s own mechanism (config file, cluster bundle, or Cloud console) — independent of the data-collection Data TA. (On a true single-instance the Data TA is the indexing box, which is the one case where its bundled indexes.conf auto-creates the indexes for you.)
4. Install in Splunk Cloud¶
Install the Data TA to your instance of Splunk Cloud using the instructions below:
If you are using separate forwarders in conjunction with Splunk Cloud, be sure to deploy the add-on to your forwarders as well.
Note
The app installation workflow available to you in Splunk Web depends on your Splunk Cloud Platform Experience: Victoria or Classic. To find your Splunk Cloud Platform Experience, in Splunk Web, click Support & Services > About.
Classic Experience¶
Victoria Experience¶
5. Install in Splunk Enterprise¶
Install the Data TA to your instance of Splunk Enterprise:
5.a From the Splunk Web home screen, click the gear icon next to Apps.
5.b Click Install app from file.
5.c Locate the downloaded splunk_ta_sap_logserv-0.0.6.tar.gz file and click Upload.
5.d If Splunk Enterprise prompts you to restart, do so.
5.e Verify that the add-on appears in the list of apps and add-ons. You can also find it on the server at $SPLUNK_HOME/etc/apps/splunk_ta_sap_logserv.
6. Macros and Deployment Server¶
When the Data TA is pushed from a Deployment Server out to Heavy Forwarders, the bundled macros.conf travels with it — but HFs don’t run user searches, so any macro change is operationally inert on that tier. Macros only resolve at search time on the Search Head. The Data TA carries sap_logserv_idx_macro mainly so DS-admin diagnostic searches on the deployment server itself can resolve the macro.
What this means in practice:
| Scenario | Where the change happens | DS involved? |
|---|---|---|
| Customer renames the data index | SH only — override sap_logserv_idx_macro in the LogServ App’s local/macros.conf (READ), plus update the Splunk_TA_aws S3 input’s index field (WRITE). See Renaming an index above. |
No |
| Customer renames the audit index | SH only — Settings → AI Assistant → General → Audit index name (WRITE), plus override sap_logserv_audit_idx_macro in the LogServ App’s local/macros.conf (READ). See Renaming an index above. |
No |
| Want a custom diagnostic macro present on every HF | Edit etc/deployment-apps/splunk_ta_sap_logserv/local/macros.conf on the DS → trigger a scoped DS reload → HFs pull on next polling cycle. Operational effect: none — HFs don’t resolve macros. The macro is present but unused on the HF tier. |
Yes (cosmetic) |
What the DS does push usefully to HFs from this Data TA: filter rules (which sourcetypes to keep, which to drop, days-in-past window, filter enable/disable) — managed via the Configuration tab in Splunk Web on the DS. See Configuring Filters.
Next Steps¶
- Install the LogServ App on your Search Head
- Install the Splunk MCP Server on your Search Head if you want to use the AI Assistant
- Complete the AWS Setup Guide to configure data collection
- Configure index-time filters to control which log types are indexed
Configuring Filters¶
Overview¶
The Splunk TA for SAP LogServ provides two complementary approaches to filtering LogServ data. You can use either one independently or combine them for defense-in-depth filtering.
| Native TA Index-Time Filtering | AWS Lambda-Based Filtering | |
|---|---|---|
| Where it runs | Inside Splunk at index time | In AWS Lambda, before data reaches Splunk |
| Configured via | Splunk Web UI (Configuration → Filters) | Lambda environment variables or migration config |
| Works with | All deployment scenarios (Connect, Filter, Copy) | S3 Filter and Connect-to-Filter migration only |
| What it filters | Raw NDJSON events via TRANSFORMS queue routing | S3 event notifications via Lambda function |
| License impact | Filtered events consume zero Splunk license | Filtered notifications never reach Splunk |
| Pattern syntax | clz_dir/clz_subdir fnmatch patterns |
clz_dir/clz_subdir fnmatch patterns (same) |
| Time filtering | Days in the Past (epoch regex, refreshed daily) | Days in the Past (Lambda evaluation) |
| AWS resources needed | None | Lambda function, local SQS queue, DLQ |
| Deployment Server support | ✅ Auto-distributes to Heavy Forwarders | N/A (AWS-side only) |
| Upgrade notifications | ✅ Alerts when new log types aren’t covered | ❌ Not available |
Which Approach Should I Use?¶
Choosing a filtering approach
Use Native TA filtering (recommended for most users) if you want the simplest setup — it works with every deployment scenario, requires no AWS resources beyond what you already have, and is managed entirely from Splunk Web. It also provides upgrade notifications when new log types are added to the TA.
Use Lambda-based filtering if you want to reduce the volume of SQS messages that Splunk processes. Because the Lambda filters S3 event notifications before they reach Splunk, unwanted objects are never downloaded from S3 at all. This can reduce S3 GET request costs and Splunk ingestion overhead in very high-volume environments.
Use both together for defense-in-depth. The Lambda filters at the AWS pipeline level, and the native TA filters catch anything that slips through at the Splunk level. Since both use the same clz_dir/clz_subdir pattern syntax, you can keep the configurations aligned.
The remainder of this page covers Native TA Index-Time Filtering in detail. For Lambda-based filtering setup, see the AWS Lambda-Based Filtering section at the bottom of this page or the AWS Remote S3 Filter Setup Guide.
Native TA Index-Time Filtering¶
What It Does¶
Starting with version 0.0.3, the TA includes built-in index-time filtering configured entirely through the Splunk Web UI — no manual editing of configuration files is required.
How It Works
- Include Filters — Only events matching at least one include pattern are eligible for indexing. Everything else is dropped before indexing (zero license cost).
- Exclude Filters — Events matching any exclude pattern are dropped, even if they also match an include pattern. Excludes override includes.
- Time Filter (Days in the Past) — Events with a
_timeolder than the configured number of days are dropped. This prevents backfill of very old log data during initial setup or recovery scenarios.
All filtering happens at index time via TRANSFORMS-based queue routing, so filtered events never consume Splunk license.
Deployment Architectures¶
The TA supports two deployment models. The steps differ slightly depending on which one you use.
Single Instance / Search Head¶
The TA is installed directly on the Splunk instance that indexes data. Filter changes take effect immediately after clicking Save (no restart required).
Deployment Server with Heavy Forwarders¶
The TA is installed on the Deployment Server (DS). The DS distributes the TA and its filter configurations to Heavy Forwarders (HFs) that perform the actual data ingestion. This is the recommended architecture for production environments.
In this model:
- You install and configure the TA on the DS only
- The DS automatically stages configurations for distribution
- You use the built-in Deploy to Forwarders button to push changes to HFs
- HFs receive the TA and filter configs on their next phone-home interval
Note
Splunk Cloud cannot act as a Deployment Server. If you are using Splunk Cloud, you will need a separate on-premises Deployment Server to manage your Heavy Forwarders.
Open the Configuration > Filters Tab¶
- In Splunk Web, open the Splunk TA for SAP LogServ app
- Go to Configuration > Filters
Example

Set Your Filter Options¶
Enable Filtering¶
Check the Enable Filtering checkbox to activate index-time filtering. When disabled, all events are indexed without any filtering.
Include Filters¶
Comma-separated patterns specifying which log types to include. Patterns use the format clz_dir/clz_subdir with fnmatch-style wildcards:
| Pattern | Meaning |
|---|---|
*/* |
Include all log types (default) |
hana/hanaaudit |
Include only HANA audit logs |
linux/* |
Include all Linux log types |
linux/messages, hana/* |
Include Linux messages and all HANA logs |
dns/* |
Include all DNS log types |
Rules:
- Each pattern must be in
dir/subdirformat or a standalone* - A standalone
*is equivalent to*/*(include everything) - Valid characters: letters, numbers,
*,?,.,-,:,_ - This field cannot be empty when filtering is enabled — use
*/*to include everything
Supported Log Types Reference
See the Supported Log Types section below for a complete list of clz_dir/clz_subdir values you can use in your filter patterns.
Exclude Filters¶
Comma-separated patterns for log types to exclude. Same pattern format as includes. Events matching any exclude pattern are dropped even if they also match an include pattern.
Example: To include all Linux logs except cron and slapd:
- Include:
linux/* - Exclude:
linux/cron, linux/slapd
Leave this field empty to exclude nothing.
Days in the Past¶
Whole number (0–3650) specifying the maximum age of events to index. Events with a _time older than this many days from today are dropped before indexing.
- Set to
7to only index events from the last 7 days - Set to
0to disable time-based filtering - Default:
7
How the time filter works
The time filter uses a pre-computed epoch-based regex that is refreshed automatically once per day by a built-in scripted input. If the refresh fails to run for a day, the filter becomes slightly more restrictive (one extra day filtered) — the safer failure mode.
Save¶
Click Save. The TA validates your patterns and generates the necessary configuration files. If there are any validation errors (invalid characters, empty include field, etc.), the save is blocked and an error message is displayed.
Deployment Server: Additional Steps¶
If you are running on a single instance, you can skip this section — filter changes take effect immediately after Save.
What Happens Automatically on Save¶
When you save filter settings on a Deployment Server, the TA automatically:
- Copies the full TA package to
/opt/splunk/etc/deployment-apps/splunk_ta_sap_logserv/ - Mirrors the generated filter configurations (
transforms.conf,props.conf) to the deployment-apps copy - Creates a server class named
SAP_LogServ_HeavyForwardersin a disabled state (if it doesn’t already exist). The server class remains disabled until you configure client targeting in the next step.
After saving, the Filters tab displays:
- A “⚠ Deployment Server Detected” banner
- A “⚙ Server Class Setup Required” or “Client Targeting Needed” notice (first time only)
- A “Deploy to Forwarders” button
Example

Configure the Server Class (First Time Only)¶
The auto-created server class needs client targeting to know which Heavy Forwarders should receive the TA:
- Go to Settings → Forwarder Management
- Find the
SAP_LogServ_HeavyForwardersserver class - Click the three-dot menu → Edit agent assignment
- Add your Heavy Forwarder IP addresses, hostnames, or use
*for all connected forwarders - Save the agent assignment — this also enables the server class
Example

Client Targeting
Use IP addresses for client targeting, as Splunk matches against the client’s IP, hostname, DNS name, or GUID — not the instance name.
Return to the Filters tab — the setup notice should be gone (refresh the page in the browser if needed to see the change in the setup notice).
Example

Deploy to Forwarders¶
- On the Filters tab, click “Deploy to Forwarders” and confirm
- You should see the new updated banner on the filters screen confirming the deployment reload has been initiated
Example

- Wait for your Heavy Forwarders to phone home (typically 30–60 seconds depending on configuration)
- Verify deployment status in Settings → Forwarder Management — HFs should show as “Ok” under the server class, however it may take 5+ minutes to see the status on the forwarders change from
PendingtoOk
Example

Updating Filters on a Deployment Server¶
Whenever you change filter settings:
- Make your changes on the Filters tab and click Save
- Click “Deploy to Forwarders” to distribute the updated configurations
- HFs will pick up the changes on their next phone-home interval
Note
Do not install the TA directly on Heavy Forwarders when using a Deployment Server. The DS manages the TA distribution. Installing locally on an HF can cause configuration conflicts.
Verifying Filters¶
Check Included Data Is Arriving¶
`sap_logserv_idx_macro` | stats count by clz_dir, clz_subdir
You should see data only for log types matching your include patterns.
Index macro
The sap_logserv_idx_macro macro expands to index="sap_logserv_logs" by default. If you changed the index name in your environment, update the macro definition under Settings → Advanced Search → Search Macros or substitute your index name directly in the search.
Check Excluded Data Is Not Present¶
If you configured exclude patterns, verify those log types are absent from search results.
Check Time Filtering¶
Search for events older than your configured cutoff:
`sap_logserv_idx_macro` earliest=-30d latest=-10d
If your Days in Past is less than 10, this search should return no results.
Supported Log Types¶
Log Type Reference¶
The table below lists all log types currently supported by the TA. The clz_dir and clz_subdir columns show the values used in filter patterns. Use these values when configuring your include and exclude filters.
| clz_dir | clz_subdir | Splunk Sourcetype |
|---|---|---|
| abap | audit | sap:abap:audit |
| abap | dispatcher | sap:abap:dispatcher |
| abap | enqueueserver | sap:abap:enqueueserver |
| abap | event | sap:abap:event |
| abap | gateway | sap:abap:gateway |
| abap | icm | sap:abap:icm |
| abap | messageserver | sap:abap:messageserver |
| abap | sapstartsrv | sap:abap:sapstartsrv |
| abap | workprocess | sap:abap:workprocess |
| dns | binddns | isc:bind:query, isc:bind:lameserver, isc:bind:network, isc:bind:transfer |
| hana | hanaaudit | sap:hana:audit |
| hana | tracelogs | sap:hana:tracelogs |
| linux | cron | linux:cron |
| linux | localmessages | linux_messages_syslog |
| linux | messages | linux_messages_syslog |
| linux | linux_secure | linux_secure, lastlog, who |
| linux | slapd | linux:slapd |
| linux | sudolog | linux:sudolog |
| linux | warn | linux:warn |
| proxy | squid | squid:access |
| sap | saphostexec | sap:saphostexec |
| sap | saprouter | sap:saprouter |
| sap | sapstartsrv | sap:sapstartsrv |
| scc | audit | sap:scc:audit |
| scc | tracelogs | sap:scc:http_access |
| webdispatcher | accesslog | sap:webdispatcher:access |
| windows | WinEventLog:Application | XmlWinEventLog |
| windows | WinEventLog:Powershell | XmlWinEventLog |
| windows | WinEventLog:Security | XmlWinEventLog |
| windows | WinEventLog:System | XmlWinEventLog |
Filter pattern examples using this table
- To include all DNS logs:
dns/*ordns/binddns - To include all Linux logs except cron: Include
linux/*, Excludelinux/cron - To include only HANA audit and web dispatcher logs:
hana/hanaaudit, webdispatcher/accesslog - To include all Windows event logs:
windows/* - To include all ABAP application logs:
abap/* - To include specific ABAP types:
abap/icm, abap/gateway - To include all SAP Cloud Connector logs:
scc/* - To include all SAP service logs:
sap/*
Upgrade Notifications¶
How Upgrade Notifications Work¶
When the TA is upgraded to a new version that supports additional log types, a system message banner appears across all Splunk Web pages if your include filter patterns do not cover the newly supported types. This prevents new log types from being silently dropped.
Example

To resolve the notification:
- Open Configuration → Filters in the TA
- Review and update your include patterns to cover the new log types (or use
*/*to include everything) - Save
The banner clears automatically once all supported types are covered.
Troubleshooting¶
Filters Not Taking Effect (Single Instance)¶
- Verify filtering is enabled: Check the Enable Filtering checkbox
- Check
local/transforms.confin the app directory for the generated filter stanzas - Check
_internalfor errors:
index=_internal sourcetype=splunkd component=PersistentScript splunk_ta_sap_logserv
Filters Not Reaching Heavy Forwarders¶
- Verify the server class exists and has client targeting configured in Settings → Forwarder Management
- Verify deployment-apps has the filter configs:
cat /opt/splunk/etc/deployment-apps/splunk_ta_sap_logserv/local/transforms.conf
- Click Deploy to Forwarders and wait for phone-home
- Check HF configs:
cat /opt/splunk/etc/apps/splunk_ta_sap_logserv/local/transforms.conf
Deployment Server Not Detected¶
- The TA detects deployment servers by checking server roles and for connected deployment clients
- Verify your Heavy Forwarders are configured as deployment clients pointing to the DS
- Check with:
curl -sk -u admin:<password> \
  "https://localhost:8089/services/deployment/server/clients?output_mode=json&count=1"
Validation Error on Save¶
- Include patterns must not be empty when filtering is enabled — use
*/*to include all - Patterns must use
dir/subdirformat with only valid characters (letters, numbers,*,?,.,-,:,_) - Days in the Past must be a whole number between 0 and 3650
Time Filter Seems Off by a Day¶
The time filter epoch cutoff is refreshed once per day by a scripted input. After changing the Days in Past value, the cutoff regex is regenerated immediately on Save. If the daily refresh fails, the filter becomes slightly more restrictive (safer failure mode).
Cloud Provider Attribution¶
What It Does¶
The Configuration page has two tabs: Filters (covered above) and Cloud Provider. The Cloud Provider tab controls how the Data TA attributes each event to the cloud it was ingested from.
The Data TA stamps two indexed fields at index time on the bootstrap sap_logserv_logs sourcetype — the same WRITE_META mechanism it uses to preserve clz_dir and clz_subdir:
| Indexed field | Value | How it’s set | Configurable |
|---|---|---|---|
splunk_solution |
splunk_for_sap_logserv |
Always stamped on every event | No — ships active, no UI control |
cloud_provider |
aws / azure / (none) |
Stamped per the Cloud Provider dropdown | Yes — Configuration → Cloud Provider |
Both fields are written at index time on the Heavy Forwarder (or the indexer in single-instance mode), so they are available as indexed fields for tstats, accelerated searches, and raw-event filtering.
The splunk_solution Field (always-on)¶
Every event indexed through the Data TA carries splunk_solution = splunk_for_sap_logserv. This is a static attribution stamp — there is no UI control and nothing to configure. It identifies events that flowed through the Splunk for SAP LogServ pipeline, which is useful when the same index or Splunk instance also receives data from other solutions.
splunk_solution is distinct from vendor_product
The LogServ App also defines a per-sourcetype vendor_product search-time field (e.g., SAP HANA, SAP NetWeaver ABAP, SAP Web Dispatcher, ISC:Bind) that dashboards and CIM mapping rely on. That field describes which product produced a given event. splunk_solution is a separate, coarser stamp identifying the solution — this TA — that ingested it. The two coexist and do not collide.
The cloud_provider Field (dropdown-driven)¶
On the Cloud Provider tab, the Cloud Provider dropdown has three choices:
| Selection | Effect |
|---|---|
| Not set (default) | No cloud_provider value is stamped at index time. |
| AWS | Every event this TA processes is stamped cloud_provider = aws. |
| Microsoft Azure | Every event this TA processes is stamped cloud_provider = azure. |
Click Save to apply. On a single instance the change takes effect immediately. On a Deployment Server, click Deploy to Forwarders (see below) to push it to the Heavy Forwarders.
Relationship to the search-time default macro¶
The LogServ App ships a search-time macro, sap_logserv_cloud_provider_default_macro, defined as:
eval cloud_provider=coalesce(cloud_provider, "aws")
This macro defaults any event WITHOUT an indexed cloud_provider value to aws at search time, so legacy events that pre-date this feature (or events from a TA left at Not set) still report a provider in dashboards such as Multi-Cloud Overview. Setting the dropdown to AWS makes that attribution explicit at index time — preferable for any new Heavy Forwarder rollout, because the indexed field can then be used directly in raw-event searches, not only in macro-wrapped dashboard panels.
Relationship to the per-input _meta¶
The LogServ Azure add-on’s sap_logserv_azure_queue input carries _meta = cloud_provider::azure on its stanza automatically (the add-on injects it), so Azure events self-attribute regardless of the dropdown — see the Azure Setup Guide. The Cloud Provider dropdown is the simpler, Data-TA-managed way to stamp the same value on every event a Heavy Forwarder’s Data TA processes (useful for the AWS side, or as a single-cloud override). For a Heavy Forwarder that ingests from a single cloud, the dropdown is the recommended mechanism.
Mixed-cloud single Heavy Forwarder
The Cloud Provider dropdown is a TA-wide (per-HF) setting — it stamps the same value on every event that HF’s Data TA processes. If a single Heavy Forwarder ingests from BOTH AWS S3 AND Azure Blob Storage, the dropdown cannot tell the two channels apart — and because the sap_logserv_azure_queue input stanza already carries _meta = cloud_provider::azure, setting the dropdown to aws would tag Azure events with BOTH values. In that case, leave the dropdown at Not set and attribute per input instead: set _meta = cloud_provider::aws on the Splunk_TA_aws SQS-based S3 input(s); the sap_logserv_azure_queue input already carries _meta = cloud_provider::azure. With the dropdown at Not set the TA adds no cloud_provider stamp of its own, so each input’s _meta value is the only one written.
Deploy to Forwarders (Deployment Server)¶
The Cloud Provider tab uses the same deployment flow as the Filters tab. When you Save on a Deployment Server, the TA writes the selection into its local/transforms.conf and mirrors it to the deployment-apps/ copy. Click Deploy to Forwarders to trigger a scoped reload of the SAP_LogServ_HeavyForwarders server class; the Heavy Forwarders pick up the change on their next phone-home (typically 30–60 seconds). This is identical to the Filters-tab deploy procedure described earlier on this page — same server class, same button.
AWS Lambda-Based Filtering¶
Overview¶
The Lambda-based filtering approach filters S3 event notifications in AWS before they reach Splunk. A Lambda function sits between the cross-account SQS queue (in the SAP ECS account) and a local SQS queue (in your Secondary account). It evaluates each S3 event notification against include/exclude path patterns and a time-based cutoff, forwarding only matching notifications to the local queue that Splunk polls.
When to use Lambda-based filtering
- You want to reduce the number of S3 GET requests Splunk makes (cost savings in high-volume environments)
- You want to reduce SQS message volume before it reaches Splunk
- You want filtering to happen at the AWS pipeline level as an additional layer
How It Works¶
SAP ECS Account                    Your Secondary Account
+--------------+    +-----------+    +------------+    +-----------+
| S3 Bucket    |--->| SQS Queue |--->|   Lambda   |--->| Local SQS |--->  Splunk HF
| (LogServ)    |    | (cross)   |    |  (filter)  |    |  Queue    |
+--------------+    +-----------+    +------------+    +-----------+
                                       | Drops non-
                                       | matching
                                       v notifications
The Lambda function evaluates the S3 object key in each notification to extract clz_dir and clz_subdir values, then applies the same fnmatch pattern syntax used by the native TA filtering.
Setup Options¶
There are two ways to deploy Lambda-based filtering:
New Deployment (S3 Filter Setup)¶
If you are setting up from scratch, follow the AWS Remote S3 Filter Setup Guide. The CloudFormation template creates all required AWS resources (Lambda, local SQS queue, DLQ, IAM permissions) in a single deployment.
Migration from Existing S3 Connect Deployment¶
If you already have a working S3 Connect deployment and want to add Lambda-based filtering, follow the AWS Remote S3 Connect to Filter Migration. The Python migration script adds the Lambda resources to your existing IAM infrastructure without recreating it.
Lambda Filter Settings¶
The Lambda function uses three environment variables for its filter configuration:
| Variable | Description | Example |
|---|---|---|
DAYS_IN_THE_PAST |
Drop notifications for objects older than this many days | 7 |
INCLUDE_FILTERS |
Comma-separated fnmatch patterns for paths to include | linux/*,hana/* |
EXCLUDE_FILTERS |
Comma-separated fnmatch patterns for paths to exclude | linux/cron,linux/slapd |
These use the same clz_dir/clz_subdir pattern format as the native TA filters. If you are using both approaches, keep the patterns aligned for consistent behavior.
Comparing the Two Approaches Side by Side¶
Consider a scenario where you want to ingest only hana/* and linux/messages logs from the last 7 days:
Native TA filtering only (simplest)
- Setup: Configure the Filters tab with include
hana/*, linux/messagesand days in past7 - What happens: All S3 objects are downloaded by Splunk, but unwanted events are dropped at index time via TRANSFORMS before consuming license
- Pros: No extra AWS resources, managed from Splunk Web, upgrade notifications, works with any deployment scenario
- Cons: Splunk still downloads and parses all S3 objects before filtering
Lambda filtering only
- Setup: Configure Lambda with the same include/exclude/days patterns
- What happens: The Lambda drops S3 event notifications for unwanted objects before Splunk ever sees them. Splunk only downloads matching objects from S3
- Pros: Reduces S3 GET request costs, lower Splunk ingestion overhead
- Cons: Requires Lambda + local SQS + DLQ in AWS, no upgrade notifications, filter changes require updating Lambda environment variables
Both together (defense-in-depth)
- Setup: Same patterns configured in both Lambda and the Filters tab
- What happens: Lambda filters at the AWS level first, then native TA filtering catches anything that slips through at the Splunk level
- Pros: Maximum coverage, safety net if either filter is misconfigured
- Cons: Two places to maintain filter configurations
Next Steps¶
Return to the Setup Guides Overview for AWS data pipeline configuration, or see the Developer Reference for technical internals.
Splunk Cloud Victoria — Customer-Tier Admin Notes¶
Splunk Cloud Victoria (10.x and later) routes admin access through a different role model than Splunk Enterprise. This page covers the differences that affect Splunk for SAP LogServ installs on Splunk Cloud Victoria — what your customer-tier admin can and can’t do, what we’ve done in the LogServ packages to make customer-tier admins productive, and what you’ll need to coordinate with Splunk Cloud Support.
If you’re installing on Splunk Enterprise (on-prem or BYOL), none of this page applies — Splunk Enterprise’s admin role is the universal admin with no capability gaps to work around.
Splunk Cloud Victoria role tiers¶
| Role | Who gets it | What it can do on this deployment |
|---|---|---|
sc_admin |
Reserved for Splunk Cloud Operations staff at Splunk Inc. | Full admin. Splunk Cloud customers typically do not see this role exposed in their stack’s Settings → Access Controls → Roles list. |
sc_subadmin |
Customer’s effective top admin role | Manages most knowledge objects + apps. May or may not include admin_all_objects depending on the stack’s provisioning. |
power, user |
Standard non-admin roles | Search + dashboard view; cannot install or configure apps. |
Verify which tier you have: sign in to your Splunk Cloud Victoria URL → Settings → Access Controls → Roles → click the role assigned to your account → Capabilities tab. If you see sc_admin listed as an available role, your stack exposes it; if not, sc_subadmin is the top customer-side admin role.
Verify whether your sc_subadmin has admin_all_objects: in the same Capabilities tab, look for admin_all_objects in the assigned capabilities list. Some Splunk Cloud Victoria deployments grant it to sc_subadmin automatically; locked-down deployments do not. This single capability controls whether several REST endpoints accept your writes — see Capability-gated endpoints below.
Capability-gated REST endpoints¶
Splunk’s REST framework enforces some capability requirements server-side, independent of any per-object access control list. These gates affect what your sc_subadmin account can do on the LogServ packages:
| REST endpoint | Gate | LogServ usage |
|---|---|---|
/storage/passwords |
edit_storage_passwords (typically granted to sc_subadmin) |
LLM provider credentials, HEC audit-forwarder tokens, MCP bearer tokens |
/storage/collections/data/<collection> |
None — collection-level metadata ACL only | AI Assistant settings + acks (since session 042), topology layouts, dashboard refresh preferences |
/configs/conf-<name>/... |
admin_all_objects (hardcoded in the REST framework) |
Historical AI Assistant settings storage — migrated to KV Store in session 042 to dodge this gate |
/data/inputs/<service> |
admin_all_objects |
UCC modular input writes — bypassed in the Demo Gen TA via passSystemAuth = true on its admin_external handler |
The takeaway: even with full metadata.meta write permission on an object, certain REST endpoints will return 403 to your sc_subadmin account if admin_all_objects isn’t granted. The LogServ packages have been built to either avoid these endpoints (KV Store, where possible) or work around them via system-context bypasses (passSystemAuth, where the admin_external pattern applies).
What the LogServ packages do for customer-tier admins¶
These changes are baked into the current canonical tarballs in release_binaries/. You don’t need to configure anything; they take effect automatically when you install on Splunk Cloud Victoria:
sc_subadmin in metadata/default.meta write ACL¶
Both the LogServ App and the Data TA ship with sc_subadmin in their global write ACL: access = read : [ * ], write : [ admin, sc_admin, sc_subadmin ]. This grants sc_subadmin write access to every knowledge object in the app (saved searches, macros, lookups, eventtypes, tags, etc.) at the metadata layer.
The Data TA’s metadata/default.meta is post-build-patched into the released tarball — UCC’s stock build template would silently overwrite the source-level value with [ admin, sc_admin ], so additional_packaging.py re-injects sc_subadmin after the UCC step. See tools/scripts/patch_data_ta_sc_subadmin_metadata.py for the standalone repair script that can also patch an already-built Data TA tarball without re-running UCC.
edit_deployment_server capability (not admin_all_objects)¶
The Data TA’s /splunk_ta_sap_logserv/deployment_push REST handler is gated by edit_deployment_server — a Splunk-standard capability that’s typically granted to sc_subadmin on Splunk Cloud Victoria. The earlier requirement of admin_all_objects would have blocked sc_subadmin from triggering deployment-server pushes; the change makes the in-app deployment-push UI usable for customer-tier admins.
AI Assistant settings + T&C acks in KV Store¶
The AI Assistant’s admin-controlled settings (enabled, provider, default_model, tier, mcp_required, audit forwarder config, etc.) and the legal-acknowledgement state for the two T&C modals (Enable AI Assistant; Disable Audit Forwarder) are stored in two KV Store collections:
logserv_ai_assistant_settings— single row keyeddefaults, holds all 17 admin-controlled settings fieldslogserv_ai_assistant_acks— one row per legal-stanza name, holds the per-user opt-in version + choice + timestamp
KV Store endpoints are governed only by the collection-level metadata ACL — no admin_all_objects capability requirement. Both collections ship with write : [ * ] so any authenticated admin-tier user can write. Without this migration (which happened in session 042), sc_subadmin users on locked-down Splunk Cloud Victoria deployments would hit 403 on every Save Defaults click and every T&C modal Submit.
A one-shot migration helper in App.tsx’s mount effect copies pre-migration values from local/ai_assistant_settings.conf and local/ai_assistant_acks.conf into the new KV Store rows on first page load. Customers upgrading from a build that wrote settings to local conf-files don’t lose their settings.
useIsAdmin recognizes sc_admin + sc_subadmin¶
The React UI’s admin-gating hook (hooks/useIsAdmin.ts) recognizes admin, sc_admin, AND sc_subadmin as admin-tier roles. Without this expansion, the AI Assistant Settings page would render a 403 “Admin access required” fallback for any sc_subadmin user even when their role can do everything the page needs.
Splunk MCP Server (App 7931) JWT audience requirement¶
This is a customer-side configuration item that’s NOT controlled by anything in the LogServ packages.
Splunk Cloud Victoria’s edge proxy auto-injects a JWT into every /__raw/ splunkd request, derived from the user’s session cookie. The Splunk MCP Server (Splunkbase App 7931) validates that JWT’s aud claim and requires it to be "mcp". Common Splunk Cloud Victoria default audiences (e.g., "Demo" on non-production stacks) cause every MCP request to return:
{
    "jsonrpc": "2.0",
    "id": 1,
    "error": {
        "code": -32600,
        "message": "Invalid token audience: <whatever-your-jwt-has>"
    }
}
…which the LogServ App’s MCP health probe surfaces as the SETUP REQUIRED banner in the AI Assistant.
See Splunk MCP Setup → Splunk Cloud — JWT aud (audience) claim must be mcp for the full diagnostic + remediation path. The short version: re-mint the MCP token with audience=mcp, OR open a Splunk Cloud Support ticket asking them to set the stack’s MCP audience to mcp.
Standalone repair script for the Data TA metadata patch¶
If you’re managing your own Data TA tarball builds (rebuilding from source via UCC, or patching an already-deployed tarball without redeploying), you can apply the sc_subadmin metadata fix in two ways:
1. Auto-applied on every UCC build. sap_logserv_package/splunk_ta_sap_logserv/additional_packaging.py carries patch_sc_subadmin_metadata() which fires as the final job in cleanup_output_files(). Run ./build_logserv_ta.sh <version> from the source tree — the patch lands automatically and the build output prints [additional_packaging] Patched metadata/default.meta: added sc_subadmin to global write ACL.
2. Standalone repair against an extracted or packaged tarball. Use tools/scripts/patch_data_ta_sc_subadmin_metadata.py:
# Against an extracted Data TA directory:
python3 tools/scripts/patch_data_ta_sc_subadmin_metadata.py /path/to/extracted/splunk_ta_sap_logserv

# Against a tarball (extracts, patches, repacks in place + .pre-sc_subadmin-patch.bak backup):
python3 tools/scripts/patch_data_ta_sc_subadmin_metadata.py --tarball /path/to/splunk_ta_sap_logserv-X.Y.Z.tar.gz
Both invocations are idempotent — running on already-patched input is a no-op.
Splunk Cloud Support tickets you may need to file¶
| Symptom | Ticket request |
|---|---|
AI Assistant SETUP REQUIRED banner; MCP requests return Invalid token audience: <X> |
Ask Splunk Cloud Support to set the stack’s MCP-audience claim to mcp, OR to grant your sc_subadmin role the ability to mint MCP tokens with arbitrary audiences |
sc_subadmin cannot install custom apps (private-app vetting blocks them) |
Standard Splunk Cloud private-app submission flow; out of scope for this guide |
sc_subadmin needs admin_all_objects for some non-LogServ workflow |
Coordinate with Splunk Cloud Support — they can grant it on a per-stack basis, but the LogServ packages are designed to not require it |
Splunk Enterprise compatibility¶
Everything on this page is backwards-compatible with on-prem Splunk Enterprise. sc_admin and sc_subadmin are Splunk Cloud-only roles — Splunk Enterprise’s admin role retains all write access. The MCP audience requirement applies only when the platform’s edge proxy injects a JWT, which on-prem Splunk Enterprise doesn’t do (cookie auth flows through __raw directly to splunkd). Enterprise admins see zero behavior change from any of these Cloud-targeted fixes.
Setup Guides Overview¶
Introduction¶
Once the prerequisites and the installation of the Splunk TA for SAP LogServ have been completed, use the provided setup guides to complete the setup based on the cloud provider where your SAP ECS environment is running in and your preferred deployment scenario.
Note
Starting with version 0.0.3, the TA includes built-in index-time filtering that works with all deployment scenarios below. After completing the AWS setup, see Configuring Filters to control which log types are indexed and drop stale data directly from Splunk Web — no Lambda-based filtering required.
Amazon Web Services (AWS)¶
All AWS deployment scenarios achieve the end goal of ingesting LogServ logs into Splunk. However, there are some differences in functionality. All AWS deployment scenarios involve two distinct AWS accounts.
All deployment scenarios for AWS require the use of an AWS Secondary account (a different AWS account than the one SAP ECS is running in) due to the requirement from SAP for a cross-account IAM Role to access the AWS SAP ECS account where the LogServ logs reside. See the diagram below for reference.
For brevity and clarity, the AWS account at the top of the diagram will be referred to as the SAP ECS account and the second AWS account on the bottom of the diagram will be referred to as the Secondary account from this point onward.

The table below lists the AWS Resources required for each deployment scenario:
| AWS Resources | AWS Remote S3 Connect Setup | AWS Remote S3 Filter Setup | AWS Remote S3 Copy Setup |
|---|---|---|---|
| S3 Bucket (SAP ECS account) | ✅ Required | ✅ Required | ✅ Required |
| SQS Queue (SAP ECS account) | ✅ Required | ✅ Required | ✅ Required |
| S3 Bucket (Secondary account) | ❌ Not Required | ❌ Not Required | ✅ Required |
| SQS Queue (Secondary account) | ❌ Not Required | ✅ Required | ✅ Required |
| SQS Queue DLQ (Secondary account) | ❌ Not Required | ✅ Required | ✅ Required |
| IAM Policy (Secondary account) | ✅ Required | ✅ Required | ✅ Required |
| IAM Role (Secondary account) | ✅ Required | ✅ Required | ✅ Required |
| IAM User (Secondary account) | ✅ Required | ✅ Required | ✅ Required |
| Lambda Function (Secondary account) | ❌ Not Required | ✅ Required | ✅ Required |
| Lambda Log Group (Secondary account) | ❌ Not Required | ✅ Required | ✅ Required |
If you want to have a secondary copy of the logs from the S3 bucket in the SAP ECS account, the AWS Remote S3 Copy Setup is the recommended approach. Utilizing that approach ensures you have your own copy of all the logs from the S3 bucket in the SAP ECS account, in a second S3 bucket in your secondary AWS account.
The table below lists the different features supported by each deployment scenario:
| Feature | AWS Remote S3 Connect Setup | AWS Remote S3 Filter Setup | AWS Remote S3 Copy Setup |
|---|---|---|---|
| Secondary Copy of Logs | ❌ Not Supported | ❌ Not Supported | ✅ Supported |
| AWS Lambda-based Filtering | ❌ Not Supported | ✅ Supported | ❌ Not supported |
| Native TA Index-Time Filtering | ✅ Supported | ✅ Supported | ✅ Supported |
Native TA Filtering vs. AWS Lambda-based Filtering
Starting with version 0.0.3, the TA provides native index-time filtering that works with all deployment scenarios. This filtering happens inside Splunk at index time and is configured entirely through the Splunk Web UI.
The AWS Lambda-based filtering (available in the S3 Filter Setup) filters S3 event notifications before they reach Splunk, reducing the number of SQS messages processed. Both approaches can be used independently or together for defense-in-depth filtering.
See Configuring Filters for details on the native TA filtering.
AWS Remote S3 Connect Setup Guide¶
Note
This deployment scenario uses an IAM User with a configured Access Key and a cross-account IAM Role to directly access LogServ resources in the AWS SAP ECS account where the LogServ logs reside without the need to copy logs to a secondary S3 bucket.
- No secondary S3 Bucket needed
- No secondary SQS Queue needed
- CloudFormation Template provided

AWS Remote S3 Filter Setup Guide¶
Note
This deployment scenario uses an IAM User with a configured Access Key and a cross-account IAM Role to directly access LogServ resources in the AWS SAP ECS account where the LogServ logs reside without the need to copy logs to a secondary S3 bucket. It also provides the mechanism to filter logs by times stamp and types of logs via parameters on the Lambda function.
- No secondary S3 Bucket needed
- Secondary SQS Queue needed
- Log filtering options supported
- CloudFormation Template provided

AWS Remote S3 Copy Setup Guide¶
Note
This deployment scenario uses an IAM User with a configured Access Key and a cross-account IAM Role along with a secondary S3 bucket and SQS queue. Use this deployment scenario if you want a copy of all the LogServ logs in your own S3 Bucket.
- Greater control of data + retention
- Requires secondary S3 Bucket
- Requires secondary SQS Queue
- CloudFormation Template provided

AWS Setup Guides ↵
AWS Remote S3 Connect Setup Guide¶
Introduction¶
The deployment diagram below shows two different AWS accounts. For brevity and clarity, the AWS account at the top of the diagram will be referred to as the SAP ECS account and the second AWS account in the middle of the diagram will be referred to as the Secondary account from this point onward.
Ensure you have completed all of the steps in the Prerequisites and the Installation of the Splunk TA for SAP LogServ before you continue with the steps in this setup guide.
Your SAP ECS LogServ subscription for AWS (e.g. in your SAP ECS account) should have one S3 Bucket in that account where LogServ will store your LogServ logs. It should also have one SQS Queue in your SAP ECS account that receives notifications when new logs are added to the S3 Bucket in that account.
You will need obtain the AWS ARN for the SQS Queue and the S3 Bucket that resides in your SAP ECS account prior to performing the steps in this setup guide.
Take note of the AWS Region in your SAP ECS account where the S3 Bucket and SQS Queue are located as you will need to deploy the CloudFormation template provided in that same region in your Secondary account.
Tip
If you want to ingest historical logs from the S3 bucket in the SAP ECS account, the AWS Remote S3 Copy Setup is the recommended approach. Utilizing that approach provides you the ability to copy historical logs from the S3 bucket in the SAP ECS account to a secondary S3 bucket, so they will be ingested into Splunk, with the flexibility to switch over to this remote S3 connect deployment approach afterward.
If you have no interest in obtaining the historical logs then use this remote S3 connect deployment approach.
High Level Steps¶
Below are the high level steps for this setup process listed in the order they should be followed.
Please ensure the user you log in with in your AWS Secondary account has the appropriate permissions to perform all the steps outlined below.
- Obtain the ARNs for the SQS Queue and the S3 Bucket in your SAP ECS account
- Deploy the AWS CloudFormation Template provided for this remote S3 connect deployment approach in your Secondary account
- Contact SAP LogServ support and request an update to the access policies for the SQS Queue and S3 Bucket residing in your SAP ECS account
- Create an Access Key for the new IAM User that was created with the CloudFormation template in your Secondary account
- Configure your AWS Secondary account in the Splunk Add-on for Amazon Web Services (AWS)
- Configure the new cross-account IAM Role from your AWS Secondary account in the Splunk Add-on for Amazon Web Services (AWS).
- Configure a new SQS-Based S3 Input in the Splunk Add-on for Amazon Web Services (AWS).
- Confirm that LogServ logs are being ingested into Splunk
1. Obtain ARNs from SAP ECS Account¶
Before you can deploy the CloudFormation template in your Secondary account, you need to obtain the AWS ARN for two resources that reside in your SAP ECS account:
- The S3 Bucket that stores your LogServ logs
- The SQS Queue that receives notifications when new logs are added to the S3 Bucket
You will also need to note the AWS Region where these resources are located, because the CloudFormation template in the next section must be deployed into that same region in your Secondary account.
What does an ARN look like?
AWS Amazon Resource Names (ARNs) follow a predictable format. Examples:
- S3 Bucket ARN:
arn:aws:s3:::sap-hec-clz-ap-south-1-hec53-xsd - SQS Queue ARN:
arn:aws:sqs:ap-south-1:121212121212:sap-hec-clz-ap-south-1-hec53-xsd-logserv
How to obtain the ARNs:
1.a If you do not have console access to your SAP ECS account, contact SAP LogServ Support to obtain the ARN for the S3 Bucket, the ARN for the SQS Queue, and the AWS Region where these resources reside.
1.b If you do have console access to your SAP ECS account, obtain the ARNs yourself:
- For the **S3 Bucket**: navigate to the S3 console, find the bucket used for LogServ logs, click on the bucket name, and copy the ARN from the **_Properties_** tab.
- For the **SQS Queue**: navigate to the SQS console, find the queue that receives S3 notifications, click on the queue name, and copy the ARN from the **_Details_** section.
1.c Save both ARNs and the AWS Region in a secure location — you will reference them during the next section (Deploy CloudFormation Template) and again when configuring the SQS-Based S3 Input.
2. Deploy CloudFormation Template¶
Before you deploy the CloudFormation template, take note of the AWS Region in your SAP ECS account where the S3 Bucket and SQS Queue are located as you will need to deploy the CloudFormation template provided in that same region in your Secondary account.
What does the CloudFormation template do?
Creates the following resources:
- An IAM User - Default name is splunk_logserv_user
- An IAM Policy named splunk-logserv-ta-policy
- An IAM Role named splunk-logserv-ta-role
- An Inline IAM Policy on the IAM User to assume the IAM Role created above
2.a Navigate to the CloudFormation console (ensure the region you are in matches the region in your SAP ECS account)
2.b Click on the Create stack button and select With new resources (standard)
Example

2.c Upload the AWS CloudFormation Template file provided for this remote S3 connect deployment approach, then click the Next button
Example

2.d Enter a name for the CloudFormation Stack - splunk-logserv-remote-s3-connect
Example

2.e Enter just the name (not the ARN) of the S3 Bucket in your SAP ECS account in the CrossAccountS3Bucket parameter - If your ARN looks like this arn:aws:s3:::sap-hec-clz-ap-south-1-hec53-xsd then just use the name like this ap-hec-clz-ap-south-1-hec53-xsd
Example

2.f Enter the complete ARN of the SQS Queue in your SAP ECS account in the CrossAccountSQSQueueArn parameter
Example

2.g Choose and enter a name for the IAM User to be created in your Secondary account in the NewIAMUserName parameter, then click on the Next button
Example

2.h Scroll down to the bottom of the page and check the I acknowledge that AWS CloudFormation might create IAM resources with custom names checkbox, then click on the Next button
Example

2.i Scroll down to the bottom of the page and click on the Submit button
Example

2.j Ensure the deployment of the CloudFormation template completes successfully
Example

3. Contact SAP LogServ Support¶
Once the deployment of the CloudFormation templates completes successfully, you will need to provide SAP LogServ Support with the ARN of the IAM Role named splunk-logserv-ta-role that was created by the template.
The ARN for the IAM Role should look like the one below but with your 12-digit AWS account Id of your Secondary account.
arn:aws:iam::secondary-account-id:role/splunk-logserv-ta-role
Example access policies for the SQS Queue and S3 Bucket residing in your SAP ECS account are provided as a reference to provide clarity on the specific permissions that need to be applied by the SAP LogServ Support team.
4. Create Access Key for IAM User¶
4.a Navigate to the IAM console in your Secondary account and search for the IAM User name you used when deploying the CloudFormation template. Click on the name of the IAM User to see the user details.
Example

4.b Click on the Security credentials tab in the middle of the screen. Scroll down and click on the Create access key button.
Example

4.c Select the Local code use case, check the Confirmation checkbox and click on the Next button.
Example

4.d Enter a description tag value if desired and click on the Create access key button.
Example

4.e Copy the values for both the Access key and the Secret access key and save them in a secure place as you will need them in the upcoming steps. Now click on the Done button.
Example

5. Configure Secondary Account (AWS Add-on)¶
Please ensure the user you log in with in your Splunk instance has the appropriate permissions to perform all the steps outlined below.
5.a Login to your Splunk console then find and open the Splunk Add-on for AWS App
Example

5.b Click on the Configuration tab, then click on the Account tab, then click on the Add button
Example

5.c Choose and enter a descriptive name for the account in the Name field. Enter the Access Key and the Secret Key you created for the IAM User in the respective fields. Leave the Region Category set to Global. Click on the Add button.
Example

6. Configure IAM Role (AWS Add-on)¶
6.a Click on the IAM Role tab to the right of the Account tab, then click on the Add button
Example

6.b Choose and enter a descriptive name for the role in the Name field. Enter the IAM Role ARN in the IAM Role ARN field, then click the Add button. The ARN for the IAM Role should look like the one below but with your 12-digit AWS account Id of your Secondary account.
- arn:aws:iam::**_secondary-account-id_**:role/splunk-logserv-ta-role
Example

7. Configure SQS-Based S3 Input (AWS Add-on)¶
7.a Click on the Inputs tab. Click on the Create New Input button. Select the Custom Data Type option at the bottom of the drop-down, then select the SQS-Based S3 (Recommended) option.
Example

7.b Fill out the first three fields in the SQS-Based S3 Input (Name, AWS Account, Assume Role)
- Choose and enter a descriptive name for the input
- Select the AWS Account you configured previously
- Select the IAM Role you configured previously
Example

7.c Fill out the next three fields in the SQS-Based S3 Input (Force using DLQ, AWS Region, Use Private Endpoints)
- Leave the **_Force using DLQ (Recommended)_** checkbox **__checked__**
- Select the **_AWS Region_** where you deployed the CloudFormation template previously
- Leave the **_Use Private Endpoints_** checkbox **__unchecked__**
Example

7.d Fill out the next three fields in the SQS-Based S3 Input (SQS Queue Name, SQS Batch Size, S3 File Decoder)
- Enter the **__URL__** of the SQS Queue in your **_SAP ECS account_**, **__not__** the ARN or just the name
    - If the ARN for your SQS Queue in your **_SAP ECS account_** looks like this:
        - arn:aws:sqs:ap-south-1:121212121212:sap-hec-clz-ap-south-1-hec53-xsd-logserv
    - Then format it as a URL like this:
        - https://sqs.ap-south-1.amazonaws.com/121212121212/sap-hec-clz-ap-south-1-hec53-xsd-logserv
- Leave the **_SQS Batch Size_** set to 10
- Leave the **_S3 File Decoder_** set to Custom Logs
Example

7.e Fill out the next three fields in the SQS-Based S3 Input (Signature Validate All Events, Source Type, Index)
- **__Uncheck__** the **_Signature Validate All Events_** checkbox
- Enter the value of **_sap_logserv_logs_** in the **_Source Type_** field
- Enter the name of the Splunk index you want to use in the **_Index_** field
- Click on the **_Add_** button
Example

8. Confirm LogServ Logs are Being Ingested¶
After completing all the previous steps, verify that LogServ logs are successfully being ingested into Splunk.
The first events typically appear within 5-10 minutes of completing the SQS-Based S3 Input configuration. The input polls the SQS Queue at the configured interval (default 300 seconds), so allow a short lag before the first events arrive.
8.a Log in to your Splunk console and open the Search & Reporting app (or the SAP LogServ App if you have installed it)
8.b Run a basic search against the index you configured in the SQS-Based S3 Input to confirm events are flowing:
    index=<your_index_name> | stats count by sourcetype

If you are using the SAP LogServ App, you can use the provided index macro:

    `sap_logserv_idx_macro` | stats count by sourcetype
8.c You should see events from the LogServ sourcetypes your SAP LogServ subscription is forwarding. Depending on the log types enabled, expected sourcetypes may include (but are not limited to):
- `linux_messages_syslog`, `linux_secure`, `syslog` -- Linux OS events
- `isc:bind:query` -- DNS query events
- `squid:access` -- Proxy events
- `XmlWinEventLog` -- Windows events
- `sap:hana:audit`, `sap:hana:tracelogs` -- HANA database events
- `sap:abap:*` -- ABAP application events
- `sap:webdispatcher:access` -- Web Dispatcher events
- `sap:scc:audit`, `sap:scc:http_access` -- Cloud Connector events
8.d Confirm events are arriving with recent timestamps:
    index=<your_index_name> earliest=-1h | stats count by sourcetype, host

You should see recent events from multiple hosts.
8.e If no events appear after 15-20 minutes, troubleshoot as follows:
- **SQS Queue has no messages** -- Verify the SAP LogServ Support team has applied the updated access policies (from Section 3) to the SQS Queue and S3 Bucket in your **_SAP ECS account_**. Without those policies, your **_Secondary account_** cannot receive SQS notifications or read from the S3 Bucket.
- **Authentication or permission errors** -- In the Splunk Add-on for AWS, check the logs for errors: run `index=_internal source=*aws* log_level IN (ERROR,WARN) earliest=-1h | head 50`. Common causes are a mis-copied Access Key/Secret Key (Section 4), an incorrect IAM Role ARN (Section 6), or the IAM Role not yet propagated through AWS (wait 5 minutes after initial setup).
- **SQS URL format** -- Double-check the **_SQS Queue Name_** field in the SQS-Based S3 Input (Section 7) is the full URL (`https://sqs.<region>.amazonaws.com/<account-id>/<queue-name>`), not the ARN or bare queue name.
- **Wrong AWS Region** -- The CloudFormation template (Section 2) and the SQS-Based S3 Input (Section 7) must both be in the same AWS Region as the SQS Queue and S3 Bucket in your **_SAP ECS account_**.
Where to go next
Once you’ve confirmed ingestion is working, explore the dashboards in the LogServ UI App to see your LogServ data in action. The default landing page is the Environment Health dashboard, which provides a cross-cutting view of your entire SAP landscape.
AWS Remote S3 Filter Setup Guide¶
Introduction¶
The deployment diagram below shows two different AWS accounts. For brevity and clarity, the AWS account at the top of the diagram will be referred to as the SAP ECS account and the second AWS account on the bottom left of the diagram will be referred to as the Secondary account from this point onward.
Ensure you have completed all of the steps in the Prerequisites and the Installation of the Splunk TA for SAP LogServ before you continue with the steps in this setup guide.
Your SAP ECS LogServ subscription for AWS (e.g. in your SAP ECS account) should have one S3 Bucket in that account where LogServ will store your LogServ logs. It should also have one SQS Queue in your SAP ECS account that receives notifications when new logs are added to the S3 Bucket in that account.
You will need obtain the AWS ARN for the SQS Queue and the S3 Bucket that resides in your SAP ECS account prior to performing the steps in this setup guide.
Take note of the AWS Region in your SAP ECS account where the S3 Bucket and SQS Queue are located as you will need to deploy the CloudFormation template provided in that same region in your Secondary account.
High Level Steps¶
Below are the high level steps for this setup process listed in the order they should be followed.
Please ensure the user you log in with in your AWS Secondary account has the appropriate permissions to perform all the steps outlined below.
- Obtain the ARNs for the SQS Queue and the S3 Bucket in your SAP ECS account
- Create a new S3 Bucket in the correct AWS Region in your Secondary account and upload the splunk-logserv-filter-lambda.zip file to the root of the bucket
- Deploy the AWS CloudFormation Template provided for this remote S3 filter deployment approach in your Secondary account
- Contact SAP LogServ support and request an update to the access policies for the SQS Queue and S3 Bucket residing in your SAP ECS account
- Create an Access Key for the new IAM User that was created with the CloudFormation template in your Secondary account
- Configure your AWS Secondary account in the Splunk Add-on for Amazon Web Services (AWS)
- Configure the new cross-account IAM Role from your AWS Secondary account in the Splunk Add-on for Amazon Web Services (AWS).
- Configure a new SQS-Based S3 Input in the Splunk Add-on for Amazon Web Services (AWS).
- Review the SQS Queue Trigger in the new Lambda function created with the CloudFormation template
- Confirm that LogServ logs are being ingested into Splunk
1. Obtain ARNs from SAP ECS Account¶
Before you can create the local S3 Bucket and deploy the CloudFormation template in your Secondary account, you need to obtain the AWS ARN for two resources that reside in your SAP ECS account:
- The S3 Bucket that stores your LogServ logs
- The SQS Queue that receives notifications when new logs are added to the S3 Bucket
You will also need to note the AWS Region where these resources are located, because the S3 Bucket and CloudFormation template in the next two sections must be created and deployed into that same region in your Secondary account.
What does an ARN look like?
AWS Amazon Resource Names (ARNs) follow a predictable format. Examples:
- S3 Bucket ARN:
arn:aws:s3:::sap-hec-clz-ap-south-1-hec53-xsd - SQS Queue ARN:
arn:aws:sqs:ap-south-1:121212121212:sap-hec-clz-ap-south-1-hec53-xsd-logserv
How to obtain the ARNs:
1.a If you do not have console access to your SAP ECS account, contact SAP LogServ Support to obtain the ARN for the S3 Bucket, the ARN for the SQS Queue, and the AWS Region where these resources reside.
1.b If you do have console access to your SAP ECS account, obtain the ARNs yourself:
- For the **S3 Bucket**: navigate to the S3 console, find the bucket used for LogServ logs, click on the bucket name, and copy the ARN from the **_Properties_** tab.
- For the **SQS Queue**: navigate to the SQS console, find the queue that receives S3 notifications, click on the queue name, and copy the ARN from the **_Details_** section.
1.c Save both ARNs and the AWS Region in a secure location – you will reference them when creating the S3 Bucket (next section), deploying the CloudFormation Template, and configuring the SQS-Based S3 Input later in this guide.
2. Create S3 Bucket with Lambda Function ZIP File¶
2.a Take note of the AWS Region in your SAP ECS account where the S3 Bucket and SQS Queue are located.
2.b Log into your AWS Secondary account and change to the region that matches the region in your SAP ECS account
2.c Choose a name for the new S3 bucket (splunk-logserv-lambda-binary is the default bucket name in the CloudFormation template used in the next section)
2.d Navigate to the S3 console and create a general purpose S3 bucket using all the default settings
2.e Upload the splunk-logserv-filter-lambda.zip file to the root of the S3 bucket
Example

3. Deploy CloudFormation Template¶
Before you deploy the CloudFormation template, take note of the AWS Region in your SAP ECS account where the S3 Bucket and SQS Queue are located as you will need to deploy the CloudFormation template provided in that same region in your Secondary account.
What does the CloudFormation template do?
Creates the following resources:
- An IAM User - Default name is splunk_logserv_user
- An IAM Policy named splunk-logserv-ta-policy
- An IAM Role named splunk-logserv-ta-role
- An Inline IAM Policy on the IAM User to assume the IAM Role created above
- An SQS Queue - Default name is splunk-logserv-local-target-queue
- A Dead Letter SQS Queue - Default name is splunk-logserv-local-target-queue-dlq
- A Lambda Function - Default name is splunk-logserv-lambda-filter
- A LogGroup used by the Lambda Function
3.a Navigate to the CloudFormation console (ensure the region you are in matches the region in your SAP ECS account)
3.b Click on the Create stack button and select With new resources (standard)
Example
3.c Upload the AWS CloudFormation Template file provided for this remote S3 filter deployment approach, then click the Next button
Example

3.d Enter a name for the CloudFormation Stack - splunk-logserv-remote-s3-filter
Example

3.e Enter just the name (not the ARN) of the S3 Bucket in your SAP ECS account in the CrossAccountS3Bucket parameter - If your ARN looks like this arn:aws:s3:::sap-hec-clz-ap-south-1-hec53-xsd then just use the name like this ap-hec-clz-ap-south-1-hec53-xsd
Example

3.f Enter the complete ARN of the SQS Queue in your SAP ECS account in the CrossAccountSQSQueueArn parameter
Example

3.g Enter the number of days in the past to filter messages on. Messages older than this will be discarded.
Example

3.h Enter comma-separated patterns for paths to exclude (e.g., ‘linux/cron,*/messages’). Format: <clz_dir>/<clz_subdir>. Leave empty to exclude nothing.
Example

3.i Enter comma-separated patterns for paths to include (e.g., ‘hana/hanaaudit,linux/*,webdispatcher/accesslogs’). Format: <clz_dir>/<clz_subdir>. Use ‘*/*’ to include all paths.
Example

3.j Choose and enter a name for the S3 Bucket in your Secondary account that you used to upload the Lambda Function ZIP File in the LambdaCodeBucket parameter
Example

3.k Choose and enter a name for the Lambda Function to be created in your Secondary account in the LambdaFunctionName parameter
Example

3.l Choose and enter a name for the SQS Queue to be created in your Secondary account in the LocalSQSQueueName parameter
Example

3.m Choose and enter a name for the IAM User to be created in your Secondary account in the NewIAMUserName parameter, then click on the Next button
Example

3.n Scroll down to the bottom of the page and check the I acknowledge that AWS CloudFormation might create IAM resources with custom names checkbox, then click on the Next button
Example

3.o Scroll down to the bottom of the page and click on the Submit button
Example

3.p Ensure the deployment of the CloudFormation template completes successfully
Example
4. Contact SAP LogServ Support¶
Once the deployment of the CloudFormation templates completes successfully, you will need to provide SAP LogServ Support with the ARN of the IAM Role named splunk-logserv-ta-role that was created by the template.
The ARN for the IAM Role should look like the one below but with your 12-digit AWS account Id of your Secondary account.
arn:aws:iam::secondary-account-id:role/splunk-logserv-ta-role
Example access policies for the SQS Queue and S3 Bucket residing in your SAP ECS account are provided as a reference to provide clarity on the specific permissions that need to be applied by the SAP LogServ Support team.
5. Create Access Key for IAM User¶
5.a Navigate to the IAM console in your Secondary account and search for the IAM User name you used when deploying the CloudFormation template. Click on the name of the IAM User to see the user details.
Example
5.b Click on the Security credentials tab in the middle of the screen. Scroll down and click on the Create access key button.
Example
5.c Select the Local code use case, check the Confirmation checkbox and click on the Next button.
Example
5.d Enter a description tag value if desired and click on the Create access key button.
Example
5.e Copy the values for both the Access key and the Secret access key and save them in a secure place as you will need them in the upcoming steps. Now click on the Done button.
Example
6. Configure Secondary Account (AWS Add-on)¶
Please ensure the user you log in with in your Splunk instance has the appropriate permissions to perform all the steps outlined below.
6.a Login to your Splunk console then find and open the Splunk Add-on for AWS App
Example
6.b Click on the Configuration tab, then click on the Account tab, then click on the Add button
Example
6.c Choose and enter a descriptive name for the account in the Name field. Enter the Access Key and the Secret Key you created for the IAM User in the respective fields. Leave the Region Category set to Global. Click on the Add button.
Example
7. Configure IAM Role (AWS Add-on)¶
7.a Click on the IAM Role tab to the right of the Account tab, then click on the Add button
Example
7.b Choose and enter a descriptive name for the role in the Name field. Enter the IAM Role ARN in the IAM Role ARN field, then click the Add button. The ARN for the IAM Role should look like the one below but with your 12-digit AWS account Id of your Secondary account.
- arn:aws:iam::**_secondary-account-id_**:role/splunk-logserv-ta-role
Example
8. Configure SQS-Based S3 Input (AWS Add-on)¶
8.a Click on the Inputs tab. Click on the Create New Input button. Select the Custom Data Type option at the bottom of the drop-down, then select the SQS-Based S3 (Recommended) option.
Example
8.b Fill out the first three fields in the SQS-Based S3 Input (Name, AWS Account, Assume Role)
- Choose and enter a descriptive name for the input
- Select the AWS Account you configured previously
- Select the IAM Role you configured previously
Example
8.c Fill out the next three fields in the SQS-Based S3 Input (Force using DLQ, AWS Region, Use Private Endpoints)
- Leave the **_Force using DLQ (Recommended)_** checkbox **__checked__**
- Select the **_AWS Region_** where you deployed the CloudFormation template previously
- Leave the **_Use Private Endpoints_** checkbox **__unchecked__**
Example
8.d Fill out the next three fields in the SQS-Based S3 Input (SQS Queue Name, SQS Batch Size, S3 File Decoder)
- Select the **_SQS Queue Name_** you used in step **12** when previously deploying the CloudFormation template
- Leave the **_SQS Batch Size_** set to 10
- Leave the **_S3 File Decoder_** set to Custom Logs
Example

8.e Fill out the next three fields in the SQS-Based S3 Input (Signature Validate All Events, Source Type, Index)
- **__Uncheck__** the **_Signature Validate All Events_** checkbox
- Enter the value of **_sap_logserv_logs_** in the **_Source Type_** field
- Enter the name of the Splunk index you want to use in the **_Index_** field
- Click on the **_Add_** button
Example
9. Review SQS Queue Trigger¶
9.a Navigate to the Lambda console in your Secondary account and ensure the region you are in matches the region in your SAP ECS account. Find the Lambda function that was created by the CloudFormation template and click on its name to view details.
Example

9.b If you do not see an existing SQS Trigger in the Function overiew diagram as seen in the example image below, then follow the steps in the Create SQS Queue Trigger section below, otherwise follow the steps in the Configure SQS Queue Trigger section below.
Example

Create SQS Queue Trigger¶
- Click on the Add trigger button on the left side of the Function overview diagram to create a new SQS Queue Trigger
Example

- Click on the dropdown and select SQS as the trigger source
Example

-
Fill out the first three fields in the SQS Trigger (SQS queue ARN, Activate trigger, Enable metrics)
- Enter the complete ARN of the SQS Queue in your SAP ECS account
- Check the Activate trigger checkbox
- Check the Enable metrics checkbox
Example

-
Fill out the next three fields in the SQS Trigger (Batch size, Batch window, Maximum concurrency)
- Set the Batch Size to 10
- Set the Batch window to 5
- Set the Maximum concurrency to 8
Example

-
Fill out the last field in the SQS Trigger (Report batch item failures) and save the trigger
- Check the Report batch item failures checkbox
- Click on the Add button on the bottom right of the screen to save the trigger
Example

Configure SQS Queue Trigger¶
- Click on the SQS rectangle on the left side of the Function overview diagram to navigate to the SQS Queue Trigger configuration
Example

- Check the checkbox for the SQS trigger and then click on the Edit button
Example

-
Validate the first three fields in the SQS Trigger (SQS queue ARN, Activate trigger, Enable metrics)
- Ensure the complete ARN of the SQS Queue in your SAP ECS account is referenced here
- Ensure the Activate trigger checkbox is checked
- Ensure the Enable metrics checkbox is checked
Example

-
Validate the next three fields in the SQS Trigger (Batch size, Batch window, Maximum concurrency)
- Ensure the Batch Size is set to 10
- Ensure the Batch window is set to 5
- Ensure the Maximum concurrency is set to 8
Example

-
Validate the last field in the SQS Trigger (Report batch item failures) and save the trigger
- Ensure the Report batch item failures checkbox is checked
- Click on the Save button on the bottom right of the screen to save the trigger
Example

10. Confirm LogServ Logs are Being Ingested¶
After completing all the previous steps, verify that LogServ logs are successfully being ingested into Splunk.
The first events typically appear within 5-10 minutes of completing the SQS-Based S3 Input configuration. The filter Lambda function receives SQS notifications from the SAP ECS account, drops any that fail your include/exclude/days filters, and re-emits the rest to the local SQS Queue in your Secondary account. The Splunk SQS-Based S3 Input then polls the local SQS Queue at the configured interval (default 300 seconds), so allow a short lag before the first events arrive.
10.a Log in to your Splunk console and open the Search & Reporting app (or the SAP LogServ App if you have installed it)
10.b Run a basic search against the index you configured in the SQS-Based S3 Input to confirm events are flowing:
    index=<your_index_name> | stats count by sourcetype

If you are using the SAP LogServ App, you can use the provided index macro:

    `sap_logserv_idx_macro` | stats count by sourcetype
10.c You should see events from the LogServ sourcetypes that match your include pattern and are not blocked by your exclude / days-in-past filters. Depending on the log types enabled, expected sourcetypes may include (but are not limited to):
- `linux_messages_syslog`, `linux_secure`, `syslog` -- Linux OS events
- `isc:bind:query` -- DNS query events
- `squid:access` -- Proxy events
- `XmlWinEventLog` -- Windows events
- `sap:hana:audit`, `sap:hana:tracelogs` -- HANA database events
- `sap:abap:*` -- ABAP application events
- `sap:webdispatcher:access` -- Web Dispatcher events
- `sap:scc:audit`, `sap:scc:http_access` -- Cloud Connector events
10.d Confirm events are arriving with recent timestamps:
    index=<your_index_name> earliest=-1h | stats count by sourcetype, host

You should see recent events from multiple hosts.
10.e If no events appear after 15-20 minutes, troubleshoot as follows:
- **Filter dropped everything** -- Review the **DaysInPast**, **IncludeFilters**, and **ExcludeFilters** parameters you entered in Section 3. A narrow include pattern, a short `days_in_past` window, or an over-broad exclude pattern can legitimately drop every message before it reaches your local SQS Queue. Check the Lambda function's CloudWatch Logs for filter-decision messages and adjust the CloudFormation stack parameters if needed.
- **Lambda function errors** -- In the AWS Console, open CloudWatch Logs for the filter Lambda created by the CloudFormation template (Section 3). Look for cross-account access errors reading from the SAP ECS S3 Bucket or pushing to the local SQS Queue. Common causes are missing access policies on the SAP ECS resources (Section 4) or an IAM Role propagation delay (wait 5 minutes after initial setup).
- **Local SQS Queue has no messages** -- Verify the SAP LogServ Support team has applied the updated access policies (from Section 4) to the SQS Queue and S3 Bucket in your **_SAP ECS account_**. Without those policies, the filter Lambda cannot receive SQS notifications from the SAP ECS account or read from the SAP ECS S3 Bucket. Also verify the SQS Queue Trigger on the Lambda function is active (Section 9).
- **Authentication or permission errors** -- In the Splunk Add-on for AWS, check the logs for errors: run `index=_internal source=*aws* log_level IN (ERROR,WARN) earliest=-1h | head 50`. Common causes are a mis-copied Access Key/Secret Key (Section 5), an incorrect IAM Role ARN (Section 7), or the IAM Role not yet propagated through AWS (wait 5 minutes after initial setup).
- **SQS URL format** -- Double-check the **_SQS Queue Name_** field in the SQS-Based S3 Input (Section 8) points to the **_local_** SQS Queue that was created by the CloudFormation template in your **_Secondary account_** (not the SAP ECS SQS Queue).
- **Wrong AWS Region** -- The CloudFormation template (Section 3) and the SQS-Based S3 Input (Section 8) must both be in the same AWS Region as the SQS Queue and S3 Bucket in your **_SAP ECS account_**.
Where to go next
Once you’ve confirmed ingestion is working, explore the dashboards in the LogServ UI App to see your LogServ data in action. The default landing page is the Environment Health dashboard, which provides a cross-cutting view of your entire SAP landscape.
AWS Remote S3 Copy Setup Guide¶
Introduction¶
The deployment diagram below shows two different AWS accounts. For brevity and clarity, the AWS account at the top of the diagram will be referred to as the SAP ECS account and the second AWS account on the bottom left of the diagram will be referred to as the Secondary account from this point onward.
Ensure you have completed all of the steps in the Prerequisites and the Installation of the Splunk TA for SAP LogServ before you continue with the steps in this setup guide.
Your SAP ECS LogServ subscription for AWS (e.g. in your SAP ECS account) should have one S3 Bucket in that account where LogServ will store your LogServ logs. It should also have one SQS Queue in your SAP ECS account that receives notifications when new logs are added to the S3 Bucket in that account.
You will need obtain the AWS ARN for the SQS Queue and the S3 Bucket that resides in your SAP ECS account prior to performing the steps in this setup guide.
Take note of the AWS Region in your SAP ECS account where the S3 Bucket and SQS Queue are located as you will need to deploy the CloudFormation template provided in that same region in your Secondary account.
High Level Steps¶
Below are the high level steps for this setup process listed in the order they should be followed.
Please ensure the user you log in with in your AWS Secondary account has the appropriate permissions to perform all the steps outlined below.
- Obtain the ARNs for the SQS Queue and the S3 Bucket in your SAP ECS account
- Create a new S3 Bucket in the correct AWS Region in your Secondary account and upload the splunk-logserv-lambda-binary.zip file to the root of the bucket
- Deploy the AWS CloudFormation Template provided for this remote S3 connect deployment approach in your Secondary account
- Contact SAP LogServ support and request an update to the access policies for the SQS Queue and S3 Bucket residing in your SAP ECS account
- Create an Access Key for the new IAM User that was created with the CloudFormation template in your Secondary account
- Configure your AWS Secondary account in the Splunk Add-on for Amazon Web Services (AWS)
- Configure the new cross-account IAM Role from your AWS Secondary account in the Splunk Add-on for Amazon Web Services (AWS).
- Configure a new SQS-Based S3 Input in the Splunk Add-on for Amazon Web Services (AWS).
- Review the SQS Queue Trigger in the new Lambda function created with the CloudFormation template
- Confirm that LogServ logs are being ingested into Splunk
1. Obtain ARNs from SAP ECS Account¶
Before you can create the local S3 Bucket and deploy the CloudFormation template in your Secondary account, you need to obtain the AWS ARN for two resources that reside in your SAP ECS account:
- The S3 Bucket that stores your LogServ logs
- The SQS Queue that receives notifications when new logs are added to the S3 Bucket
You will also need to note the AWS Region where these resources are located, because the S3 Bucket and CloudFormation template in the next two sections must be created and deployed into that same region in your Secondary account.
What does an ARN look like?
AWS Amazon Resource Names (ARNs) follow a predictable format. Examples:
- S3 Bucket ARN:
arn:aws:s3:::sap-hec-clz-ap-south-1-hec53-xsd - SQS Queue ARN:
arn:aws:sqs:ap-south-1:121212121212:sap-hec-clz-ap-south-1-hec53-xsd-logserv
How to obtain the ARNs:
1.a If you do not have console access to your SAP ECS account, contact SAP LogServ Support to obtain the ARN for the S3 Bucket, the ARN for the SQS Queue, and the AWS Region where these resources reside.
1.b If you do have console access to your SAP ECS account, obtain the ARNs yourself:
- For the **S3 Bucket**: navigate to the S3 console, find the bucket used for LogServ logs, click on the bucket name, and copy the ARN from the **_Properties_** tab.
- For the **SQS Queue**: navigate to the SQS console, find the queue that receives S3 notifications, click on the queue name, and copy the ARN from the **_Details_** section.
1.c Save both ARNs and the AWS Region in a secure location – you will reference them when creating the S3 Bucket (next section), deploying the CloudFormation Template, and configuring the SQS-Based S3 Input later in this guide.
2. Create S3 Bucket with Lambda Function ZIP File¶
2.a Take note of the AWS Region in your SAP ECS account where the S3 Bucket and SQS Queue are located.
2.b Log into your AWS Secondary account and change to the region that matches the region in your SAP ECS account
2.c Choose a name for the new S3 bucket (splunk-logserv-lambda-binary is the default bucket name in the CloudFormation template used in the next section)
2.d Navigate to the S3 console and create a general purpose S3 bucket using all the default settings
2.e Upload the splunk-logserv-lambda-binary.zip file to the root of the S3 bucket
Example

3. Deploy CloudFormation Template¶
Before you deploy the CloudFormation template, take note of the AWS Region in your SAP ECS account where the S3 Bucket and SQS Queue are located as you will need to deploy the CloudFormation template provided in that same region in your Secondary account.
What does the CloudFormation template do?
Creates the following resources:
- An IAM User - Default name is splunk_logserv_user
- An IAM Policy named splunk-logserv-ta-policy
- An IAM Role named splunk-logserv-ta-role
- An Inline IAM Policy on the IAM User to assume the IAM Role created above
- An S3 Bucket with an Event Notification to the SQS Queue below- Default name is splunk-logserv-local-target-bucket
- An SQS Queue - Default name is splunk-logserv-local-target-queue
- A Dead Letter SQS Queue - Default name is splunk-logserv-local-target-queue-dlq
- A Lambda Function - Default name is splunk-logserv-lambda-logforwarder
- A LogGroup used by the Lambda Function
3.a Navigate to the CloudFormation console (ensure the region you are in matches the region in your SAP ECS account)
3.b Click on the Create stack button and select With new resources (standard)
Example
3.c Upload the AWS CloudFormation Template file provided for this remote S3 copy deployment approach, then click the Next button
Example

3.d Enter a name for the CloudFormation Stack - splunk-logserv-remote-s3-copy
Example

3.e Enter just the name (not the ARN) of the S3 Bucket in your SAP ECS account in the CrossAccountS3Bucket parameter - If your ARN looks like this arn:aws:s3:::sap-hec-clz-ap-south-1-hec53-xsd then just use the name like this ap-hec-clz-ap-south-1-hec53-xsd
Example

3.f Enter the complete ARN of the SQS Queue in your SAP ECS account in the CrossAccountSQSQueueArn parameter
Example

3.g Choose and enter a name for the S3 Bucket in your Secondary account that you used to upload the Lambda Function ZIP File in the LambdaCodeBucket parameter
Example

3.h Choose and enter a name for the Lambda Function to be created in your Secondary account in the LambdaFunctionName parameter
Example

3.i Choose and enter a name for the S3 Bucket to be created in your Secondary account in the LocalS3BucketName parameter
Example

3.j Choose and enter a name for the SQS Queue to be created in your Secondary account in the LocalSQSQueueName parameter
Example

3.k Choose and enter a name for the IAM User to be created in your Secondary account in the NewIAMUserName parameter, then click on the Next button
Example
3.l Scroll down to the bottom of the page and check the I acknowledge that AWS CloudFormation might create IAM resources with custom names checkbox, then click on the Next button
Example
3.m Scroll down to the bottom of the page and click on the Submit button
Example
3.n Ensure the deployment of the CloudFormation template completes successfully
Example
4. Contact SAP LogServ Support¶
Once the deployment of the CloudFormation templates completes successfully, you will need to provide SAP LogServ Support with the ARN of the IAM Role named splunk-logserv-ta-role that was created by the template.
The ARN for the IAM Role should look like the one below but with your 12-digit AWS account Id of your Secondary account.
arn:aws:iam::secondary-account-id:role/splunk-logserv-ta-role
Example access policies for the SQS Queue and S3 Bucket residing in your SAP ECS account are provided as a reference to provide clarity on the specific permissions that need to be applied by the SAP LogServ Support team.
5. Create Access Key for IAM User¶
5.a Navigate to the IAM console in your Secondary account and search for the IAM User name you used when deploying the CloudFormation template. Click on the name of the IAM User to see the user details.
Example
5.b Click on the Security credentials tab in the middle of the screen. Scroll down and click on the Create access key button.
Example
5.c Select the Local code use case, check the Confirmation checkbox and click on the Next button.
Example
5.d Enter a description tag value if desired and click on the Create access key button.
Example
5.e Copy the values for both the Access key and the Secret access key and save them in a secure place as you will need them in the upcoming steps. Now click on the Done button.
Example
6. Configure Secondary Account (AWS Add-on)¶
Please ensure the user you log in with in your Splunk instance has the appropriate permissions to perform all the steps outlined below.
6.a Login to your Splunk console then find and open the Splunk Add-on for AWS App
Example
6.b Click on the Configuration tab, then click on the Account tab, then click on the Add button
Example
6.c Choose and enter a descriptive name for the account in the Name field. Enter the Access Key and the Secret Key you created for the IAM User in the respective fields. Leave the Region Category set to Global. Click on the Add button.
Example
7. Configure IAM Role (AWS Add-on)¶
7.a Click on the IAM Role tab to the right of the Account tab, then click on the Add button
Example
7.b Choose and enter a descriptive name for the role in the Name field. Enter the IAM Role ARN in the IAM Role ARN field, then click the Add button. The ARN for the IAM Role should look like the one below but with your 12-digit AWS account Id of your Secondary account.
- arn:aws:iam::**_secondary-account-id_**:role/splunk-logserv-ta-role
Example
8. Configure SQS-Based S3 Input (AWS Add-on)¶
8.a Click on the Inputs tab. Click on the Create New Input button. Select the Custom Data Type option at the bottom of the drop-down, then select the SQS-Based S3 (Recommended) option.
Example
8.b Fill out the first three fields in the SQS-Based S3 Input (Name, AWS Account, Assume Role)
- Choose and enter a descriptive name for the input
- Select the AWS Account you configured previously
- Select the IAM Role you configured previously
Example
8.c Fill out the next three fields in the SQS-Based S3 Input (Force using DLQ, AWS Region, Use Private Endpoints)
- Leave the **_Force using DLQ (Recommended)_** checkbox **__checked__**
- Select the **_AWS Region_** where you deployed the CloudFormation template previously
- Leave the **_Use Private Endpoints_** checkbox **__unchecked__**
Example
8.d Fill out the next three fields in the SQS-Based S3 Input (SQS Queue Name, SQS Batch Size, S3 File Decoder)
- Select the **_SQS Queue Name_** you used in step **10** when previously deploying the CloudFormation template
- Leave the **_SQS Batch Size_** set to 10
- Leave the **_S3 File Decoder_** set to Custom Logs
Example
8.e Fill out the next three fields in the SQS-Based S3 Input (Signature Validate All Events, Source Type, Index)
- **__Uncheck__** the **_Signature Validate All Events_** checkbox
- Enter the value of **_sap_logserv_logs_** in the **_Source Type_** field
- Enter the name of the Splunk index you want to use in the **_Index_** field
- Click on the **_Add_** button
Example
9. Review SQS Queue Trigger¶
9.a Navigate to the Lambda console in your Secondary account and ensure the region you are in matches the region in your SAP ECS account. Find the Lambda function that was created by the CloudFormation template and click on its name to view details.
Example
9.b If you do not see an existing SQS Trigger in the Function overiew diagram as seen in the example image below, then follow the steps in the Create SQS Queue Trigger section below, otherwise follow the steps in the Configure SQS Queue Trigger section below.
Example
Create SQS Queue Trigger¶
- Click on the Add trigger button on the left side of the Function overview diagram to create a new SQS Queue Trigger
Example
- Click on the dropdown and select SQS as the trigger source
Example
-
Fill out the first three fields in the SQS Trigger (SQS queue ARN, Activate trigger, Enable metrics)
- Enter the complete ARN of the SQS Queue in your SAP ECS account
- Check the Activate trigger checkbox
- Check the Enable metrics checkbox
Example
-
Fill out the next three fields in the SQS Trigger (Batch size, Batch window, Maximum concurrency)
- Set the Batch Size to 10
- Set the Batch window to 5
- Set the Maximum concurrency to 8
Example
-
Fill out the last field in the SQS Trigger (Report batch item failures) and save the trigger
- Check the Report batch item failures checkbox
- Click on the Add button on the bottom right of the screen to save the trigger
Example
Configure SQS Queue Trigger¶
- Click on the SQS rectangle on the left side of the Function overview diagram to navigate to the SQS Queue Trigger configuration
Example
- Check the checkbox for the SQS trigger and then click on the Edit button
Example
-
Validate the first three fields in the SQS Trigger (SQS queue ARN, Activate trigger, Enable metrics)
- Ensure the complete ARN of the SQS Queue in your SAP ECS account is referenced here
- Ensure the Activate trigger checkbox is checked
- Ensure the Enable metrics checkbox is checked
Example
-
Validate the next three fields in the SQS Trigger (Batch size, Batch window, Maximum concurrency)
- Ensure the Batch Size is set to 10
- Ensure the Batch window is set to 5
- Ensure the Maximum concurrency is set to 8
Example
-
Validate the last field in the SQS Trigger (Report batch item failures) and save the trigger
- Ensure the Report batch item failures checkbox is checked
- Click on the Save button on the bottom right of the screen to save the trigger
Example
10. Confirm LogServ Logs are Being Ingested¶
After completing all the previous steps, verify that LogServ logs are successfully being ingested into Splunk.
The first events typically appear within 5-10 minutes of completing the SQS-Based S3 Input configuration. The Lambda function copies objects from the SAP ECS S3 Bucket to the local target S3 Bucket in your Secondary account when an SQS notification arrives, then the SQS-Based S3 Input polls the local SQS Queue at the configured interval (default 300 seconds), so allow a short lag before the first events arrive.
10.a Log in to your Splunk console and open the Search & Reporting app (or the SAP LogServ App if you have installed it)
10.b Run a basic search against the index you configured in the SQS-Based S3 Input to confirm events are flowing:
    index=<your_index_name> | stats count by sourcetype

If you are using the SAP LogServ App, you can use the provided index macro:

    `sap_logserv_idx_macro` | stats count by sourcetype
10.c You should see events from the LogServ sourcetypes your SAP LogServ subscription is forwarding. Depending on the log types enabled, expected sourcetypes may include (but are not limited to):
- `linux_messages_syslog`, `linux_secure`, `syslog` -- Linux OS events
- `isc:bind:query` -- DNS query events
- `squid:access` -- Proxy events
- `XmlWinEventLog` -- Windows events
- `sap:hana:audit`, `sap:hana:tracelogs` -- HANA database events
- `sap:abap:*` -- ABAP application events
- `sap:webdispatcher:access` -- Web Dispatcher events
- `sap:scc:audit`, `sap:scc:http_access` -- Cloud Connector events
10.d Confirm events are arriving with recent timestamps:
    index=<your_index_name> earliest=-1h | stats count by sourcetype, host

You should see recent events from multiple hosts.
10.e If no events appear after 15-20 minutes, troubleshoot as follows:
- **Lambda function errors** -- In the AWS Console, open CloudWatch Logs for the Lambda function created by the CloudFormation template (Section 3). Check for errors copying objects from the SAP ECS S3 Bucket to your local S3 Bucket. Common causes are missing access policies on the SAP ECS resources (Section 4) or an IAM Role propagation delay (wait 5 minutes after initial setup).
- **Local SQS Queue has no messages** -- Verify the SAP LogServ Support team has applied the updated access policies (from Section 4) to the SQS Queue and S3 Bucket in your **_SAP ECS account_**. Without those policies, the Lambda function cannot receive SQS notifications from the SAP ECS account or read from the SAP ECS S3 Bucket. Also verify the SQS Queue Trigger on the Lambda function is active (Section 9).
- **Authentication or permission errors** -- In the Splunk Add-on for AWS, check the logs for errors: run `index=_internal source=*aws* log_level IN (ERROR,WARN) earliest=-1h | head 50`. Common causes are a mis-copied Access Key/Secret Key (Section 5), an incorrect IAM Role ARN (Section 7), or the IAM Role not yet propagated through AWS (wait 5 minutes after initial setup).
- **SQS URL format** -- Double-check the **_SQS Queue Name_** field in the SQS-Based S3 Input (Section 8) points to the **_local_** SQS Queue that was created by the CloudFormation template in your **_Secondary account_** (not the SAP ECS SQS Queue).
- **Wrong AWS Region** -- The CloudFormation template (Section 3) and the SQS-Based S3 Input (Section 8) must both be in the same AWS Region as the SQS Queue and S3 Bucket in your **_SAP ECS account_**.
Where to go next
Once you’ve confirmed ingestion is working, explore the dashboards in the LogServ UI App to see your LogServ data in action. The default landing page is the Environment Health dashboard, which provides a cross-cutting view of your entire SAP landscape.
Ended: AWS Setup Guides
AWS Migrations Guide ↵
AWS Remote S3 Connect to Filter Migration Guide¶
Introduction¶
This guide walks you through migrating from an existing splunk-logserv-remote-s3-connect deployment to the splunk-logserv-remote-s3-filter deployment without deleting or recreating your existing IAM User and IAM Role resources.
The migration adds Lambda-based S3 event filtering capabilities to your existing deployment, allowing you to filter S3 event notifications based on time and path patterns before they are processed by Splunk.
Also available: Native TA Index-Time Filtering
Starting with version 0.0.3, the TA also includes built-in index-time filtering that works inside Splunk itself. This can be used alongside or instead of Lambda-based filtering. After completing this migration (or with any deployment scenario), see Configuring Filters or the section at the bottom of this page.
This migration guide assumes you have already completed the AWS Remote S3 Connect Setup and have a working deployment in your Secondary account.
What the Migration Does¶
The Python migration script performs the following actions on your existing deployment:
Migration Actions
Updates to Existing Resources:
- Updates the existing IAM Role trust policy to allow Lambda service
- Attaches the AWSLambdaBasicExecutionRole managed policy to the existing IAM Role
- Adds CloudWatch Logs permissions to the existing IAM policy
- Adds local SQS queue permissions to the existing IAM policy
New Resources Created:
- An SQS Queue - Default name is splunk-logserv-local-target-queue
- A Dead Letter SQS Queue - Default name is splunk-logserv-local-target-queue-dlq
- A Lambda Function - Default name is splunk-logserv-lambda-filter
- A CloudWatch LogGroup used by the Lambda Function
- An Event Source Mapping connecting the Lambda to the cross-account SQS Queue
Architecture After Migration¶
After migration, the architecture will match the splunk-logserv-remote-s3-filter deployment:
- S3 event notifications from the SAP ECS account are received by the Lambda function
- The Lambda function filters events based on time (days in past) and path patterns (include/exclude)
- Matching events are forwarded to a local SQS queue in your Secondary account
- Splunk polls the local SQS queue for filtered notifications
Prerequisites¶
Before starting the migration, ensure you have the following:
Existing Deployment:
- A working splunk-logserv-remote-s3-connect deployment in your Secondary account
- The ARN and name of the existing IAM Role (e.g.,
splunk-logserv-ta-role) - The ARN of the existing IAM User (e.g.,
arn:aws:iam::123456789012:user/splunk_logserv_user) - The name of the existing IAM policy attached to the role (e.g.,
splunk-logserv-ta-policy)
Cross-Account Information:
- The ARN of the SQS Queue in your SAP ECS account
- The name of the S3 Bucket in your SAP ECS account
Local Environment:
- Python 3.9 or higher installed
- boto3 library installed
- AWS CLI configured with appropriate credentials/profile
High Level Steps¶
Below are the high level steps for the migration process listed in the order they should be followed.
Please ensure the user you log in with in your AWS Secondary account has the appropriate permissions to perform all the steps outlined below.
- Install Python and boto3 dependencies (if not already installed)
- Create a new S3 Bucket in your Secondary account and upload the Lambda function ZIP file
- Download the migration scripts and configuration file
- Configure the migration configuration file with your deployment details
- Run the migration script in dry-run mode, then execute it to perform the migration
- Update the Splunk AWS Add-on SQS-Based S3 Input to use the new local queue
- Verify the migration is successful
1. Install Python and boto3¶
The migration scripts require Python 3.9 or higher and the boto3 library.
Check Python Version¶
Open a command prompt or terminal and run the following command to check your Python version:
python --version
If Python is not installed or the version is below 3.9, download and install Python from the official Python website.
On Windows, ensure you check the Add Python to PATH option during installation.
Check boto3 Installation¶
Run the following command to check if boto3 is installed:
pip show boto3
If boto3 is installed, you will see version and location information. If not installed, you will see a warning message.
Install boto3¶
If boto3 is not installed, run the following command to install it:
pip install boto3
2. Create S3 Bucket with Lambda Function ZIP File¶
2.a Take note of the AWS Region in your SAP ECS account where the S3 Bucket and SQS Queue are located.
2.b Log into your AWS Secondary account and change to the region that matches the region in your SAP ECS account
2.c Choose a name for the new S3 bucket (splunk-logserv-lambda-binary is the default bucket name in the migration configuration file)
2.d Navigate to the S3 console and create a general purpose S3 bucket using all the default settings
2.e Upload the splunk-logserv-filter-lambda.zip file to the root of the S3 bucket
3. Download Migration Scripts¶
Download the following files from the GitHub repository to a local directory on your machine:
| File | Description |
|---|---|
| migrate-config.json | Configuration file with all migration parameters |
| migrate-to-filter.py | Python script that performs the migration |
| migrate-to-filter-rollback.py | Python script that rolls back the migration |
4. Configure Migration Settings¶
Open the migrate-config.json file in a text editor and update the values to match your deployment.
Existing Resources Configuration¶
Update the existing_resources section with the details from your current splunk-logserv-remote-s3-connect deployment:
"existing_resources": {
    "iam_user_arn": "arn:aws:iam::YOUR_ACCOUNT_ID:user/YOUR_IAM_USER_NAME",
    "iam_role_name": "YOUR_IAM_ROLE_NAME",
    "iam_role_arn": "arn:aws:iam::YOUR_ACCOUNT_ID:role/YOUR_IAM_ROLE_NAME",
    "iam_role_policy_name": "YOUR_IAM_POLICY_NAME"
}
| Parameter | Description | Example |
|---|---|---|
| iam_user_arn | ARN of the existing IAM User | arn:aws:iam::112543817624:user/splunk_logserv_user |
| iam_role_name | Name of the existing IAM Role | splunk-logserv-ta-role |
| iam_role_arn | ARN of the existing IAM Role | arn:aws:iam::112543817624:role/splunk-logserv-ta-role |
| iam_role_policy_name | Name of the existing inline policy on the IAM Role | splunk-logserv-ta-policy |
Cross-Account Configuration¶
Update the cross_account section with the details from your SAP ECS account:
"cross_account": {
    "sqs_queue_arn": "arn:aws:sqs:REGION:SAP_ACCOUNT_ID:QUEUE_NAME",
    "s3_bucket_name": "SAP_S3_BUCKET_NAME"
}
| Parameter | Description | Example |
|---|---|---|
| sqs_queue_arn | ARN of the SQS Queue in your SAP ECS account | arn:aws:sqs:ap-south-1:395719258032:sap-logserv-queue |
| s3_bucket_name | Name of the S3 Bucket in your SAP ECS account | sap-logserv-bucket |
Local SQS Configuration¶
Update the local_sqs section to configure the local SQS queue that will receive filtered notifications:
"local_sqs": {
    "queue_name": "splunk-logserv-local-target-queue",
    "visibility_timeout_seconds": 600,
    "message_retention_seconds": 1209600,
    "dlq_max_receive_count": 3
}
| Parameter | Description | Default |
|---|---|---|
| queue_name | Name for the local SQS queue | splunk-logserv-local-target-queue |
| visibility_timeout_seconds | Visibility timeout in seconds | 600 (10 minutes) |
| message_retention_seconds | Message retention period in seconds | 1209600 (14 days) |
| dlq_max_receive_count | Max receives before sending to DLQ | 3 |
Lambda Function Configuration¶
Update the lambda_function section to configure the Lambda filter function:
"lambda_function": {
    "function_name": "splunk-logserv-lambda-filter",
    "code_s3_bucket": "splunk-logserv-lambda-binary",
    "code_s3_key": "splunk-logserv-filter-lambda.zip",
    "handler": "log-filterer-lambda.lambda_handler",
    "runtime": "python3.12",
    "timeout_seconds": 300,
    "memory_size_mb": 512
}
| Parameter | Description | Default |
|---|---|---|
| function_name | Name for the Lambda function | splunk-logserv-lambda-filter |
| code_s3_bucket | S3 bucket containing the Lambda ZIP file | splunk-logserv-lambda-binary |
| code_s3_key | S3 key (path) to the Lambda ZIP file | splunk-logserv-filter-lambda.zip |
| handler | Lambda handler function | log-filterer-lambda.lambda_handler |
| runtime | Lambda runtime | python3.12 |
| timeout_seconds | Lambda timeout in seconds | 300 (5 minutes) |
| memory_size_mb | Lambda memory allocation in MB | 512 |
Filter Settings Configuration¶
Update the filter_settings section to configure the S3 event filtering behavior:
"filter_settings": {
    "days_in_the_past": 7,
    "include_filters": "linux/*,hana/*",
    "exclude_filters": "linux/cron,linux/messages,linux/localmessages,linux/slapd,linux/sudolog,linux/warn"
}
| Parameter | Description | Default |
|---|---|---|
| days_in_the_past | Filter out messages older than this many days | 7 |
| include_filters | Comma-separated fnmatch patterns for paths to include | linux/*,hana/* |
| exclude_filters | Comma-separated fnmatch patterns for paths to exclude | linux/cron,linux/messages,... |
Use */* for include_filters to include all paths. Leave exclude_filters empty to exclude nothing.
Event Source Mapping Configuration¶
Update the event_source_mapping section to configure the Lambda trigger:
"event_source_mapping": {
    "batch_size": 10,
    "maximum_batching_window_seconds": 5,
    "maximum_concurrency": 10
}
| Parameter | Description | Default |
|---|---|---|
| batch_size | Number of messages per Lambda invocation | 10 |
| maximum_batching_window_seconds | Max time to wait for a full batch | 5 |
| maximum_concurrency | Max concurrent Lambda executions | 10 |
5. Run Migration Script¶
Command Line Arguments¶
The migration script supports the following command line arguments:
| Argument | Short | Required | Description |
|---|---|---|---|
--config |
-c |
Yes | Path to the migration configuration JSON file |
--region |
-r |
Yes | AWS region (must match your existing deployment region) |
--profile |
-p |
No | AWS CLI profile name (uses default credentials if not specified) |
--dry-run |
-d |
No | Preview changes without making any modifications |
Dry Run Mode¶
Always run the migration script in dry-run mode first to preview the changes that will be made.
Windows Command Prompt:
python migrate-to-filter.py --config migrate-config.json --region us-east-1 --dry-run
Windows Command Prompt with AWS Profile:
python migrate-to-filter.py --config migrate-config.json --region us-east-1 --profile my-aws-profile --dry-run
Linux/macOS Terminal:
python3 migrate-to-filter.py --config migrate-config.json --region us-east-1 --dry-run
Linux/macOS Terminal with AWS Profile:
python3 migrate-to-filter.py --config migrate-config.json --region us-east-1 --profile my-aws-profile --dry-run
Review the dry-run output to ensure all steps are correct and the existing resources are found.
Execute Migration¶
Once you have verified the dry-run output, run the migration script without the --dry-run flag:
Windows Command Prompt:
python migrate-to-filter.py --config migrate-config.json --region us-east-1
Windows Command Prompt with AWS Profile:
python migrate-to-filter.py --config migrate-config.json --region us-east-1 --profile my-aws-profile
Linux/macOS Terminal:
python3 migrate-to-filter.py --config migrate-config.json --region us-east-1
Linux/macOS Terminal with AWS Profile:
python3 migrate-to-filter.py --config migrate-config.json --region us-east-1 --profile my-aws-profile
The script will display progress for each step and provide a summary upon completion, including the new local SQS queue URL that you will need for the next step.
6. Update Splunk AWS Add-on Configuration¶
After the migration completes successfully, you need to update your existing SQS-Based S3 Input in the Splunk Add-on for AWS to use the new local SQS queue.
6.a Log into your Splunk instance and open the Splunk Add-on for AWS
6.b Navigate to Inputs and find your existing SQS-Based S3 Input
6.c Click Edit on the input
6.d Update the SQS Queue Name field to use the new local queue URL from the migration output
- Example: https://sqs.ap-south-1.amazonaws.com/112543817624/splunk-logserv-local-target-queue
6.e Click Save to apply the changes
The input will restart and begin polling the new local filtered queue.
7. Verify Migration¶
After completing the migration and updating the Splunk configuration:
7.a Check Lambda Logs - Navigate to CloudWatch Logs in the AWS Console and verify the Lambda function is receiving and processing messages
7.b Check Local SQS Queue - Navigate to SQS in the AWS Console and verify messages are appearing in the local queue
7.c Check Splunk - Run a search for recent LogServ logs to confirm data is being ingested:
index=your_index sourcetype=sap_logserv_logs earliest=-1h
Rollback Migration¶
If you need to rollback the migration and return to the original splunk-logserv-remote-s3-connect configuration, use the rollback script.
Rollback Command Line Arguments¶
The rollback script supports the same command line arguments as the migration script:
| Argument | Short | Required | Description |
|---|---|---|---|
--config |
-c |
Yes | Path to the migration configuration JSON file |
--region |
-r |
Yes | AWS region |
--profile |
-p |
No | AWS CLI profile name (uses default credentials if not specified) |
--dry-run |
-d |
No | Preview changes without making any modifications |
Rollback Dry Run¶
Always run the rollback script in dry-run mode first to preview what will be removed.
Windows Command Prompt:
python migrate-to-filter-rollback.py --config migrate-config.json --region us-east-1 --dry-run
Windows Command Prompt with AWS Profile:
python migrate-to-filter-rollback.py --config migrate-config.json --region us-east-1 --profile my-aws-profile --dry-run
Linux/macOS Terminal:
python3 migrate-to-filter-rollback.py --config migrate-config.json --region us-east-1 --dry-run
Linux/macOS Terminal with AWS Profile:
python3 migrate-to-filter-rollback.py --config migrate-config.json --region us-east-1 --profile my-aws-profile --dry-run
Execute Rollback¶
Once you have verified the dry-run output, run the rollback script without the --dry-run flag:
Windows Command Prompt:
python migrate-to-filter-rollback.py --config migrate-config.json --region us-east-1
Windows Command Prompt with AWS Profile:
python migrate-to-filter-rollback.py --config migrate-config.json --region us-east-1 --profile my-aws-profile
Linux/macOS Terminal:
python3 migrate-to-filter-rollback.py --config migrate-config.json --region us-east-1
Linux/macOS Terminal with AWS Profile:
python3 migrate-to-filter-rollback.py --config migrate-config.json --region us-east-1 --profile my-aws-profile
What does the rollback script do?
Removes Created Resources:
- Deletes the Event Source Mapping
- Deletes the Lambda function
- Deletes the CloudWatch Log Group
- Deletes the local SQS queue and Dead Letter Queue
Reverts IAM Changes:
- Removes local SQS permissions from the existing IAM policy
- Removes CloudWatch Logs permissions from the existing IAM policy
- Detaches the AWSLambdaBasicExecutionRole managed policy
- Reverts the IAM Role trust policy to remove Lambda service
After rollback, update your Splunk AWS Add-on SQS-Based S3 Input to use the original cross-account SQS queue URL from your SAP ECS account.
Troubleshooting¶
Lambda Not Receiving Messages¶
- Verify the Event Source Mapping is enabled in the Lambda console
- Verify cross-account permissions are correctly configured for your IAM Role
- Check the IAM Role trust policy includes
lambda.amazonaws.com
Lambda Errors in CloudWatch¶
- Check for “Access Denied” errors which indicate IAM permission issues
- Verify the Lambda code ZIP file was uploaded correctly to S3
- Check the handler name in the configuration matches the Lambda code
Messages Not Appearing in Local Queue¶
- Review the Lambda CloudWatch logs for filtering decisions
- Verify the include_filters patterns match your expected paths
- Check the days_in_the_past setting is not filtering out your messages
Splunk Not Ingesting¶
- Verify the local SQS queue URL is correctly configured in the Splunk input
- Check the Splunk AWS Add-on internal logs for connection errors
- Verify messages are present in the local SQS queue
Configure Native TA Index-Time Filtering¶
Introduction¶
Starting with version 0.0.3, the Splunk TA for SAP LogServ includes built-in index-time filtering that works inside Splunk itself, independently of the Lambda-based S3 event filtering configured above. You can use both approaches together for defense-in-depth filtering, or use the native TA filtering on its own.
Native TA Filtering vs. Lambda-based Filtering
- Lambda-based filtering (configured above) filters S3 event notifications before they reach Splunk, reducing the number of SQS messages processed by the Splunk AWS Add-on.
- Native TA filtering (configured below) filters events inside Splunk at index time via TRANSFORMS-based queue routing. Filtered events never consume Splunk license.
Both use the same clz_dir/clz_subdir pattern syntax. Using both together means events are filtered at the AWS level first and then again at the Splunk level, providing a safety net if either filter configuration is incomplete.
Open the Filters Tab¶
- In Splunk Web, open the Splunk TA for SAP LogServ app
- Go to Configuration → Filters
Set Your Filter Options¶
Enable Filtering¶
Check the Enable Filtering checkbox to activate index-time filtering.
Include Filters¶
Comma-separated patterns specifying which log types to include. Patterns use the format clz_dir/clz_subdir with fnmatch-style wildcards:
| Pattern | Meaning |
|---|---|
*/* |
Include all log types (default) |
hana/hanaaudit |
Include only HANA audit logs |
linux/* |
Include all Linux log types |
linux/messages, hana/* |
Include Linux messages and all HANA logs |
This field cannot be empty when filtering is enabled. Use */* to include everything.
Exclude Filters¶
Comma-separated patterns for log types to exclude. Events matching any exclude pattern are dropped even if they also match an include pattern. Leave empty to exclude nothing.
Days in the Past¶
Whole number (0–3650) specifying the maximum age of events to index. Set to 0 to disable time-based filtering. Default: 7.
Save¶
Click Save. The TA validates your patterns and generates the necessary configuration files.
Deployment Server: Deploy to Forwarders¶
If you are running on a Deployment Server with Heavy Forwarders, additional steps are required after saving filters.
After saving, the Filters tab will display a “⚠ Deployment Server Detected” banner with a “Deploy to Forwarders” button.
Configure the Server Class (First Time Only)¶
- Go to Settings → Forwarder Management
- Find the
SAP_LogServ_HeavyForwardersserver class - Click the three-dot menu → Edit agent assignment
- Add your Heavy Forwarder IP addresses or hostnames
- Save the agent assignment
Deploy¶
- Return to the Filters tab and click “Deploy to Forwarders”
- Confirm the deployment
- Wait for HFs to phone home (typically 30–60 seconds)
- Verify deployment status in Settings → Forwarder Management
Verify Native Filtering¶
After deployment, verify that native filtering is operating correctly:
`sap_logserv_idx_macro` | stats count by clz_dir, clz_subdir
You should see data only for log types matching your include patterns. See Configuring Filters for the full verification and troubleshooting guide.
Ended: AWS Migrations Guide
SAP LogServ on Azure — Setup Guide¶
This page covers ingesting LogServ data from Microsoft Azure Blob Storage using the standalone Splunk TA for SAP LogServ on Azure add-on (splunk_ta_sap_logserv_azure) and its sap_logserv_azure_queue modular input — the Azure twin of Splunk_TA_aws’s SQS-Based S3 input. An Azure Event Grid subscription drops a BlobCreated notification onto a Storage Queue; this input consumes the queue, fetches each named blob over a SAS, and emits its NDJSON. This is the model SAP’s LogServ-on-Azure collector uses (Storage Queue notifications). You install this small, first-party add-on on each Heavy Forwarder — the same deployment model as the Splunk Add-on for AWS — and the LogServ Data TA on the same HF provides the downstream sourcetype routing, filtering, and stamping. The downstream pipeline (sourcetype routing, filtering, dashboards, ES integration) is identical to the AWS S3 path.
The Azure infrastructure is provided by SAP — you only install the add-on and configure the input
In a RISE / SAP ECS deployment the storage account, blob container, Storage Queue, Event Grid subscription, and SAS are all provisioned and managed by SAP in the SAP ECS Azure account. You do not create or configure anything in Azure. Your only tasks are to install the splunk_ta_sap_logserv_azure add-on on each Heavy Forwarder and create a Splunk input on it — one per Azure landscape (most deployments have a single landscape, hence one input; you can define several on the same HF if you ingest from more than one — see Multiple landscapes / fleets), using a small set of parameter values that you obtain from your SAP support contact — see Parameters to obtain from SAP.
Current release: LLM functionality intentionally disabled pending review
The current release ships with the AI Assistant’s LLM-driven path disabled at compile time pending internal review. The setup procedure on this page applies in full regardless. See Templates-only Build Flag.
Architecture overview¶
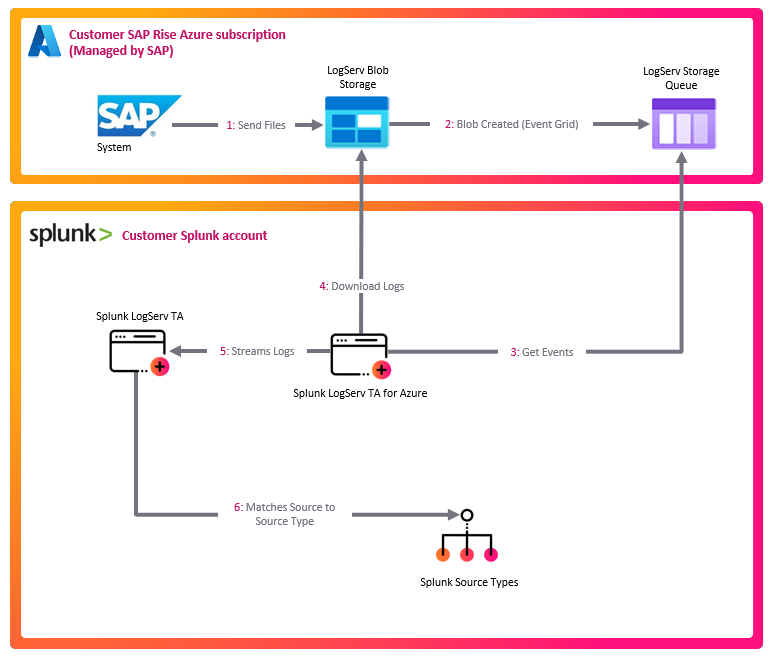
SAP LogServ RISE-ECS
  └─> writes NDJSON.gz blobs to Azure Blob Storage under the logserv/ prefix
        └─> Azure Event Grid subscription (Microsoft.Storage.BlobCreated)
              └─> Azure Storage Queue (one message per new blob)
                    └─> [Azure TA: sap_logserv_azure_queue]  (runs on the Heavy Forwarder)
                          ├─ reads the queue, fetches each blob over a SAS, gunzips, splits NDJSON
                          └─> emits via EventWriter, sourcetype=sap_logserv_logs
                                └─> [LogServ Data TA pipeline]  (same Heavy Forwarder):
                                      transforms.conf routes by clz_dir/clz_subdir,
                                      Configuration -> Filters nullQueue, _time drop,
                                      splunk_solution / cloud_provider stamping
                                        └─> forwarded to the Indexer
                                              └─> dashboards + ES integration
Everything from the LogServ blob writer down through the Storage Queue lives in the SAP ECS Azure account and is managed by SAP. The Azure TA’s sap_logserv_azure_queue input — the only component you install and configure — runs on your Heavy Forwarder, consumes the queue SAP exposes to you, and hands its events to the LogServ Data TA (also on that HF) for routing/filtering/stamping. This is exactly how Splunk_TA_aws and the Data TA cooperate for the AWS S3 path.
Why EventWriter, not HEC: the input runs on the Heavy Forwarder and emits through the HF’s native index-time pipeline, so every existing LogServ Data TA feature — clz_dir/clz_subdir sourcetype routing, the Configuration → Filters nullQueue filtering, the days_in_past / _time drop, and the splunk_solution / cloud_provider stamping — applies to Azure events unchanged, exactly as it does to AWS S3 events. The input is stdlib-only (Azure Storage REST over urllib — no Azure SDK), so it adds no AArch64 / native-binary burden and is Splunk Cloud-clean.
Prerequisites¶
Provided by SAP (in the SAP ECS Azure account — you obtain the values, you do not build the resources):
- An Azure Storage Account holding the LogServ container (blobs under the
logserv/prefix — same path convention as AWS S3:<container>/logserv/<clz_dir>/<clz_subdir>/<YYYY>/<MM>/<DD>/<file>.json.gz). - A Storage Queue in that account, fed by an Event Grid subscription that routes
Microsoft.Storage.BlobCreatedevents to it. - A SAS that is both blob-readable and queue-processable (see What the SAP-provided SAS must cover).
Obtain the storage account name, the queue name, and the SAS from your SAP support contact — see Parameters to obtain from SAP.
On your side (each Heavy Forwarder that will ingest Azure data):
- LogServ Data TA
0.0.6+ installed on the Heavy Forwarder (it provides the index-time routing/filtering/stamping; see Installing the Data TA). The Data TA is normally distributed by the Deployment Server. - Splunk TA for SAP LogServ on Azure (
splunk_ta_sap_logserv_azure)0.0.6+ installed on the same Heavy Forwarder (see Install the Azure add-on). It registers thesap_logserv_azure_queueinput kind. The input is inert until you create an input instance. - Network egress from the Heavy Forwarder to
<account>.blob.core.windows.netand<account>.queue.core.windows.net(port 443 / HTTPS).
Compact JSON format required
Each blob is gzipped NDJSON (one event per line). The index-time routing transforms assume compact JSON (no whitespace after :). The SAP LogServ collector emits compact JSON natively, so no action is required on your side. (For reference: pretty-printed JSON would bypass the transforms and land as sourcetype=sap_logserv_logs, breaking dashboards.)
Parameters to obtain from SAP¶
You do not create any Azure resources. SAP has already provisioned the storage account, container, queue, and Event Grid subscription in the SAP ECS Azure account. Contact your SAP support contact to obtain the following values for your environment, then plug them into the Splunk input (Configure the input):
| Parameter | Input field | Description |
|---|---|---|
| Storage account name | account_name |
The Azure Storage account holding the LogServ container (^[a-z0-9]{3,24}$). |
| Storage Queue name | queue_name |
The queue receiving the Event Grid BlobCreated notifications. |
| SAS token | sas_token |
An account SAS scoped for both blob read/list and queue process/delete (see below). Treat it as a secret. |
The blob container name and logserv/ prefix are already covered by the SAS and the queue — they are not separate input fields. The account name also determines the two endpoints your Heavy Forwarder must reach (<account>.blob.core.windows.net and <account>.queue.core.windows.net).
What the SAP-provided SAS must cover¶
The input fetches blobs and reads/deletes queue messages with the single SAS SAP gives you, so that SAS must cover both services. Confirm with your SAP support contact that the SAS includes:
| SAS field | Must include | For |
|---|---|---|
ss (services) |
b (blob) and q (queue) |
blob fetch + queue ops |
srt (resource types) |
s c o (service/container/object) |
account-SAS resource scope |
sp (permissions) |
r l (blob read/list) and p d/u (queue process/delete/update) |
fetch blobs + consume queue |
You can decode a SAS string to check its scope before configuring the input:
echo "$SAS" | tr '&' '\n' | grep -E '^(ss|srt|sp|se)='
If the SAS is queue-only
If ss lacks b, blob fetches fail with HTTP 401/403 and the input logs it explicitly: “blob read forbidden … the SAS likely lacks Blob-read permission or has expired.” The decisive question for your SAP support contact is “is the LogServ SAS Blob-readable, or queue-only?” If it is queue-only, you will need a second, blob-read credential from SAP.
Install the Azure add-on¶
Install splunk_ta_sap_logserv_azure-0.0.6.tar.gz directly on each Heavy Forwarder that will ingest Azure data — exactly the tier where Splunk_TA_aws is installed for the AWS path.
- Splunk Web → Manage Apps → Install app from file → upload the tarball, or
/opt/splunk/bin/splunk install app /path/splunk_ta_sap_logserv_azure-0.0.6.tar.gz, or- configuration management (Ansible / Puppet / Chef) drops the app into
etc/apps/, thenchown -R splunk:splunkand restart.
Do NOT distribute the Azure add-on via the Deployment Server
Install it directly on each Heavy Forwarder — never as a deployment-app. The input’s SAS is stored, encrypted, in the add-on’s own local/passwords.conf; a Deployment Server push replaces the app’s local/ directory, which would wipe the per-HF SAS. (This is the same reason Splunk_TA_aws is configured per-HF rather than DS-distributed. It is a deliberate change from earlier LogServ builds that bundled this input inside the DS-managed Data TA.) The Data TA stays DS-managed as before — only the Azure add-on is per-HF.
After installing + restarting, the sap_logserv_azure_queue input kind is registered and the add-on’s Inputs page is available under Apps → Splunk TA for SAP LogServ on Azure.
Configure the input¶
On each Heavy Forwarder, create one input instance for your Azure landscape. The SAS is encrypted into the add-on’s own local/passwords.conf and is not Deployment-Server-managed — it survives restarts and Data-TA pushes with no system/local relocation.
Via Splunk Web (per Heavy Forwarder)¶
Splunk Web → Apps → Splunk TA for SAP LogServ on Azure → Inputs → Create New Input → Azure Storage Queue, and fill in the fields below with the values you obtained from SAP. (For a second landscape on the same HF, use the Inputs table’s Clone action and give it a new name — the SAS is not carried on clone, so re-enter it.)
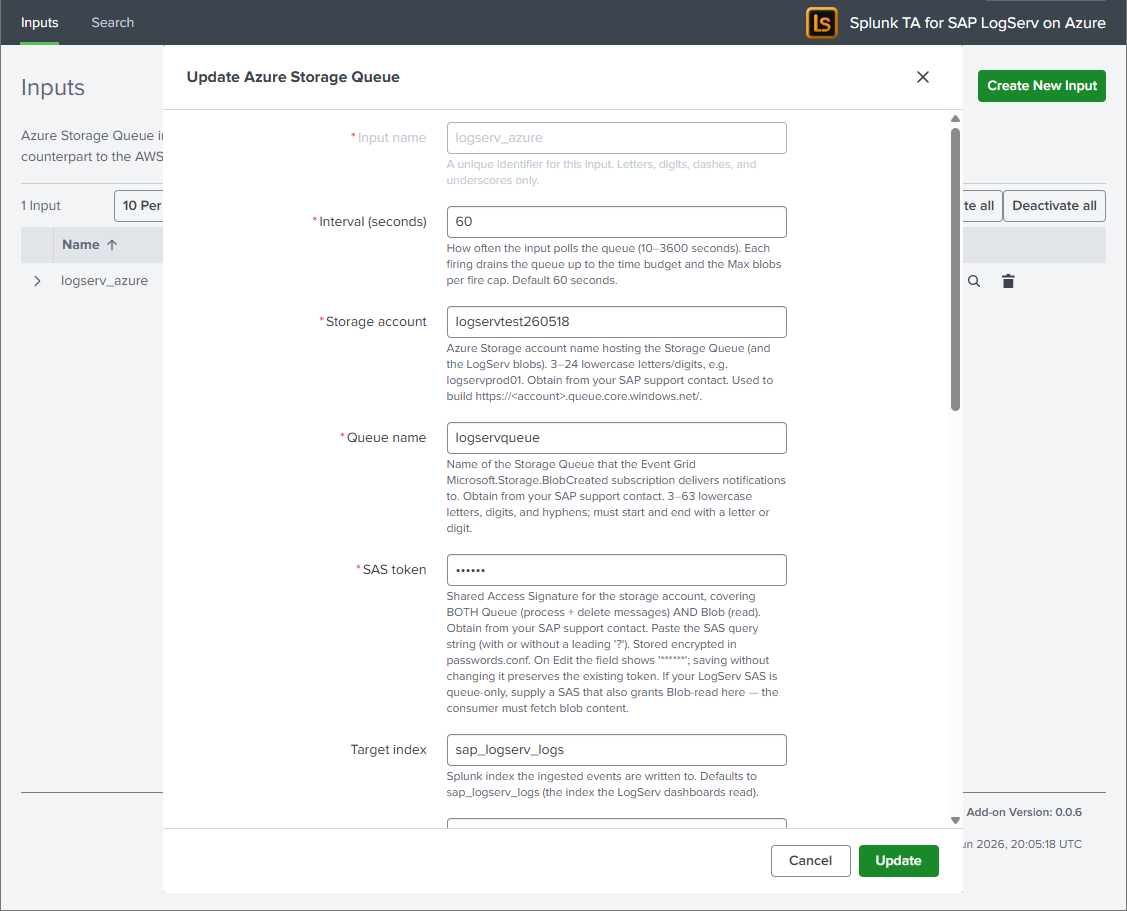
Via REST (scriptable, per Heavy Forwarder)¶
# Write the SAS to a single-line temp file (no trailing newline), then create the input:
curl -sk -u admin:<pwd> -X POST \
  https://localhost:8089/servicesNS/nobody/splunk_ta_sap_logserv_azure/splunk_ta_sap_logserv_azure_sap_logserv_azure_queue \
  --data-urlencode name=logserv_azure \
  --data-urlencode account_name=<storage-account> \
  --data-urlencode queue_name=logservqueue \
  --data-urlencode index=sap_logserv_logs \
  --data-urlencode event_sourcetype=sap_logserv_logs \
  --data-urlencode interval=60 \
  --data-urlencode sas_token@/tmp/azure_sas.txt
rm -f /tmp/azure_sas.txt
The resulting stanza in the add-on’s local/inputs.conf looks like:
[sap_logserv_azure_queue://logserv_azure]
account_name = <storage-account>
queue_name = logservqueue
index = sap_logserv_logs
event_sourcetype = sap_logserv_logs
interval = 60
disabled = 0
(The sas_token is not written to inputs.conf — it is stored encrypted in the add-on’s own local/passwords.conf.)
| Field | Default | Notes |
|---|---|---|
account_name |
— | Storage account name from SAP (^[a-z0-9]{3,24}$). |
queue_name |
— | The Storage Queue name from SAP (receives Event Grid notifications). |
sas_token |
— | The SAS from SAP (blob + queue scoped). Encrypted credential, stored in the add-on’s local/passwords.conf, never in inputs.conf. |
index |
sap_logserv_logs |
Target index. Does not affect parsing — the Data TA’s index-time pipeline keys on the sourcetype, not the index. You may point it at a custom index, but the dashboards query through the sap_logserv_idx_macro macro, so update that macro to match (see caveat below). |
event_sourcetype (UI label Sourcetype) |
sap_logserv_logs |
Fixed at sap_logserv_logs. The add-on hard-codes this sourcetype (it is not read from the stanza), and the field is shown read-only when editing the input. Leave it at the default. |
interval |
60 |
Seconds between firings. Each firing drains the queue within a time budget (min(240, interval×0.9)). |
batch_size |
32 |
Queue messages dequeued per request (1–32, the Azure max). |
visibility_timeout |
300 |
Seconds a dequeued message is hidden while processing (30–604800). |
max_blobs_per_fire |
500 |
Cap on blobs ingested per firing (backlog safety valve). |
poison_threshold |
5 |
A message redelivered more than this many times is dead-lettered / dropped. |
dead_letter_queue |
(empty) | Optional queue name for poison messages (Storage Queue has no native DLQ). |
include_filters / exclude_filters |
(empty) | Optional substring filters on the blob subject (beyond the built-in logserv match). |
verify_ssl |
1 |
TLS verification for Azure REST calls. |
Sourcetype is fixed; the Index is yours to change
The Sourcetype is effectively fixed at sap_logserv_logs — the add-on always emits it (the value is hard-coded in the input, not read from the stanza), and the field is shown read-only (disabled) when editing an existing input. This is deliberate: the Data TA’s index-time routing, Filters nullQueue, _time drop, and splunk_solution / cloud_provider stamping all key on sourcetype = sap_logserv_logs (props.conf stanzas match on sourcetype, not index), so it must never vary.
The index, by contrast, may be changed safely — parsing is unaffected (events are routed, filtered, and stamped identically no matter which index they land in). You may point it at a custom index (for example a per-customer index such as sap_logserv_logs_con01). The only follow-up is dashboard visibility: the dashboards and rollups search through the sap_logserv_idx_macro macro (default index="sap_logserv_logs"), so override that macro in the App’s local/macros.conf to match your index, or the dashboards won’t find the data.
cloud_provider attribution¶
The input stamps every event it emits with the indexed field cloud_provider=azure (via _meta = cloud_provider::azure on the generated stanza), so search-time queries and the Multi-Cloud Overview dashboard can distinguish Azure-sourced from AWS-sourced data.
On a Heavy Forwarder that ingests BOTH AWS and Azure
The Data TA’s Configuration → Cloud Provider dropdown stamps cloud_provider TA-wide at index time. If it is set to aws on a forwarder that also runs this Azure input, that index-time stamp co-fires with the input’s per-event _meta=azure, leaving cloud_provider multivalued (azure + aws) on the Azure events. For correct per-channel attribution on a mixed forwarder, set the Cloud Provider dropdown to “Not set” and add _meta = cloud_provider::aws to the Splunk_TA_aws SQS-S3 input — then each input self-attributes. On a single-cloud forwarder, the dropdown alone is simplest. See Configuring Filters → Cloud Provider Attribution.
Multiple landscapes / fleets¶
- Multiple Azure landscapes on one HF: create one input instance per landscape (different
account_name/queue_name), using the Inputs table’s Clone action. The per-instance credential is keyed by the input name; re-enter the SAS on each (clone never carries secrets). - A fleet of Heavy Forwarders: repeat the install + input creation on each HF. For zero-touch fleets, config management can drop the add-on into
etc/apps/and seed the SAS via the REST call above (it encrypts under each HF’s ownsplunk.secret). Do not add the add-on to the Deployment Server’sdeployment-apps/.
Scaling one queue by cloning — supported (like the AWS add-on), but at-least-once
Separate input instances are normally for different queues (different queue_name). You can also point several identical inputs at the same queue to raise throughput — this is the same competing-consumer pattern Splunk’s AWS add-on uses to scale its SQS-Based S3 input: the queue’s visibility lease hands each message to one consumer at a time, so N inputs fetch and ingest N batches of blobs in parallel (across one HF, since the input is not single-instance, or across several HFs). Understand the trade-off first:
- A single input is exactly-once even under redelivery — its per-input dedup checkpoint (
<input_name>.dedup.json) skips an already-ingested blob if a message reappears. - Cloned same-queue inputs don’t share that checkpoint, so they fall back to at-least-once (the same guarantee as the AWS SQS-S3 input). If a blob’s fetch + ingest exceeds the message’s
visibility_timeout(default 300 s), the message reappears and another input re-ingests it → duplicate events. The guard is identical to the AWS pattern: setvisibility_timeoutcomfortably above your worst-case per-message processing time. (dequeue_countis the queue’s server-side, shared counter, so thepoison_thresholddecision stays coordinated across the clones — but unlike SQS, Azure Storage Queue has no native dead-letter/redrive, so poison handling is the TA’s client-sidepoison_threshold+ optionaldead_letter_queue.)
For typical LogServ volumes a single input already keeps up (it drains up to max_blobs_per_fire blobs per firing). Prefer raising batch_size / max_blobs_per_fire or lowering interval on one input before cloning; clone same-queue inputs only when one input genuinely can’t keep up, and raise visibility_timeout when you do.
Reliability behavior¶
- At-least-once + dedup. A queue message is deleted only after its blob ingests successfully; each blob is deduplicated by
url|etagin a checkpoint sidecar, so a redelivered message re-ingests nothing. - Transient failures leave the message. A 5xx / network error on a blob fetch leaves the message on the queue (it redelivers after the visibility timeout); already-ingested blobs in that message are no-ops on retry.
- Blob-read denied (401/403) leaves the message and logs loudly — this is the queue-only-SAS signal (get a blob-readable credential from SAP, the message reprocesses).
- Poison messages (redelivered more than
poison_thresholdtimes) are moved todead_letter_queueif configured, else dropped, so one permanently-bad blob can’t loop forever.
Historical backfill¶
Queue-driven ingest is forward-only by nature — Event Grid fires only on new BlobCreated events, so once SAP’s subscription is live the input ingests everything written from that point on, but does not replay blobs that already existed. There is no queue-native historical backfill yet; a one-time bulk load of pre-existing blobs is a roadmap item. If you need to seed history, contact your Splunk team. The index-time days_in_past / _time filter applies to any backfilled events the same way it does to live ingest.
Validation¶
Confirm the input is registered and firing (run on the Heavy Forwarder):
curl -sk -u admin:<pwd> \
  "https://localhost:8089/servicesNS/nobody/splunk_ta_sap_logserv_azure/splunk_ta_sap_logserv_azure_sap_logserv_azure_queue?output_mode=json"
Watch the input log on the HF:
sudo tail -f /opt/splunk/var/log/splunk/splunk_ta_sap_logserv_azure_queue.log
# look for:  Input 'logserv_azure' done: messages=N blobs=N events=N dups=N deleted=N ...
Search the indexer (events route to per-source sourcetypes just like AWS):
index=sap_logserv_logs cloud_provider=azure _index_earliest=-1h | stats count by sourcetype
Troubleshooting¶
| Symptom (in the input log) | Cause | Fix |
|---|---|---|
SAS token not found in passwords.conf; skipping |
No credential for this input name on this host | Re-enter the SAS on this HF (Inputs tab → Edit, or the REST call above). The SAS lives in the add-on’s own local/passwords.conf; it is not affected by Deployment-Server pushes. |
queue read failed (... 403 ...) |
SAS lacks queue process/delete, or expired | Ask SAP for a SAS with sp ⊇ p/d and a future se=. |
blob read forbidden (HTTP 401/403) |
SAS is queue-only (no blob read) or expired | Ask SAP for a blob-readable SAS (ss ⊇ b, sp ⊇ r); the message is left for retry. |
done: messages=0 every firing, but blobs exist |
The Event Grid subscription (SAP-managed) isn’t enqueuing, or the queue name is wrong | Confirm with your SAP support contact that the Event Grid subscription is active and the queue name is correct; verify network egress to <account>.queue.core.windows.net. |
Input kind sap_logserv_azure_queue not listed / Inputs page missing |
The Azure add-on isn’t installed (or Splunkd wasn’t restarted) on this HF | Install splunk_ta_sap_logserv_azure on the HF and restart (see Install the Azure add-on). |
Next steps¶
- Confirm the LogServ App is installed on your Search Head
- Review the supported log types reference
- For Splunk Cloud Victoria considerations, see Splunk Cloud Victoria Notes
Ended: LogServ Data TA
LogServ UI App ↵
LogServ App Prerequisites¶
This page covers the prerequisites for the LogServ App (splunk_app_sap_logserv) — the React-based UI App that ships dashboards + the AI Assistant chat panel. For the Data TA’s prerequisites (CIM add-ons), see Data TA Prerequisites. The SAP data + AI Assistant audit indexes are auto-created by the Data TA on a single-instance deployment, or created on the indexer tier for distributed / indexer-cluster / Splunk Cloud deployments — see Create the indexes.
Splunk Platform Requirements¶
- Splunk Enterprise 9.4.3 or later, or Splunk Cloud Platform
- The LogServ App ships as a single React bundle and uses
@splunk/react-ui+@splunk/visualizations+@xyflow/react. Splunk 9.4.3+ is the minimum for the React component versions used.
AI Assistant Prerequisites¶
The LogServ App includes a built-in AI Assistant chat panel that dispatches predefined prompts (saved searches) against your data via the Splunk MCP Server. To use the AI Assistant — even with the LLM-driven path disabled in the current release — install:
- Splunk MCP Server (Splunkbase App 7931) v1.1.0 or later
Install on the same Search Head as the LogServ App. Cookie auth from the same Splunk Web session works by default; no bearer token required for HTTP-only Splunk. See Splunk MCP Setup for full configuration.
Recommended companion app¶
The Splunk AI Assistant is not a strict prerequisite for the LogServ App’s AI Assistant — the LogServ App uses only the core splunk_run_saved_search and splunk_run_query MCP tools, which work standalone against the Splunk MCP Server. However, App 200 is the typical co-install for the Splunk MCP Server and unlocks additional saia_*-prefixed MCP tools (e.g., SPL optimization helpers) that may be used in future LogServ releases. If you’re already deploying the Splunk MCP Server, installing App 200 alongside it follows Splunk’s documented setup pattern and avoids friction if a future LogServ release calls those tools.
Current release: AI provider credentials are NOT required
The current release ships with the LLM-driven path disabled at compile time pending internal review. The predefined-prompt path (which dispatches saved searches via the Splunk MCP Server) is the only AI Assistant path active in the current release, and it does NOT call any LLM provider. You do not need to configure an Anthropic / OpenAI / Azure / Bedrock credential to use the AI Assistant in the current release. When the LLM-driven path is re-enabled in a future release, the Settings → Provider Credentials tab will become visible and one provider credential will be required for the free-form chat input. See Templates-only Build.
Next Steps¶
Installing the LogServ App¶
This page covers installing the LogServ App (splunk_app_sap_logserv). For the Data TA installation, see Installing the Data TA.
Current release: AI Assistant LLM functionality intentionally disabled pending review
The current release of the LogServ App ships with the AI Assistant’s LLM-driven path disabled at compile time pending internal review. The published tarball is the templates-only build variant — there is no separate “regular” build. The predefined-prompt path + Splunk MCP Server integration + tool tiles + drill-down chips + audit log + 21 dashboards + the Environment Topology view are all fully active. The free-form chat input, the model picker, the Power Mode toggle, and the Provider Credentials Settings tab are all hidden. See Templates-only Build for the build mechanism.
About the LogServ App¶
The LogServ App provides:
- 21 React-based dashboards plus the Environment Topology view, organized as one top-level Environment Health landing page + four purpose-driven groups (Applications, Integration, Security, Platform). Built on
@splunk/react-ui+@splunk/visualizations+@xyflow/react. See Dashboards Overview. - Built-in AI Assistant chat panel — predefined prompts + Splunk MCP integration + audit log. (LLM-driven path disabled in the current release; canned-prompt path active.) See AI Assistant Overview.
- Search-time field extractions for all SAP-specific sourcetypes (~176 directives across EXTRACT, EVAL, FIELDALIAS).
- The
sap_logserv_idx_macromacro for searching the LogServ index. - Built-in Download PNG button on every dashboard for
html2canvas-based full-canvas image export. - Per-dashboard auto-refresh picker (Never / 30s / 1m / 5m / 15m / 30m / 1hr) with per-user-per-dashboard cadence persisted via Splunk KV Store.
The LogServ App contains no Python code, no REST handlers, and no data collection components. It is a React-based app focused entirely on the search-time experience and AI Assistant chat surface.
High Level Steps¶
Below are the high level steps for installing the LogServ App. Follow them in order.
Steps 4 and 5 are alternative paths — complete the one that matches your Splunk environment.
- Identify where to install the LogServ App based on your topology
- Install the Splunk MCP Server prerequisite (for AI Assistant)
- Download the LogServ App
- Install the LogServ App in Splunk Cloud (if applicable)
- Install the LogServ App in Splunk Enterprise (if applicable)
- Verify the installation
- Update the index macro (if using a custom index name)
1. Where to install¶
| Your Topology | Install the LogServ App On |
|---|---|
| Single instance | The single Splunk instance (alongside the Data TA) |
| Distributed with on-prem SH | The Search Head only |
| Distributed with Splunk Cloud | The Splunk Cloud Search Head only |
Important
- The LogServ App is never installed on Heavy Forwarders or the Deployment Server.
- For single-instance deployments, install both the Data TA and the LogServ App on the same instance. Splunk merges their configurations at runtime.
2. Install the Splunk MCP Server prerequisite¶
The AI Assistant requires the Splunk MCP Server (Splunkbase App 7931) v1.1.0 or later, installed on the same Search Head as the LogServ App. Install it via Splunk Web (Apps → Install app from file) or via CLI:
/opt/splunk/bin/splunk install app /path/to/splunk-mcp-server.tar.gz
After install, restart Splunkd. Cookie auth from the same Splunk Web session works by default; no bearer token configuration required for HTTP-only Splunk. See Splunk MCP Setup for full configuration including the optional bearer token for OAuth-strict environments.
Current release: no AI provider credentials needed
Even with the LLM-driven path disabled, the AI Assistant’s predefined-prompt path requires the Splunk MCP Server to dispatch saved searches. Install the MCP Server. Do not configure any AI provider credential (Anthropic / OpenAI / Azure / Bedrock) — they are not used in the current release and their Settings tab is hidden.
3. Download the LogServ App¶
Download splunk_app_sap_logserv-0.0.6.0.tar.gz from the GitHub repository.
The published tarball is the templates-only build variant (LLM-driven path disabled at compile time pending review). There is no separate “regular” tarball published in the current release.
4. Install in Splunk Cloud¶
Install the LogServ App to your Splunk Cloud Search Head:
Note
The app installation workflow available to you in Splunk Web depends on your Splunk Cloud Platform Experience: Victoria or Classic. To find your Splunk Cloud Platform Experience, in Splunk Web, click Support & Services > About.
Classic Experience¶
Victoria Experience¶
5. Install in Splunk Enterprise¶
Install the LogServ App to your Splunk Enterprise Search Head:
5.a From the Splunk Web home screen, click the gear icon next to Apps.
5.b Click Install app from file.
5.c Locate the downloaded splunk_app_sap_logserv-0.0.6.0.tar.gz file and click Upload.
5.d If Splunk Enterprise prompts you to restart, do so.
5.e Verify that the app appears in the list of apps. You can also find it on the server at $SPLUNK_HOME/etc/apps/splunk_app_sap_logserv.
6. Verify installation¶
After installation, navigate to the LogServ App in Splunk Web. You should see the navigation bar with:
- Environment Health (default landing page — cross-cutting operations view)
- Topology (graph-based Environment Topology view)
- Applications dropdown (5 dashboards: ABAP Network & Security, ABAP Operations, Work Process Performance, HANA Audit, HANA Trace)
- Integration dropdown (5 dashboards: SAP Services, SAP Router, Cloud Connector, Web Dispatcher, Web and API Performance)
- Security dropdown (3 dashboards: Network Perimeter, Cross-Stack Authentication, Change & Configuration Activity)
- Platform dropdown (6 dashboards: Data Pipeline Overview, DNS Analytics, Linux, Windows, Proxy, Host Details)
✦ AI Assistantbutton in the top-right of the nav bar (clicking it opens the chat panel)
If the dashboards show no data, verify that:
6.a The Data TA is installed and collecting data on your Heavy Forwarders (or single instance)
6.b The sap_logserv_idx_macro resolves to the correct index name
6.c Events exist in the index: run `sap_logserv_idx_macro` | stats count by sourcetype in the Search app
6.d If the AI Assistant button shows a setup wizard instead of an empty chat panel, the Splunk MCP Server prerequisite isn’t healthy — re-check the install in Step 2.
7. Update the index macro¶
If you used a custom index name (not sap_logserv_logs), update the macro:
7.a In Splunk Web, go to Settings > Advanced search > Search macros
7.b Set the app context to Splunk App for SAP LogServ
7.c Find sap_logserv_idx_macro and update its definition to index=<your_index_name>
High-volume installs: seed dashboard history
The dashboards read from an hourly KV-Store rollup layer for performance. On a large environment, run the one-time backfill so dashboards show history immediately: open Settings → Dashboard Data and click Run backfill. Without it, rolled-up panels fill in one hour at a time from the next hourly aggregation. See Dashboard Performance & Data Freshness.
Next Steps¶
- Explore the Dashboards Overview to learn about the available dashboards
- Read AI Assistant Overview to understand the chat panel + predefined-prompt path
- If you haven’t yet, complete the AWS Setup Guide to configure data collection
Dashboard Performance & Data Freshness¶
The LogServ App dashboards are designed to stay fast on large environments. This page explains how each dashboard panel sources its data, what “data freshness” means per panel, and the one-time step an admin runs after installing on a high-volume instance.
How the dashboards source their data¶
Every panel reads from the cheapest correct data source for what it shows. There are two fast tiers plus a small set of panels that stay on raw events.
| Tier | Used for | Freshness | Cost |
|---|---|---|---|
tstats on indexed fields |
Pure counts and averages over indexed dimensions (event volumes, host / sourcetype / cloud-provider breakdowns) | Real-time | Very low — reads the index’s tsidx, no raw-event scan |
| KV-Store precompute rollups | Most charts, tables, and KPIs across the dashboard suite | Hourly (most-recently-completed hour) | Near-zero at read time — a scheduled search precomputes the data once per hour |
| Raw events | Per-event listings, streamstats periodicity (beaconing), and a few timing traces that cannot be rolled up | Real-time | Bounded with \| head N where the panel is a time-ordered listing |
No CIM data-model acceleration is required
The dashboards do not depend on accelerating the Common Information Model (CIM) Web / Authentication / Network data models. The fast path is the app’s own KV-Store rollups, which work regardless of whether you have accelerated any CIM model. (The app’s CIM tagging for Splunk Enterprise Security correlation is a separate, independent feature — see Enterprise Security → CIM Compliance.)
The KV-Store rollup layer¶
Behind the rolled-up panels are 24 KV-Store rollup collections (logserv_*_rollup). For each, a scheduled saved search (logserv_*_aggregate, cron 5 * * * * — five minutes past every hour) aggregates the previous hour’s raw events into hour-bucketed rows. The dashboard reads the collection back, filtered to the global time-range picker’s window via a bucket_ts range. Because the heavy aggregation happens once per hour in the background, opening a dashboard re-reads precomputed rows in roughly 0.1–0.6 seconds instead of dispatching a full raw scan.
A daily retention search trims each collection to a rolling 365-day window.
Scheduled-search schedule¶
The app’s scheduled searches are organized into three non-overlapping bands so that no two enabled scheduled searches ever fire in the same minute and the hourly aggregation never contends with the daily retention. This keeps the scheduler from bursting at high event volume.
| Band | When | What runs |
|---|---|---|
| Hourly aggregates | :03–:28 every hour, one per minute |
The 26 always-on rollup-aggregate searches (logserv_*_aggregate) |
| Daily retention + beaconing | :30–:58 (hours 00 and 01), two minutes apart |
The 26 retention trims + the 2 daily beaconing aggregates |
| Enterprise Security | :00–:02, :29, odd :31–:59 |
The 22 splunk_sap_logserv_es_* searches (enabled by default) — see note below |
The per-search tables below give each search’s run time as typical / busy — the average and worst single-run duration observed on the validation fleet (~10.7M events/day). Aggregate run times scale with the per-hour event volume; retention run times scale with the collection size. Every search completes well within its one-minute slot.
Hourly aggregate band (:03–:28)¶
Each rollup aggregate dispatches the just-completed hour (-1h@h..@h), so the firing minute is freshness-neutral — spreading them one-per-minute simply avoids a burst at :05. Peak concurrency is ~1–2 instead of 26.
| Fires | Aggregate search | Powers (dashboard) | Run time (typ. / busy) |
|---|---|---|---|
:03 |
logserv_stmap_aggregate |
Host Details · Sourcetype Mapping + Data Pipeline Overview · Linked Graph | 1 / 2 s |
:04 |
logserv_hostrole_aggregate |
Host Details · Role Activity | 4 / 5 s |
:05 |
logserv_topology_aggregate_nodes |
Environment Topology (graph) | 6 / 20 s |
:06 |
logserv_topology_aggregate_edges |
Environment Topology (graph) | 3 / 12 s |
:07 |
logserv_topology_aggregate_inventory |
Environment Topology (graph) | 3 / 13 s |
:08 |
logserv_topology_detail_aggregate |
Environment Topology (detail tabs) | 13 / 35 s |
:09 |
logserv_wp_perf_aggregate |
Work Process Performance | 5 / 16 s |
:10 |
logserv_severity_aggregate |
Environment Health | 5 / 18 s |
:11 |
logserv_hana_aggregate |
HANA Audit | 3 / 12 s |
:12 |
logserv_compliance_aggregate |
Change & Configuration Activity | 3 / 15 s |
:13 |
logserv_saprouter_aggregate |
SAP Router | 2 / 7 s |
:14 |
logserv_abapnet_aggregate |
ABAP Network & Security | 6 / 21 s |
:15 |
logserv_xstack_auth_aggregate |
Cross-Stack Authentication | 3 / 10 s |
:16 |
logserv_perimeter_aggregate |
Network Perimeter | 6 / 22 s |
:17 |
logserv_linux_aggregate |
Linux System & Security | 7 / 24 s |
:18 |
logserv_web_timing_aggregate |
Web & API Performance | 8 / 21 s |
:19 |
logserv_hana_trace_aggregate |
HANA Trace | 2 / 6 s |
:20 |
logserv_windows_aggregate |
Windows | 2 / 6 s |
:21 |
logserv_sapservices_aggregate |
SAP Services | 2 / 6 s |
:22 |
logserv_mc_aggregate |
Multi-Cloud Overview | 2 / 7 s |
:23 |
logserv_cloudconn_aggregate |
Cloud Connector | 4 / 10 s |
:24 |
logserv_proxy_aggregate |
Proxy | 4 / 12 s |
:25 |
logserv_dns_aggregate |
DNS Analytics | 2 / 5 s |
:26 |
logserv_pipeline_aggregate |
Data Pipeline Overview | 2 / 5 s |
:27 |
logserv_hostdetails_aggregate |
Host Details (Overview tab) | 2 / 7 s |
:28 |
logserv_webdisp_slowtrace_aggregate |
Web Dispatcher · Slowest Request Traces | 1 / 3 s |
Daily band (:30–:58)¶
Retention trims and the two daily beaconing aggregates run in the off-peak :30–:58 window — 15 searches at 00:30–00:58, the remaining 13 at 01:30–01:54, all two minutes apart. Keeping them at minute :30+ guarantees they never collide with the hourly aggregate band (which fires at :03–:28 of every hour). Each retention search trims its collection to the rolling 365-day window; the two beaconing aggregates (00:30, 00:32) precompute the per-day DNS/perimeter beaconing statistics. (Retention run times scale with collection size, so the larger rollups — Environment Topology detail, Host Role Activity, DNS, Web & API, Network Perimeter — take longest; all are off-peak and collision-free.)
| Fires | Daily search | Action (dashboard) | Run time (typ. / busy) |
|---|---|---|---|
00:30 |
logserv_beaconing_aggregate |
Aggregate daily beaconing counts → Environment Health · DNS Analytics | 2 / 4 s |
00:32 |
logserv_beaconing_detail_aggregate |
Aggregate daily beaconing gap-stats → DNS Analytics · Network Perimeter | 1 / 2 s |
00:34 |
logserv_topology_retention |
Trim Environment Topology (graph) | 7 / 10 s |
00:36 |
logserv_wp_perf_retention |
Trim Work Process Performance | 10 / 14 s |
00:38 |
logserv_severity_retention |
Trim Environment Health | 7 / 8 s |
00:40 |
logserv_hana_retention |
Trim HANA Audit | 5 / 7 s |
00:42 |
logserv_compliance_retention |
Trim Change & Configuration Activity | 2 / 2 s |
00:44 |
logserv_saprouter_retention |
Trim SAP Router | 2 / 2 s |
00:46 |
logserv_abapnet_retention |
Trim ABAP Network & Security | 4 / 5 s |
00:48 |
logserv_xstack_auth_retention |
Trim Cross-Stack Authentication | 3 / 3 s |
00:50 |
logserv_perimeter_retention |
Trim Network Perimeter | 28 / 31 s |
00:52 |
logserv_linux_retention |
Trim Linux System & Security | 7 / 8 s |
00:54 |
logserv_web_timing_retention |
Trim Web & API Performance | 25 / 36 s |
00:56 |
logserv_hana_trace_retention |
Trim HANA Trace | 5 / 7 s |
00:58 |
logserv_windows_retention |
Trim Windows | 4 / 5 s |
01:30 |
logserv_sapservices_retention |
Trim SAP Services | 1 / 2 s |
01:32 |
logserv_mc_retention |
Trim Multi-Cloud Overview | 13 / 15 s |
01:34 |
logserv_beaconing_retention |
Trim beaconing counts | < 1 s |
01:36 |
logserv_cloudconn_retention |
Trim Cloud Connector | 4 / 4 s |
01:38 |
logserv_proxy_retention |
Trim Proxy | 4 / 5 s |
01:40 |
logserv_dns_retention |
Trim DNS Analytics | 35 / 38 s |
01:42 |
logserv_pipeline_retention |
Trim Data Pipeline Overview | 5 / 6 s |
01:44 |
logserv_hostdetails_retention |
Trim Host Details | 8 / 8 s |
01:46 |
logserv_webdisp_slowtrace_retention |
Trim Web Dispatcher · Slowest Traces | 2 / 2 s |
01:48 |
logserv_beaconing_detail_retention |
Trim beaconing gap-stats | 1 / 1 s |
01:50 |
logserv_topology_detail_retention |
Trim Environment Topology (detail tabs) | 63 / 69 s |
01:52 |
logserv_stmap_retention |
Trim Sourcetype Mapping | 24 / 24 s |
01:54 |
logserv_hostrole_retention |
Trim Host Role Activity | 38 / 38 s |
Enterprise Security band (enabled by default)¶
The 22 splunk_sap_logserv_es_* searches ship enabled (see Enterprise Security → The ES schedule) on crons that sit entirely in the minutes the always-on bands leave free — :00–:02, :29, and the odd minutes :31–:59 — so they are collision-free with both the aggregate band (:03–:28) and the daily retention band (:30–:58, hours 00–01). 16 correlation searches run hourly, the 2 Asset/Identity feeds every 4 hours, and the 4 behavioral-anomaly searches once daily at :02 (hours 02–05). The three heavy 30-day anomaly scans therefore run once a day rather than every hour.
Measured behavior¶
On the validation fleet (335M events), the hourly aggregates each complete in seconds and the slowest daily retention trim is ~1 minute (see the per-search tables above); the scheduler logs 0 skipped / 0 deferred. The two heaviest ES searches — the 30-day anomaly scans (~150–340 s and ~50–120 s) — now run once a day rather than every hour, so they no longer add per-hour load.
Behavior with multiple search heads¶
How these scheduled searches behave depends on the search-head topology:
Search Head Cluster (SHC) — the supported multi-SH topology. Works cleanly, with no extra configuration:
- The SHC captain delegates each scheduled search to a single member per fire, so every aggregate and retention search runs once cluster-wide per interval — not once per member. There is no multiplication of load by the number of search heads.
- KV Store is automatically replicated across the cluster. Whichever member runs an aggregate writes the rollup to its local KV Store, and Splunk replicates the collection to every member — so all search heads serve the dashboards from the same rolled-up data, regardless of which member computed it. (The rollup design depends on KV Store, which is cluster-replicated by default.)
- The app’s saved searches and collection definitions deploy to all members via the SHC deployer (
splunk apply shcluster-bundle), Splunk’s standard process. The one-click Settings → Dashboard Data → Run backfill also works cluster-wide — an admin runs it from any member and the results replicate. - The one-search-per-minute staggering helps here too: it keeps the per-minute scheduled load at ~1, which the captain can place on any member without bunching.
Independent (non-clustered) search heads. If the app is installed on two or more standalone search heads that are not in a SHC, each one runs its own copy of the schedule against its own KV Store (there is no replication between independent search heads). The aggregates therefore run N times — once per search head — which is redundant indexer load, and each search head maintains its rollups independently (they can drift slightly in timing). It is not broken — each search head’s dashboards work off its own rollups — but it is wasteful. Recommendation: use a SHC for multi-SH deployments; if independent search heads are unavoidable, enable the scheduled searches on only one of them.
Single search head (the default — one SH, with or without separate indexers): the search head runs the whole schedule itself, dispatching the raw scans to its indexer peers and writing the rollups to its own KV Store. Nothing special is required.
KV Store must be enabled and healthy
The rollups live in Splunk’s KV Store, so KV Store must be enabled on the search head(s) — it is by default, and is already required for the Environment Topology view and the AI Assistant settings. On a SHC, KV Store replication must be healthy for rollups computed on one member to appear on the others.
What “data freshness” means per panel¶
tstatsand raw panels are real-time — they reflect events the instant they are indexed.- Rolled-up panels are accurate to the most-recently-completed hour. The hourly aggregation runs at five minutes past each hour, so within the current partial hour a rolled-up panel shows data through the last completed hour, not the live partial hour.
Investigating live, sub-hour activity
For minute-level investigation, use a panel’s Open in Search toolbar action (see below) to jump into Splunk’s Search app with the panel’s SPL and your selected time range pre-applied — that runs against raw events in real time. The rolled-up dashboard panels are tuned for trend and volume analysis over the hourly grain, not live tailing.
The Dashboard Data settings tab¶
The Dashboard Data tab on the Application Settings page (Settings → Dashboard Data, admin-only) is the single control surface for this entire KV-Store rollup layer — for every dashboard and the Environment Topology view. It exposes the hourly-aggregation master switch, the retention window, the one-time backfill, a per-rollup status + action table, and a global clear.
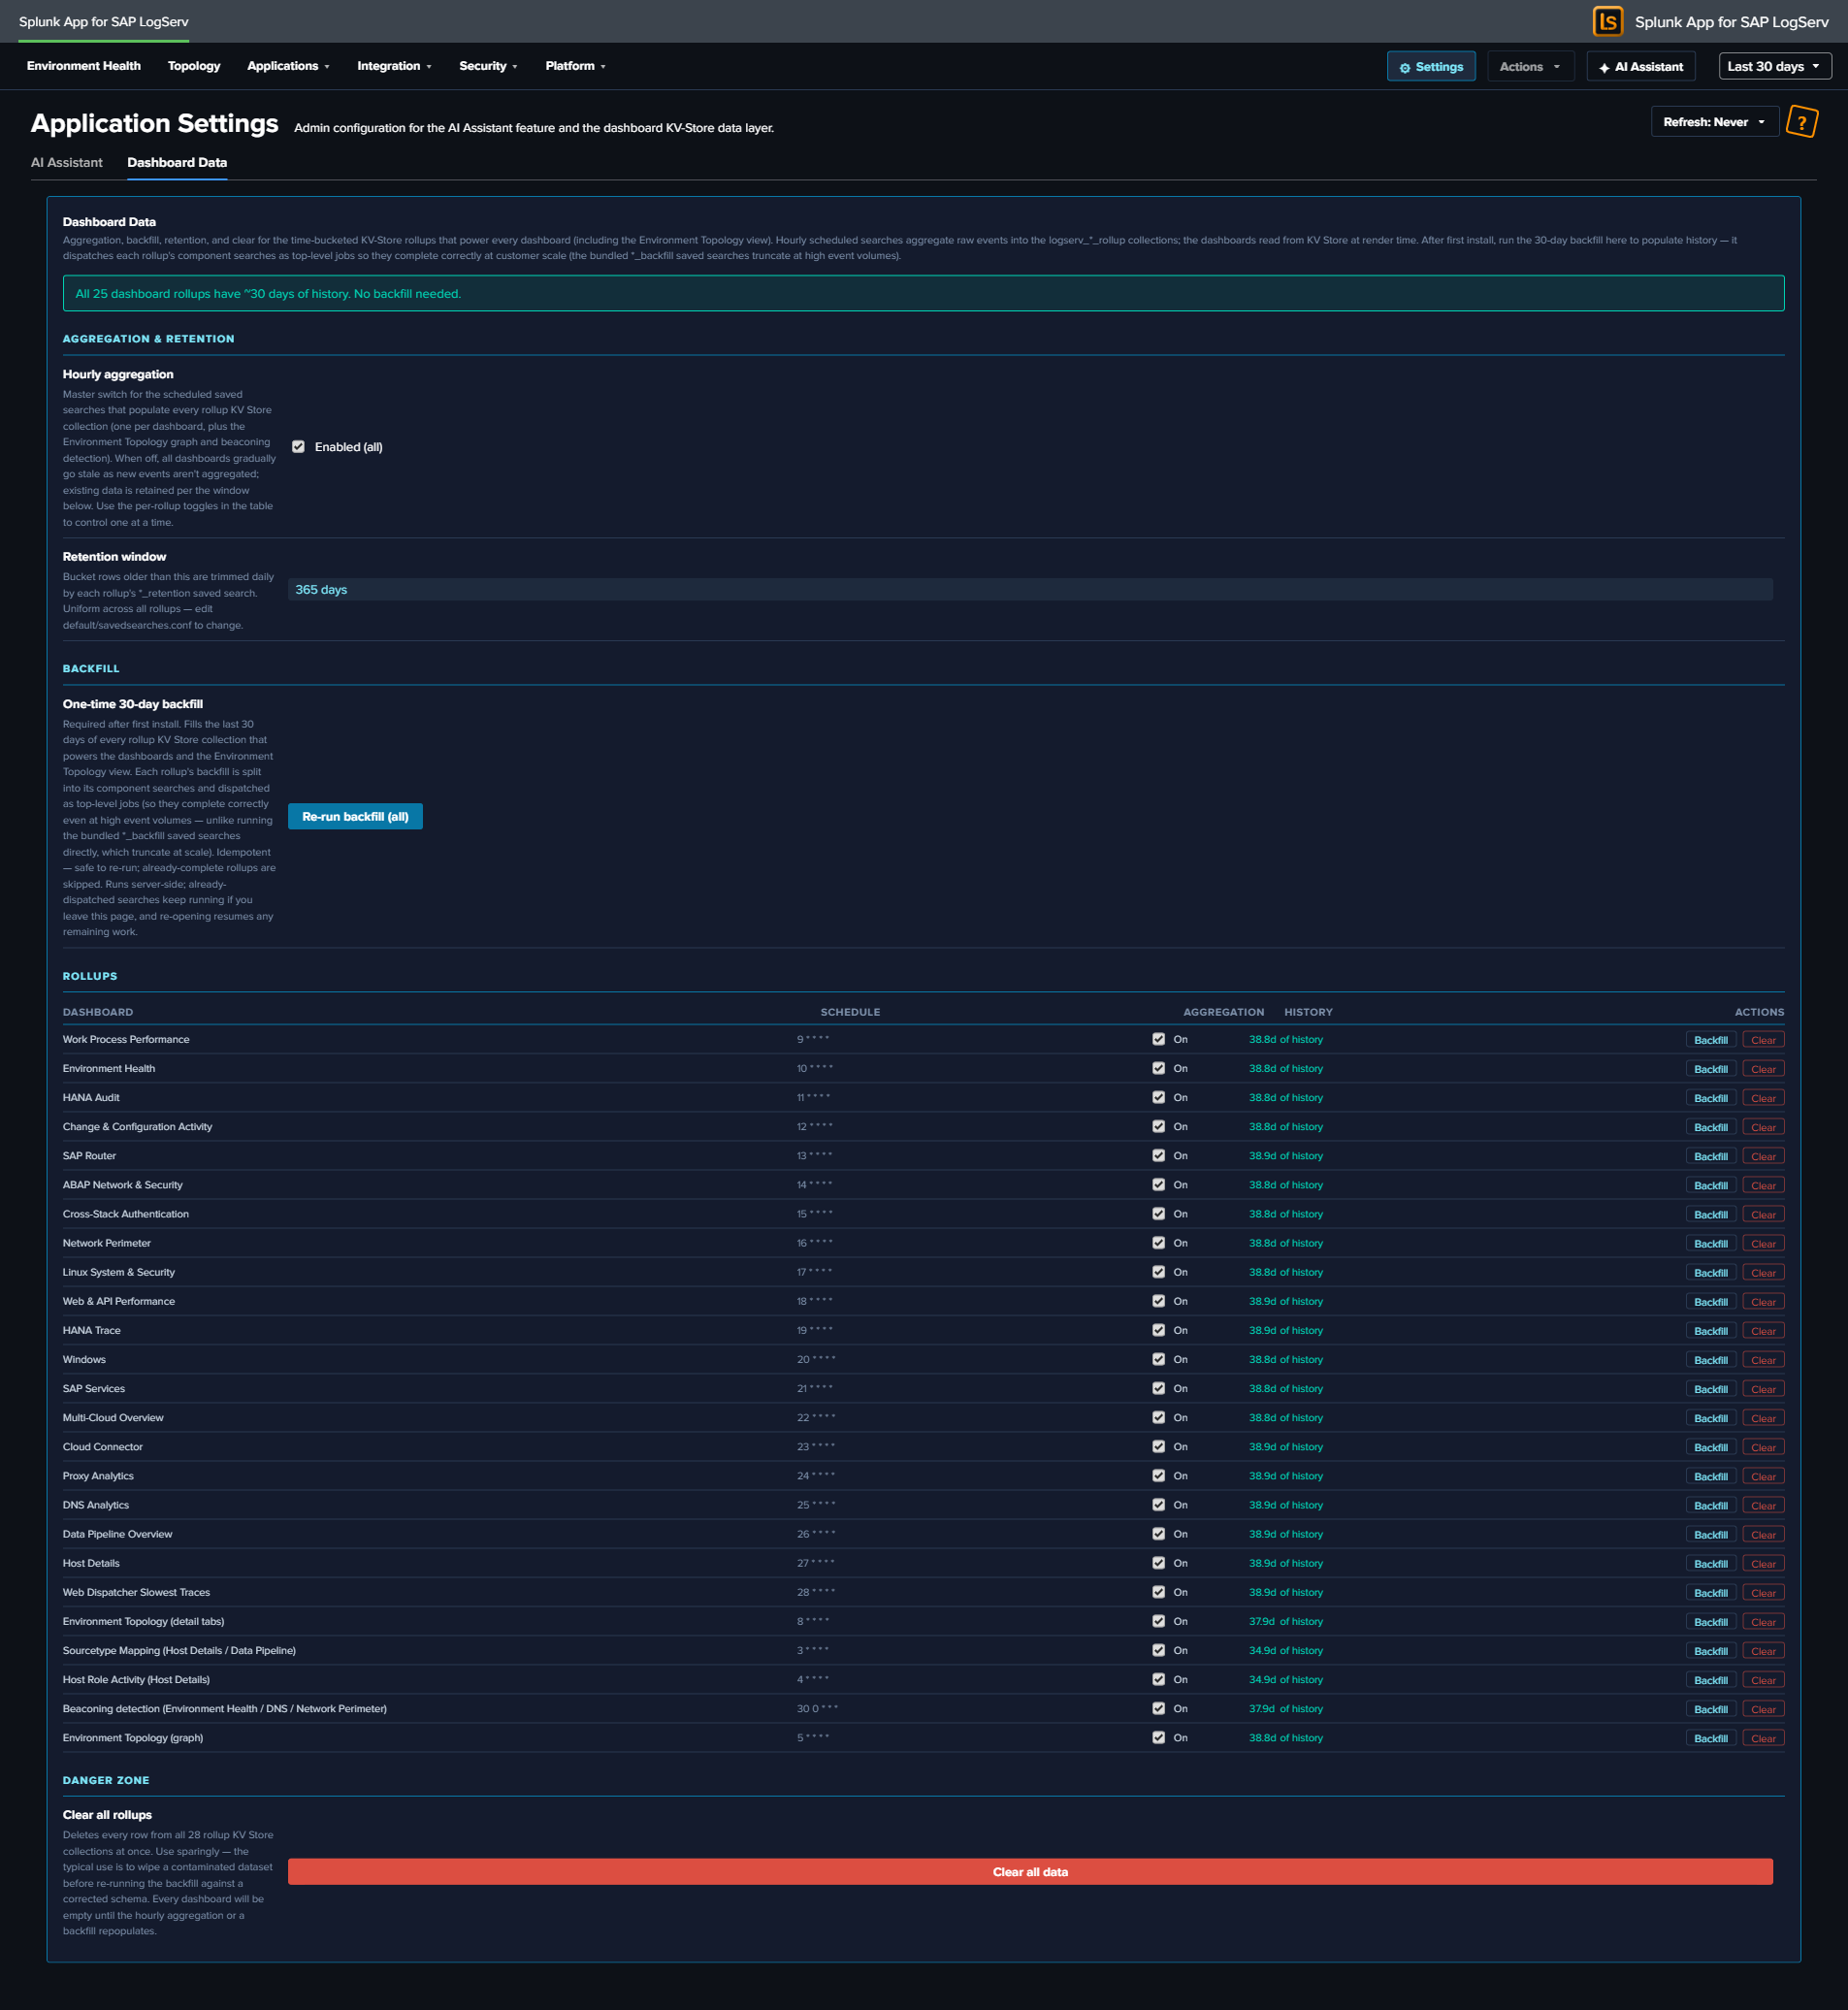
Consolidated in build 245
This tab was merged with the former Topology settings tab. The Environment Topology graph is now just one more rollup in the table below — its aggregation, backfill, retention, and clear are managed uniformly alongside every dashboard rollup. (Folding it in also switched its backfill to the per-arm top-level dispatch, so the topology graph backfill no longer truncates at high event volume.)
Aggregation & retention (global controls)¶
- Hourly aggregation — master switch. Enables/disables the scheduled saved searches that populate every rollup collection. Reads the live state of all aggregate searches and shows Enabled (all), Disabled (all), or Mixed (N/M on). Toggling flips them all (Mixed → enable all). Use the per-rollup toggles in the table to control one at a time.
- Retention window — 365 days (read-only). Bucket rows older than this are trimmed daily by each rollup’s
*_retentionsaved search. Uniform across all rollups; changedefault/savedsearches.confto alter.
Backfilling on first install¶
A freshly installed rollup collection is empty until its hourly aggregation has run. On a high-volume instance you do not want to wait — so the app ships a one-click backfill.
- Open Settings → Dashboard Data (admin-only).
- Review the per-rollup status. Rollups with no history show an “incomplete history” banner and a warning row.
- Click Run backfill (the button targets only the incomplete rollups; once all are complete it becomes Re-run backfill (all)).
The backfill seeds 30 days of history into every rollup collection. It dispatches each rollup’s component aggregation searches as top-level Splunk jobs — this matters at scale: the bundled *_backfill saved searches use a single \| union that Splunk auto-finalizes at a subsearch wall-clock limit, which silently truncates results at high event volume. The Dashboard Data button avoids that by running each component as its own unrestricted job. It shows a progress bar, is idempotent (re-running upserts the same rows), and is resumable (it detects collections that are already complete and skips them).
After the initial backfill, the hourly aggregation keeps each collection current and the 365-day retention grows the cached history toward a full year (seed-and-grow). You only need to run the backfill again if you reinstall or deliberately clear a collection.
If you skip the backfill
You don’t have to run it. Without a backfill, rolled-up panels simply start populating from the next hourly aggregation onward, filling in one hour at a time. The backfill is purely to make 30 days of history available immediately.
Per-rollup table¶
One row per logical rollup (each dashboard, plus Environment Topology (graph), Environment Topology (detail tabs), and Beaconing detection). Columns:
| Column | Meaning |
|---|---|
| Dashboard | The dashboard / view this rollup powers. |
| Schedule | The aggregate search’s cron (e.g. 5 * * * *); hover for the next scheduled run. |
| Aggregation | Per-rollup enable toggle (acts on that rollup’s aggregate search(es); a multi-collection rollup like the topology graph toggles all of its searches). |
| History | Oldest bucket present — ~30d of history (complete), a shorter span (incomplete), empty, or live backfilling N/M while a backfill runs. |
| Actions | Backfill (this rollup only, per-arm top-level dispatch) · Clear (delete this rollup’s collection(s), confirm-gated). |
Danger zone¶
Clear all rollups — a confirm-gated button that deletes every row from all rollup collections at once. Use sparingly (e.g. to wipe a contaminated dataset before re-running a backfill against a corrected schema). Every dashboard is empty until the hourly aggregation or a backfill repopulates it.
Per-panel toolbar¶
Every chart and table panel header carries a small action toolbar plus a “<1m ago” stamp showing when the panel’s search last ran:
| Action | What it does |
|---|---|
| Open in Search | Opens Splunk’s Search app in a new tab with the panel’s SPL and the current time range pre-applied — your real-time, raw drill-down path. |
| Download (CSV) | Exports the panel’s current result set as CSV. |
| Inspect | Opens Splunk’s Job Inspector for the panel’s last search — useful for diagnosing performance or verifying what ran. |
| Refresh | Re-runs the panel’s search immediately. |
KPI single-value cards show the loading spinner but no toolbar (they have no tabular result to export or inspect). While any panel’s search is in flight it renders an orange-dot loading spinner with “Loading data…”.
What to know at a glance¶
- Most panels are hourly-fresh; counts and per-event listings are real-time. If a rolled-up trend looks an hour behind, that’s expected.
- Scheduled searches are staggered into collision-free bands — hourly aggregates at
:03–:28, daily retention at:30–:58, and the ES content (enabled by default) in the disjoint minutes (:00–:02,:29, odd:31–:59) — so no two enabled scheduled searches collide. - On a new high-volume install, run Settings → Dashboard Data → Run backfill once to populate 30 days of history immediately.
- No CIM acceleration is needed for dashboard performance.
- Use a panel’s Open in Search action for live, sub-hour investigation against raw events.
Dashboards Overview ↵
Dashboards Overview¶
The LogServ App includes twenty-one React-based dashboards plus an Environment Topology view, organized as one top-level landing page and four purpose-driven navigation groups. The app is built on @splunk/react-ui + @splunk/visualizations + @xyflow/react and ships as a single React bundle. Requires Splunk 9.4.3 or later.
The top menu is:
Environment Health (default landing) · Topology · Applications ▼ · Integration ▼ · Security ▼ · Platform ▼ · AI Assistant · Search
Use this page as an index — click any dashboard below to see its full purpose, panel list, and interpretation guide on the corresponding category page.
Full Inventory¶
Start Here¶
| Dashboard | Purpose | Key Data Sources |
|---|---|---|
| Environment Health | Cross-cutting operations view of errors, security failures, and performance across the entire SAP landscape. Default landing page. | All sourcetypes |
Topology¶
| Dashboard | Purpose | Key Data Sources |
|---|---|---|
| Environment Topology | Interactive graph view of SAP systems, integration partners, and endpoints. Force-directed initial layout, self-derived IP→SID inventory, named saved layouts via KV Store. KV Store refreshed hourly by scheduled saved searches; manual Refresh button in the toolbar for on-demand re-fetch. | sap:abap:gateway, sap:abap:icm, sap:hana:tracelogs, sap:saprouter, plus host inventory from linux_messages_syslog osquery events |
Applications (SAP application runtime)¶
| Dashboard | Purpose | Key Data Sources |
|---|---|---|
| ABAP Network & Security | ICM traffic analysis, gateway monitoring, and ABAP audit events | sap:abap:icm, sap:abap:gateway, sap:abap:audit |
| ABAP Operations | ABAP runtime health, dispatcher status, work process activity, and system uptime | sap:abap:dispatcher, sap:abap:enqueueserver, sap:abap:event, sap:abap:messageserver, sap:abap:sapstartsrv, sap:abap:workprocess |
| Work Process Performance | SAP ABAP work process utilization, dispatcher health, and function-level activity | sap:abap:workprocess, sap:abap:dispatcher |
| HANA Audit | SAP HANA database audit events, security monitoring, user activity, risk-tiered events, and after-hours admin activity | sap:hana:audit |
| HANA Trace | SAP HANA database trace logs, component health, and error analysis | sap:hana:tracelogs |
Integration (how SAP connects to other systems)¶
| Dashboard | Purpose | Key Data Sources |
|---|---|---|
| SAP Services | sapstartsrv authentication, SSL/TLS failure analysis, and host agent health | sap:sapstartsrv, sap:saphostexec |
| SAP Router | SAP Router connection activity, error analysis, and network boundary monitoring | sap:saprouter |
| Cloud Connector | SAP Cloud Connector HTTP traffic, audit events, and access denied events | sap:scc:audit, sap:scc:http_access |
| Web Dispatcher | HTTP traffic analysis, response times, status codes, and client patterns | sap:webdispatcher:access |
| Web and API Performance | Four-stage request timing, response-time Avg/Max trends, TLS posture, cross-source error correlation | sap:webdispatcher:access, sap:scc:http_access |
Security (cross-source synthesis + compliance)¶
| Dashboard | Purpose | Key Data Sources |
|---|---|---|
| Network Perimeter | Unified network-boundary view: firewall drops (inbound), proxy outbound traffic, DNS resolution, and cross-source suspicious-activity correlation | linux_secure, squid:access, isc:bind:query |
| Cross-Stack Authentication | Unified authentication failure analysis across SAP, HANA, and Windows layers | sap:sapstartsrv, sap:hana:audit, XmlWinEventLog |
| Change & Configuration Activity | Cross-stack audit trail: HANA user/role/privilege changes, Windows account and group modifications, Linux sudo and user-management activity, with compliance-focused privileged and after-hours views | sap:hana:audit, XmlWinEventLog, linux_messages_syslog |
Platform (underlying infrastructure, ingest, and forensics)¶
| Dashboard | Purpose | Key Data Sources |
|---|---|---|
| Data Pipeline Overview | Ingest pipeline view: 5 KPIs, Sourcetype Summary table, host activity, and source-to-sourcetype link graph. Two tabs (Overview + Linked Graph). Dashboard-wide host filter in title row scopes every panel + the linked graph. | All sourcetypes |
| Multi-Cloud Overview | Per-cloud-provider ingest split: AWS vs Azure event counts, sourcetype distribution per provider, recent activity. Built on the indexed cloud_provider field with the sap_logserv_cloud_provider_default_macro for legacy AWS defaulting. See Azure Setup Guide. |
All sourcetypes (filtered by cloud_provider) |
| DNS Analytics | DNS query analysis, top resolvers, beaconing detection, and client activity | isc:bind:query, isc:bind:network, isc:bind:transfer |
| Linux System & Security | Linux OS events, SAP application activity, and firewall monitoring (with Top Drop Source surface) | linux_messages_syslog, linux:cron, linux:warn, linux:sudolog, linux:slapd, linux_secure |
| Windows Events | Windows operational health — event severity trends, top event codes, service state changes, PowerShell activity | XmlWinEventLog |
| Proxy Analytics | Squid proxy traffic, top domains by bandwidth, cache action distribution, client diversity | squid:access |
| Host Details | Per-host drill-down with Overview, Role Activity, and Sourcetype Mapping tabs. Title-row Multiselect lets you filter to one host, multiple hosts (host IN (...)), or All Hosts; role-specific panels auto-hide for hosts without that data. |
All sourcetypes (host-filtered) |
Searching LogServ data
All dashboards use the sap_logserv_idx_macro macro to query the LogServ index. You can use this same macro in your own searches: `sap_logserv_idx_macro` | stats count by sourcetype
Cross-dashboard navigation
Every dashboard includes a Navigate to Dashboard dropdown and Go button (top-left) that preserves your selected time range when switching between dashboards.
In-dashboard help — the More Info button
Every dashboard also includes a More Info button at the top-right of the toolbar row. Clicking it opens this online documentation in a new browser tab, jumping directly to the section for the dashboard you’re looking at. For multi-tab dashboards (Data Pipeline Overview and Host Details) the button lives on every tab and always links back to the same dashboard’s section in the docs.
Per-dashboard auto-refresh
Each dashboard’s title row carries a Refresh picker (Never / 30s / 1m / 5m / 15m / 30m / 1hr) next to the time-range picker. The selection is per-user-per-dashboard — your choice on Environment Health doesn’t carry over to HANA Audit. State persists across browser sessions via Splunk KV Store.
Performance & data freshness
The dashboards are tuned to stay fast at high event volume — most panels read from an hourly KV-Store rollup layer rather than scanning raw events on every open. After a fresh install on a large environment, an admin runs a one-time backfill. See Dashboard Performance & Data Freshness for how each panel sources its data, what “hourly fresh” means, and the backfill step.
Visual Style¶
All dashboards share a consistent “framed dark cards” visual language so that patterns are easy to recognize as you move between views:
- Dark page background (
#0d1117) with slightly lighter navy panel cards (#141b2d) outlined in cyan (#0877a6) — each visualization sits inside its own framed card with consistent 12 px spacing - KPI typography — large numeric headline with a small muted label; number color carries semantic meaning (white for neutral counts, red for errors/failures/denials, orange for warnings, teal for healthy/positive signals)
- Standard colors — a single standard red (
#dc4e41) is used across all error/failure signals so that “red means something went wrong” is unambiguous - Tables use a fixed dark header row with alternating row striping; clickable cells are highlighted cyan to indicate a drilldown affordance
- Charts strip non-essential ink (no axis titles, no data labels, no progress bars) so the data shape is what your eye lands on
The implementation uses styled-components on top of @splunk/react-ui primitives. Compared to the v0.0.4.x Dashboard Studio v2 era, search-time field extractions are unchanged — what changed is purely the rendering tier.
KPI Sparklines¶
Most KPI panels display a small inline sparkline directly below the headline number. The sparkline visualizes the daily trend across the dashboard’s current time range, so you get both the cumulative total and the shape of how that total accumulated in a single glance. There is no separate “up/down by N” trend value — the sparkline alone carries the trend signal.
Sparklines come in a few flavors depending on what the KPI measures:
- Count-based KPIs (e.g., Total Events, Auth Failures) — sparkline shows daily event count
- Distinct-count KPIs (e.g., Active Hosts, Unique Components) — sparkline shows daily distinct count
- Rate KPIs (e.g., HTTP Error Rate, Web Error Rate %) — sparkline shows daily error percentage
- Volume KPIs (e.g., Total Volume, Total Bandwidth) — sparkline shows daily MB; headline shows formatted KB/MB/GB
- Empty-safe wrap — when a KPI’s search returns zero events, the KPI displays
0(rather than###) with a flat-zero sparkline
Click-Through Drilldowns¶
Most KPIs, table rows, and many chart points are clickable:
- Clicking a KPI opens a contextual destination — typically the related drill-down dashboard with the current time range preserved, or Splunk’s Search app with a pre-built SPL query for cross-cutting KPIs (e.g., the Environment Health “Total Errors” KPI runs an 11-sourcetype OR search across the estate).
- Clicking a table row opens a filtered view — Host Details for
hostcolumns, the relevant specialist dashboard forsourcetypecolumns, or Splunk’s Search app with the row’s context spliced into a SPL filter. - Clicking a chart point typically opens the underlying search for that time bucket or series.
- Every drill-down opens in a new browser tab with
noopener,noreferrersecurity flags. Time-range query params (?earliest=...&latest=...) are preserved across the navigation so the destination loads at the source dashboard’s window.
AI Assistant Drill-Down Chips¶
Tool-result tiles in the AI Assistant’s right pane carry two drill-down chips in their actions slot, alongside the Clear button:
↗ Dashboard— opens the related OOTB dashboard (one chip per related dashboard for prompts mapped to multiple). Sourced from the intent map’sdashboardfield.↗ Run SPL— opens Splunk’s universal Search app with the tool’s SPL pre-populated and the dispatch’s exact earliest/latest pre-applied. The same chip renders alongside[→ saved_search]citations in the chat narrative on the left pane.
These chips connect the AI Assistant’s investigation flow back into the dashboards: a top-N finding tile leads directly to the relevant dashboard, OR to a raw-search drill-down at the same time window the AI just queried.
Download PNG¶
Every dashboard’s title-row toolbar includes a Download PNG button. The capture uses html2canvas to render the full dashboard DOM (including off-screen content) to a PNG file, so the saved image always covers the entire dashboard length — not just what’s visible in the viewport. Useful for sharing in slide decks, embedding in incident reports, or capturing a dashboard’s state at a specific moment for compliance evidence.
Environment Health¶
Why This Dashboard Matters¶
The Environment Health dashboard is a single-pane-of-glass operations view that aggregates the most critical signals from across the entire SAP landscape. Instead of switching between individual dashboards to piece together overall health, administrators can use this dashboard to immediately identify active errors, security failures, and performance degradation. Every panel links to the relevant detailed dashboard for investigation, making this the recommended starting point for daily operations monitoring and incident triage.
Environment Health is the default landing page when you open the LogServ App — it sits above the four category dropdowns in the top menu.
Panels¶
- Total Errors – Aggregate count of errors across all monitored sourcetypes. Click to open a detailed search showing errors by category, sourcetype, affected hosts, and last-seen time.
- HANA Failed Ops – Count of non-successful HANA audit operations (login failures, permission denials, DDL errors). Click to drill down to HANA Audit dashboard.
- Auth Failures – Combined count of sapstartsrv authentication failures and HANA audit connection failures. Click to drill down to SAP Services dashboard.
- Firewall Drops – Count of Linux firewall (iptables) drop events across all monitored hosts. Click to drill down to Linux dashboard.
- Web Error Rate % – Percentage of Web Dispatcher requests returning 4xx/5xx status codes. Click to drill down to Web Dispatcher dashboard.
- Beaconing Domains – Count of DNS domains exhibiting periodic query patterns that may indicate malware or C2 communication. Click to drill down to DNS Analytics dashboard.
- ABAP Error Trend – Stacked column chart of daily ABAP errors by sub-source (Dispatcher, ICM, Gateway). Click to drill down to ABAP Security dashboard.
- HANA Error Trend – Stacked column chart of daily HANA errors (Audit Failures, Trace Errors). Click to drill down to HANA Audit dashboard.
- Security Error Trend – Stacked column chart of daily security errors (Auth Failures, Firewall Drops). Click to drill down to SAP Services dashboard.
- Web/Network Error Trend – Stacked column chart of daily web/network errors (WebDisp 4xx/5xx, Router Errors, Proxy Denied). Click to drill down to Web Dispatcher dashboard.
- Cloud Connector Error Trend – Stacked column chart of daily Cloud Connector HTTP errors (4xx Client, 5xx Server). Click to drill down to Cloud Connector dashboard.
- OS/Infra Error Trend – Stacked column chart of daily Windows events by severity (High, Medium). Click to drill down to Windows dashboard.
- Recent Critical Events – Table of the 20 most recent critical events (HANA audit failures, ABAP dispatcher FATAL, HANA trace fatal, auth failures, Windows high severity). Click any row to drill down to Host Details for that host.
- Top Affected Hosts – Table of hosts ranked by total error count with breakdowns by category (ABAP, HANA, Services, Firewall, Other). Click any host to drill down to Host Details.
- Web Dispatcher Response Time – Line chart of daily average response time trend for web dispatcher requests. Click to drill down to Web Dispatcher dashboard.
- ICM Status Codes – Stacked column chart of HTTP status code categories (2xx/3xx/4xx/5xx) over time. Click to drill down to ABAP Security dashboard.
- Data Pipeline – Events/Day – Average daily event volume and daily trend line for monitoring pipeline health and detecting ingestion gaps. Click to drill down to Overview dashboard.
Drill-Down Behavior¶
Every KPI card, chart panel, and table row on this dashboard is clickable and opens its drill-down destination in a new browser tab with the source dashboard’s currently-selected time range pre-applied (?earliest=...&latest=...). The destination’s TimeRangeProvider parses the URL and hydrates its initial time-range from those params on mount, so a click from “Last 7 days” lands you in the destination at the same window. Two destination patterns:
- Cross-dashboard drill-downs — most KPIs and charts navigate to the relevant React dashboard (
/applications/hana-audit,/integration/cloud-connector, etc.). - Splunk Search drill-downs — the Total Errors KPI runs a cross-cutting 11-sourcetype OR query that no single dashboard owns; it opens Splunk’s universal Search app with the SPL pre-filled. Same time-range carry-through.
The dashboard’s title-row toolbar carries a Refresh picker so you can have the page tick continuously (Never / 30s / 1m / 5m / 15m / 30m / 1hr) for use as an operations wallboard.
What to Look For¶
- Rising error trend – An upward slope in any error category chart indicates a worsening condition. Correlate the timing with recent changes, deployments, or infrastructure events. Each chart drills directly to the relevant dashboard for investigation.
- Auth failure spikes – Sudden increases in the Auth Failures KPI or Security Error Trend may indicate brute-force login attempts, expired credentials, or misconfigured service accounts. Cross-reference with the HANA Audit and SAP Services dashboards.
- HANA audit failures – Non-zero HANA Failed Ops always warrant investigation. Failed operations may indicate unauthorized access attempts, privilege escalation, or application misconfigurations.
- Cloud Connector errors – A spike in the Cloud Connector Error Trend (especially 5xx Server errors) may indicate backend system unavailability, network issues between the SCC and SAP BTP, or certificate expiration.
- Pipeline volume drops – A sudden drop in the Events/Day trend may indicate an SQS queue backup, S3 input failure, HF outage, or filter misconfiguration. Check the Data Pipeline Overview for per-host visibility.
- Response time degradation – An increasing trend in Web Dispatcher response time often precedes user-facing performance complaints. Investigate ICM status codes for correlated 5xx errors.
- Host concentration – If the Top Affected Hosts table shows errors concentrated on one or two hosts, those systems may have a localized issue (disk full, service crash, misconfiguration) rather than an environment-wide problem.
Environment Topology¶
Why This View Matters¶
The Environment Topology view answers a question every SAP administrator has: “what’s actually talking to what?” Traditional dashboards show events, errors, and aggregates per source — but the shape of how SAP systems integrate with each other (RFC partners, HANA tenant relationships, web traffic boundaries, cross-zone connections) is hidden in those tabular surfaces. This view materializes that shape as an interactive graph drawn from your existing log data — no new ingest, no CMDB integration, no tagging effort required.
Use it to:
- Validate that your topology matches the as-designed architecture (every system shows up; no rogue partners are talking inbound).
- Investigate a single SID’s call surface — who calls it, what does it call, where are the errors concentrated?
- Drill from an edge (a single integration relationship) into the raw events with one click — every edge carries a denormalized SPL filter expression so you can pivot to Splunk’s universal search instantly.
- Onboard a new analyst by giving them a one-page picture of the SAP landscape before they start digging into individual dashboards.
- Spot orphaned IPs / hosts that don’t belong to any known SID — these are typically misconfigured load balancers, scanners, or unauthorized integration partners.
This view replaces the manual hand-drawn architecture diagrams that SAP admin teams typically maintain in slides or wikis. Because it’s data-driven, it stays current as systems are added or retired.
What’s on Screen¶
The view is laid out in four regions:
Top toolbar — the layout-mode dropdown (Force / Layered / Tree), Refresh button (re-runs the KV Store fetch while preserving saved positions), Save Layout, Load Layout dropdown with the ⚙ Manage Layouts entry, Snap mode toggle, and the saved-layout name chip showing what’s currently loaded.
Left sidebar — two stacked panels. The Systems panel rolls up the inventory (8 systems, total calls, partner count) and lists each focused SID with a per-SID call-volume bar. The Integration types panel is a checkbox list of the eight tracked integration types (RFC sync, iDoc async, qRFC, tRFC, bgRFC, Web service / SOAP, OData / Gateway, BTP iFlow / CPI) — un-ticking a type dims its edges in the canvas without removing them.
Center canvas — the interactive graph itself, rendered with @xyflow/react. Nodes:
- Focused SIDs — large red-ringed circles for the SAP systems your environment is centered around (the high-traffic hubs).
- Secondary SIDs — medium cyan-ringed circles for other internal SAP systems.
- DB-tagged partners — circular discs with a cylinder icon when the partner is a database vendor (HANA, Oracle, MSSQL, Postgres, DB2). HANA systems specifically are tagged when their SID appears as a
sap_sidclause on ahana_tenant-type edge — distinct from HANA tenants (which are logical databases inside a HANA system, named after the application SID they back). - Other partners — rounded squares for non-DB external endpoints (web partners, gateways, generic IPs).
Each SID and DB partner carries a 3-segment health ring painted around its perimeter, showing the proportion of normal (green) / warning (orange) / error (red) calls in the visible time window. Non-DB partners (the rounded squares) carry an equivalent rounded-square perimeter outline. Nodes with no calls or with all calls in a single bucket render as a solid full ring in the dominant color (a healthy node with all-normal calls shows a solid green ring; an idle node still shows green so you can tell the canvas painting succeeded). The classification: edges with errorRate < 10% route their errors to the warning bucket; edges with errorRate ≥ 10% route to the error bucket; everything else is normal. HANA-tagged nodes additionally route WARNING-severity events and slow tenant SQL queries (hana_op_duration_ms > 1000) into the warning bucket as a vendor-specific health signal — these counts are first-class fields on the edge bucket rows, computed at hourly aggregation time from sap:hana:tracelogs.
Right sidebar (selection-driven) — what shows here depends on whether you’ve selected a node or an edge.
When a node is selected, four tabs surface that node’s per-selection context:
- Calls/Hr — bar chart of hourly call volume into the selected node, hardcoded to the last 24 hours regardless of the global time-range picker (this chart’s purpose is “what’s happening RIGHT NOW on this node,” not “what happened over the picker’s window”). For HANA-tagged nodes, an additional roll-up section above the chart shows tenants list, tenant SQL ops, p95/max SQL duration, and auth success/fail counts — derived from incident edges in JS, no extra SPL.
- Programs — top ABAP programs / RFC functions / HANA actions / web URIs invoked on the node, sourced from the gateway, ICM, HANA audit, and webdispatcher logs.
- Errors — categorized error breakdown for the node (HTTP 4xx/5xx, severity ERROR / CRITICAL / FATAL, gateway error_function, ICM transactions). Aggregated by sourcetype + error_kind.
- Hosts — the host(s) backing the SID, with first-seen / last-seen /
dc(sourcetype)per host.
When an edge is selected, five tabs surface that edge’s per-call context:
- Overview — endpoint cards (source / direction / target), pre-computed aggregates (call count, error count, error rate, sourcetype), and an inline activity trend chart.
- Activity — full-width stacked-area chart of successful calls + errors over the visible time window.
- Operations — donut chart of the top 10 entities for this edge type (HTTP URIs, RFC programs, HANA actions, HANA trace components).
- Performance — for HTTP edges, latency percentiles (P50 / P95 / Max) and bytes-out plus per-status-class call counts. For RFC, ICM tasks histograms. For HANA, percentile breakdown via
transpose 0. - Errors — top 15 failure modes with
error_kind,error_detail, count, and last-seen timestamp.
Selection is mutex — clicking a node clears any selected edge and vice versa, so the right pane never shows mixed context. Clicking empty canvas (the pane) clears both. Each side preserves its own preferred tab independently when you swap between selections.
Bottom panel — Live Activity table showing the top 8 RFC partners by call count for the current time range, each row clickable to drill into the source endpoint’s detail.
MiniMap (bottom-right of the canvas) — drag the cursor inside the minimap to pan the main canvas. Direction follows the cursor: dragging right → main canvas shows more right-side content; dragging down → shows more bottom content. Magnitude is proportional to your cursor delta scaled by the minimap’s viewBox-to-pixel ratio. Single-click does nothing — drag-to-pan is the only minimap interaction.
Where the Data Comes From¶
The view reads from a time-bucketed KV Store fed by hourly scheduled saved searches. (An earlier design ran six SPL searches on demand every time the view opened, which produced a 5–15 second page load on busy Splunk instances; the data layer was rewritten to the KV Store design described here.)
| KV Store collection | Schema | Populated by |
|---|---|---|
logserv_topology_nodes |
one row per (canonical entity, hourly bucket); 10 fields including event_count, last_seen |
logserv_topology_aggregate_nodes (hourly cron 5 * * * *) |
logserv_topology_edges |
one row per (edge, hourly bucket); 21 fields including pre-computed response_time_p50/p95/max, icm_tasks_max/avg, hana_op_p95_ms/max, auth_success_count/fail_count, error_count, plus canonical spl_sourcetype + spl_filter_clauses for right-pane drilldowns |
logserv_topology_aggregate_edges (hourly cron 5 * * * *) |
logserv_topology_inventory |
flat (no bucket dimension), keyed by canonical_value; IP / host → SID mapping for retargeting raw IPs to their owning SID node | logserv_topology_aggregate_inventory (hourly cron 5 * * * *) |
Two retention searches keep the KV Store sized: logserv_topology_retention (daily 00:30 UTC) trims to 30 days of bucket history; logserv_topology_backfill_* (disabled by default) lets an admin re-populate the 30-day window after a fresh install via Settings → Dashboard Data.
The aggregation searches read from the same six SPL sources as the legacy on-demand path:
| Source | What it contributes |
|---|---|
sap:abap:gateway |
RFC peer/local IPs (P=<peer> / L=<local> fields). The local IP is canonical for IP→SID inventory because it always belongs to this host’s SID. |
sap:abap:icm |
ICM peer/local IPs for HTTP-side traffic. |
sap:hana:tracelogs |
HANA host + tenant SID extracted from the source path (/usr/sap/<HANA_SID>/HDB<inst>/<host>/trace/DB_<TENANT_SID>/). Yields the rich HANA-side topology including multi-tenant relationships. |
sap:saprouter |
Peer hostname extracted from the parens after host <ip>/<service> (<resolved.host>). Provides the inbound edge for external partners. |
linux_messages_syslog (osquery cpu_brand subset) |
Host inventory: CPU model, RAM, OS, region, AZ, EC2 instance ID. Used to enrich the host-level facts on the Hosts tab. |
Default Splunk host field (cross-source fallback) |
Picks up hosts that aren’t surfaced in the above. |
When you open the view, the React app fetches a time-window slice of these collections via the Splunk Web REST proxy (/en-US/splunkd/__raw/servicesNS/nobody/<APP>/storage/collections/data/<NAME>?query={"bucket_ts":{"$gte":...,"$lte":...}}). The fetch returns in well under a second on production-scale data — orders of magnitude faster than the legacy on-demand path. Per-edge SPL searches still dispatch on demand when you click an edge (the right pane’s 5 tabs each fire one tab-specific query) but they hit pre-narrowed indexes and return quickly.
Self-Derived IP→SID Inventory¶
The “which IP belongs to which SID” mapping isn’t read from a CMDB or an admin-maintained lookup — it’s self-derived from the same logs you’re already ingesting. The mechanism is a multi-source union SPL with a mvcount(sids)=1 filter: a host whose multiple sourcetypes all agree on a single SAP SID is unambiguously attributed; otherwise it’s marked “unknown.”
Coverage depends on what your data exposes — unique hostname/IP appearances across multiple SAP sourcetypes attribute cleanly, while shared NAT IPs and external partners typically appear as “unknown” nodes (their SAP affiliation isn’t observable from logs alone, or they legitimately don’t belong to any single SID).
In addition to the inventory, the node-aggregation SPL captures every distinct edge endpoint as a node row in its own right — webdispatcher clientip, ABAP gateway peer_ip, and HANA Audit client_ip (excluding loopback). This means external partners that appear only on the receiving side of integration edges still carry real event counts, not zero, even when they don’t have a SID resolution in the inventory.
The inventory itself is extensible per-customer without new ingest: appending another union arm to the inventory aggregation SPL adds a new attribution source. Future arms could include ICM icm_peer_ip, additional CMDB-style lookup tables, or any other field that uniquely associates an IP / host with a SAP SID.
Layout Modes¶
The LAYOUT dropdown switches between three layout algorithms:
- Force — d3-force directed graph with charge varying by node kind. Best for small-to-medium graphs and exploratory views; the default for first-time viewers.
- Layered — ELK Sugiyama-layered top-to-bottom flow with orthogonal edges and near-zero edge crossings. Best for traffic-flow analysis where you want to see “what flows into what” structurally.
- Tree — ELK mrtree classic top-down tree with hubs at top and spokes radiating downward. Best when the topology is approximately hub-and-spoke shaped.
Both ELK-based modes (Layered + Tree) share the same lazy-loaded ~280 KB elkjs bundle, so adding Tree mode after Layered shipped was a near-zero-cost extension. Force mode remains synchronous (no bundle hit on initial load).
Each layout mode has its own saved-layout slot — saving a layout in Force doesn’t bleed into Layered or Tree. Switching layouts via the LAYOUT dropdown drops the current saved-positions cache so each mode renders fresh from its own algorithm. The Manage Layouts modal (⚙ entry at the top of the Load Layout dropdown) lets you set a per-mode default layout that auto-loads on mount.
Saved Layouts¶
User-arranged graph layouts are persisted in Splunk KV Store collection logserv_topology_layouts. Each saved layout carries:
- Layout mode — Force / Layered / Tree (so a Force-saved arrangement loads back in Force mode, not Layered)
- Node positions — where you’ve manually placed each node on the canvas
- Panel state — sidebar tab + width
- Viewport — zoom level + pan offset (x, y)
- Enabled integration types — which checkboxes are ticked on the leftbar
- Selected node / edge — what was selected when you saved
- Active right-sidebar tab — Calls/Hr / Programs / Errors / Hosts (node mode) or Overview / Activity / Operations / Performance / Errors (edge mode)
- Snap mode — whether new nodes snap to a grid
Layouts are saved per-user-named — you can save your own variants (“focus on XCQ”, “all DBs”, “external partners only”) and switch between them from the Load Layout dropdown.
The Manage Layouts modal (⚙ entry at the top of the Load Layout dropdown) is where two cross-browser preferences live:
- Per-mode default layout — pick one saved layout per mode (Force / Layered / Tree) to auto-load on mount when you’re using that mode. Each mode section in the modal has its own radio list of mode-matching layouts plus a “(no default)” option.
- Default layout mode — tick the Open in this mode by default checkbox on one of the three sections to declare which mode the dashboard should open in on next login. The checkbox is mutex across the three sections (or none — “no explicit default” leaves the dashboard opening in Force mode). Ticking the checkbox also switches the active mode immediately so you can see what the default-on-next-login experience will look like.
Both preferences are persisted to Splunk KV Store keyed by Splunk username (collections logserv_topology_layout_defaults and logserv_topology_active_mode). Browser localStorage is used as a fast-mount cache mirror, so on a fresh browser the choices hydrate from KV Store on first paint. If you pick defaults in Chrome and open the topology in Firefox, you’ll see the same defaults the next time you log in to the same Splunk instance. When no defaults are stored, the dashboard opens in Force mode with no auto-loaded layout.
Data Refresh Cadence¶
The topology data layer is populated by three hourly scheduled saved searches that write to the KV Store:
logserv_topology_aggregate_nodes— cron5 * * * *, rolls up event activity per (canonical entity, hour bucket)logserv_topology_aggregate_edges— cron5 * * * *, rolls up call counts + per-type aggregates (HTTP latency p50/p95/max, RFC saturation, HANA SQL latency, etc.)logserv_topology_aggregate_inventory— cron5 * * * *, rebuilds the unambiguous IP/host → SID mapping
So the KV Store gets a new bucket every hour at H+5. The view re-reads the KV Store:
- On initial page load
- On global TimeRange picker change
- When the user clicks the toolbar’s Refresh button (useful right after dispatching a backfill saved search)
- When the user selects a different node (re-runs the per-node detail-panel SPL via on-demand
useSearch— independent of the KV Store layer)
There is no client-side auto-polling. The previous Live | Lookup mode toggle was removed in session 044 — the 30-second polling cadence was a leftover from the pre-session-035 on-demand SPL data layer, and after the move to hourly KV Store aggregation, ~119 of every 120 ticks returned byte-identical data. The hourly cron is what governs data freshness now; tightening the cron schedule (e.g., to */15 * * * *) is the right lever if a customer needs sub-hour data freshness, at the cost of more search-job dispatches.
What to Look For¶
- Health rings with prominent orange or red segments — a SID showing >25% red (error bucket) is a system whose external integrations are systematically failing. Click into the node and the Errors tab to see which specific edges are degraded.
- Unknown nodes with high edge weight — an “unknown” SID with hundreds of calls/hr is either a misconfigured CMDB entry on our side, OR an unauthorized partner that nobody documented. Both warrant investigation.
- Asymmetric edge counts — an edge showing many calls one direction but very few the other usually means one side is the caller (RFC client) and the other is the callee (RFC server). Use the Operations tab to confirm which.
- Orphan SIDs — a node with no edges is a system that’s running but not integrated with anything else. May be a quiet test system, or a system whose integration partners aren’t monitored.
- HANA tenants drifting from their HANA system — multi-tenant HANA produces edges from the parent system to each tenant. Missing tenant edges indicate either tenant outage or audit-log gap. The HANA-tagged DB partners specifically use slow tenant SQL queries (>1000 ms) as a warning signal; a tenant lighting up with orange in its ring after a deploy points at slow-query regressions.
- Unexpected external partners — saprouter peer_hostname entries that don’t match the documented partner list are the strongest signal of an unauthorized external integration.
- Edge errors clustered on one sourcetype — clicking an edge and reading the Errors tab can reveal that 90% of failures are 4xx (client-side, not your problem) vs 5xx (server-side, your problem). The edge bucket schema pre-computes per-status-class counts so the Performance tab loads instantly.
- Host counts on the Hosts tab — a SID showing 3 hosts when you expected 2 may indicate a stale forwarder / VM that should have been decommissioned.
Notes¶
- The view’s URL slug is
/integration-topology(historical — the user-visible label was changed from “Integration Topology” to “Environment Topology”, but the URL slug + code identifiers stayed stable so existing bookmarks + saved-layout records remain valid). - Layout persistence works across browser tabs and across Splunk Web sessions — your KV Store records survive Splunkd restarts.
- Layouts are saved per Splunk user — every KV Store record is keyed by
<username>::<slug>, so different users have completely separate records and can’t overwrite each other’s layouts. If the same user edits the topology in two browser tabs concurrently, the tabs race each other and last-tab-save wins (multi-tab edit-collision protection is planned for a future release). - The minimap supports drag-only panning. Single-click and scroll-zoom inside the minimap rectangle are intentionally inert — drag is the one interaction.
Applications ↵
Applications¶
The Applications category covers dashboards that monitor the SAP application runtime layer itself — the ABAP application server and the HANA database engine. These are the workloads SAP customers run every day, and dashboards here answer questions about work processes, dispatcher health, database audit trails, and diagnostic trace output.
React refinements (apply to every dashboard in this category)
Every panel, KPI card, chart, and table row is clickable and opens its drill-down destination in a new browser tab with the source dashboard’s currently-selected time range pre-applied via ?earliest=...&latest=.... The destination’s TimeRangeProvider parses the URL on mount and hydrates its initial range. Every dashboard’s title-row toolbar carries a per-dashboard Refresh picker (Never / 30s / 1m / 5m / 15m / 30m / 1hr) with per-user-per-dashboard cadence persisted via Splunk KV Store, plus a Download PNG button (full-canvas capture via html2canvas).
| Dashboard | Purpose | Key Data Sources |
|---|---|---|
| ABAP Network & Security | ICM traffic analysis, gateway monitoring, and ABAP audit events | sap:abap:icm, sap:abap:gateway, sap:abap:audit |
| ABAP Operations | ABAP runtime health, dispatcher status, work process activity, and system uptime | sap:abap:dispatcher, sap:abap:enqueueserver, sap:abap:event, sap:abap:messageserver, sap:abap:sapstartsrv, sap:abap:workprocess |
| Work Process Performance | SAP ABAP work process utilization, dispatcher health, and function-level activity | sap:abap:workprocess, sap:abap:dispatcher |
| HANA Audit | SAP HANA database audit events, security monitoring, user activity, risk-tiered events, and after-hours admin activity | sap:hana:audit |
| HANA Trace | SAP HANA database trace logs, component health, and error analysis | sap:hana:tracelogs |
ABAP Network & Security¶
Why This Dashboard Matters¶
The ABAP Network & Security dashboard monitors the network-facing components of SAP ABAP systems. The Internet Communication Manager (ICM) handles all HTTP/HTTPS traffic into and out of ABAP, while the Gateway controls RFC connections between SAP systems. Together, these are the primary attack surface for ABAP-based landscapes and the first place where performance degradation manifests during connectivity issues.
Panels¶
- Total Events – Aggregate event count across ICM, Gateway, and Audit sourcetypes
- ICM Errors – Count of ICM events flagged as errors
- Gateway Errors – Count of Gateway events with error details
- Event Volume by Sourcetype – Daily trend of each sourcetype
- ICM Status Codes Over Time – Stacked column chart of 2xx, 3xx, 4xx, and 5xx responses
- ICM Peer Connections – Table of top peer IPs by request count with protocol details
- ICM Request Types – Pie chart breakdown of ICM request types
- Gateway Remote Hosts – Table of gateway connections by remote host, function, and service
- Gateway Errors Over Time – Timeline of gateway error events
- Activity by SID / Instance – Column chart showing event distribution across SAP systems
What to Look For¶
- ICM 4xx/5xx spikes – A sudden increase in client errors (4xx) may indicate application misconfigurations or scanning activity. Server errors (5xx) suggest backend failures or resource exhaustion.
- Unfamiliar peer IPs – New IP addresses appearing in the ICM Peer Connections table warrant investigation, especially if they generate high request volumes or connect using unusual protocols.
- Gateway connections from unknown hosts – The Gateway Remote Hosts table should show expected RFC partners. Unknown remote hosts or unusual service names may indicate unauthorized access attempts.
- Error rate trends – A gradually increasing error rate across days can signal infrastructure degradation (disk space, memory pressure, certificate expiry) before it becomes an outage.
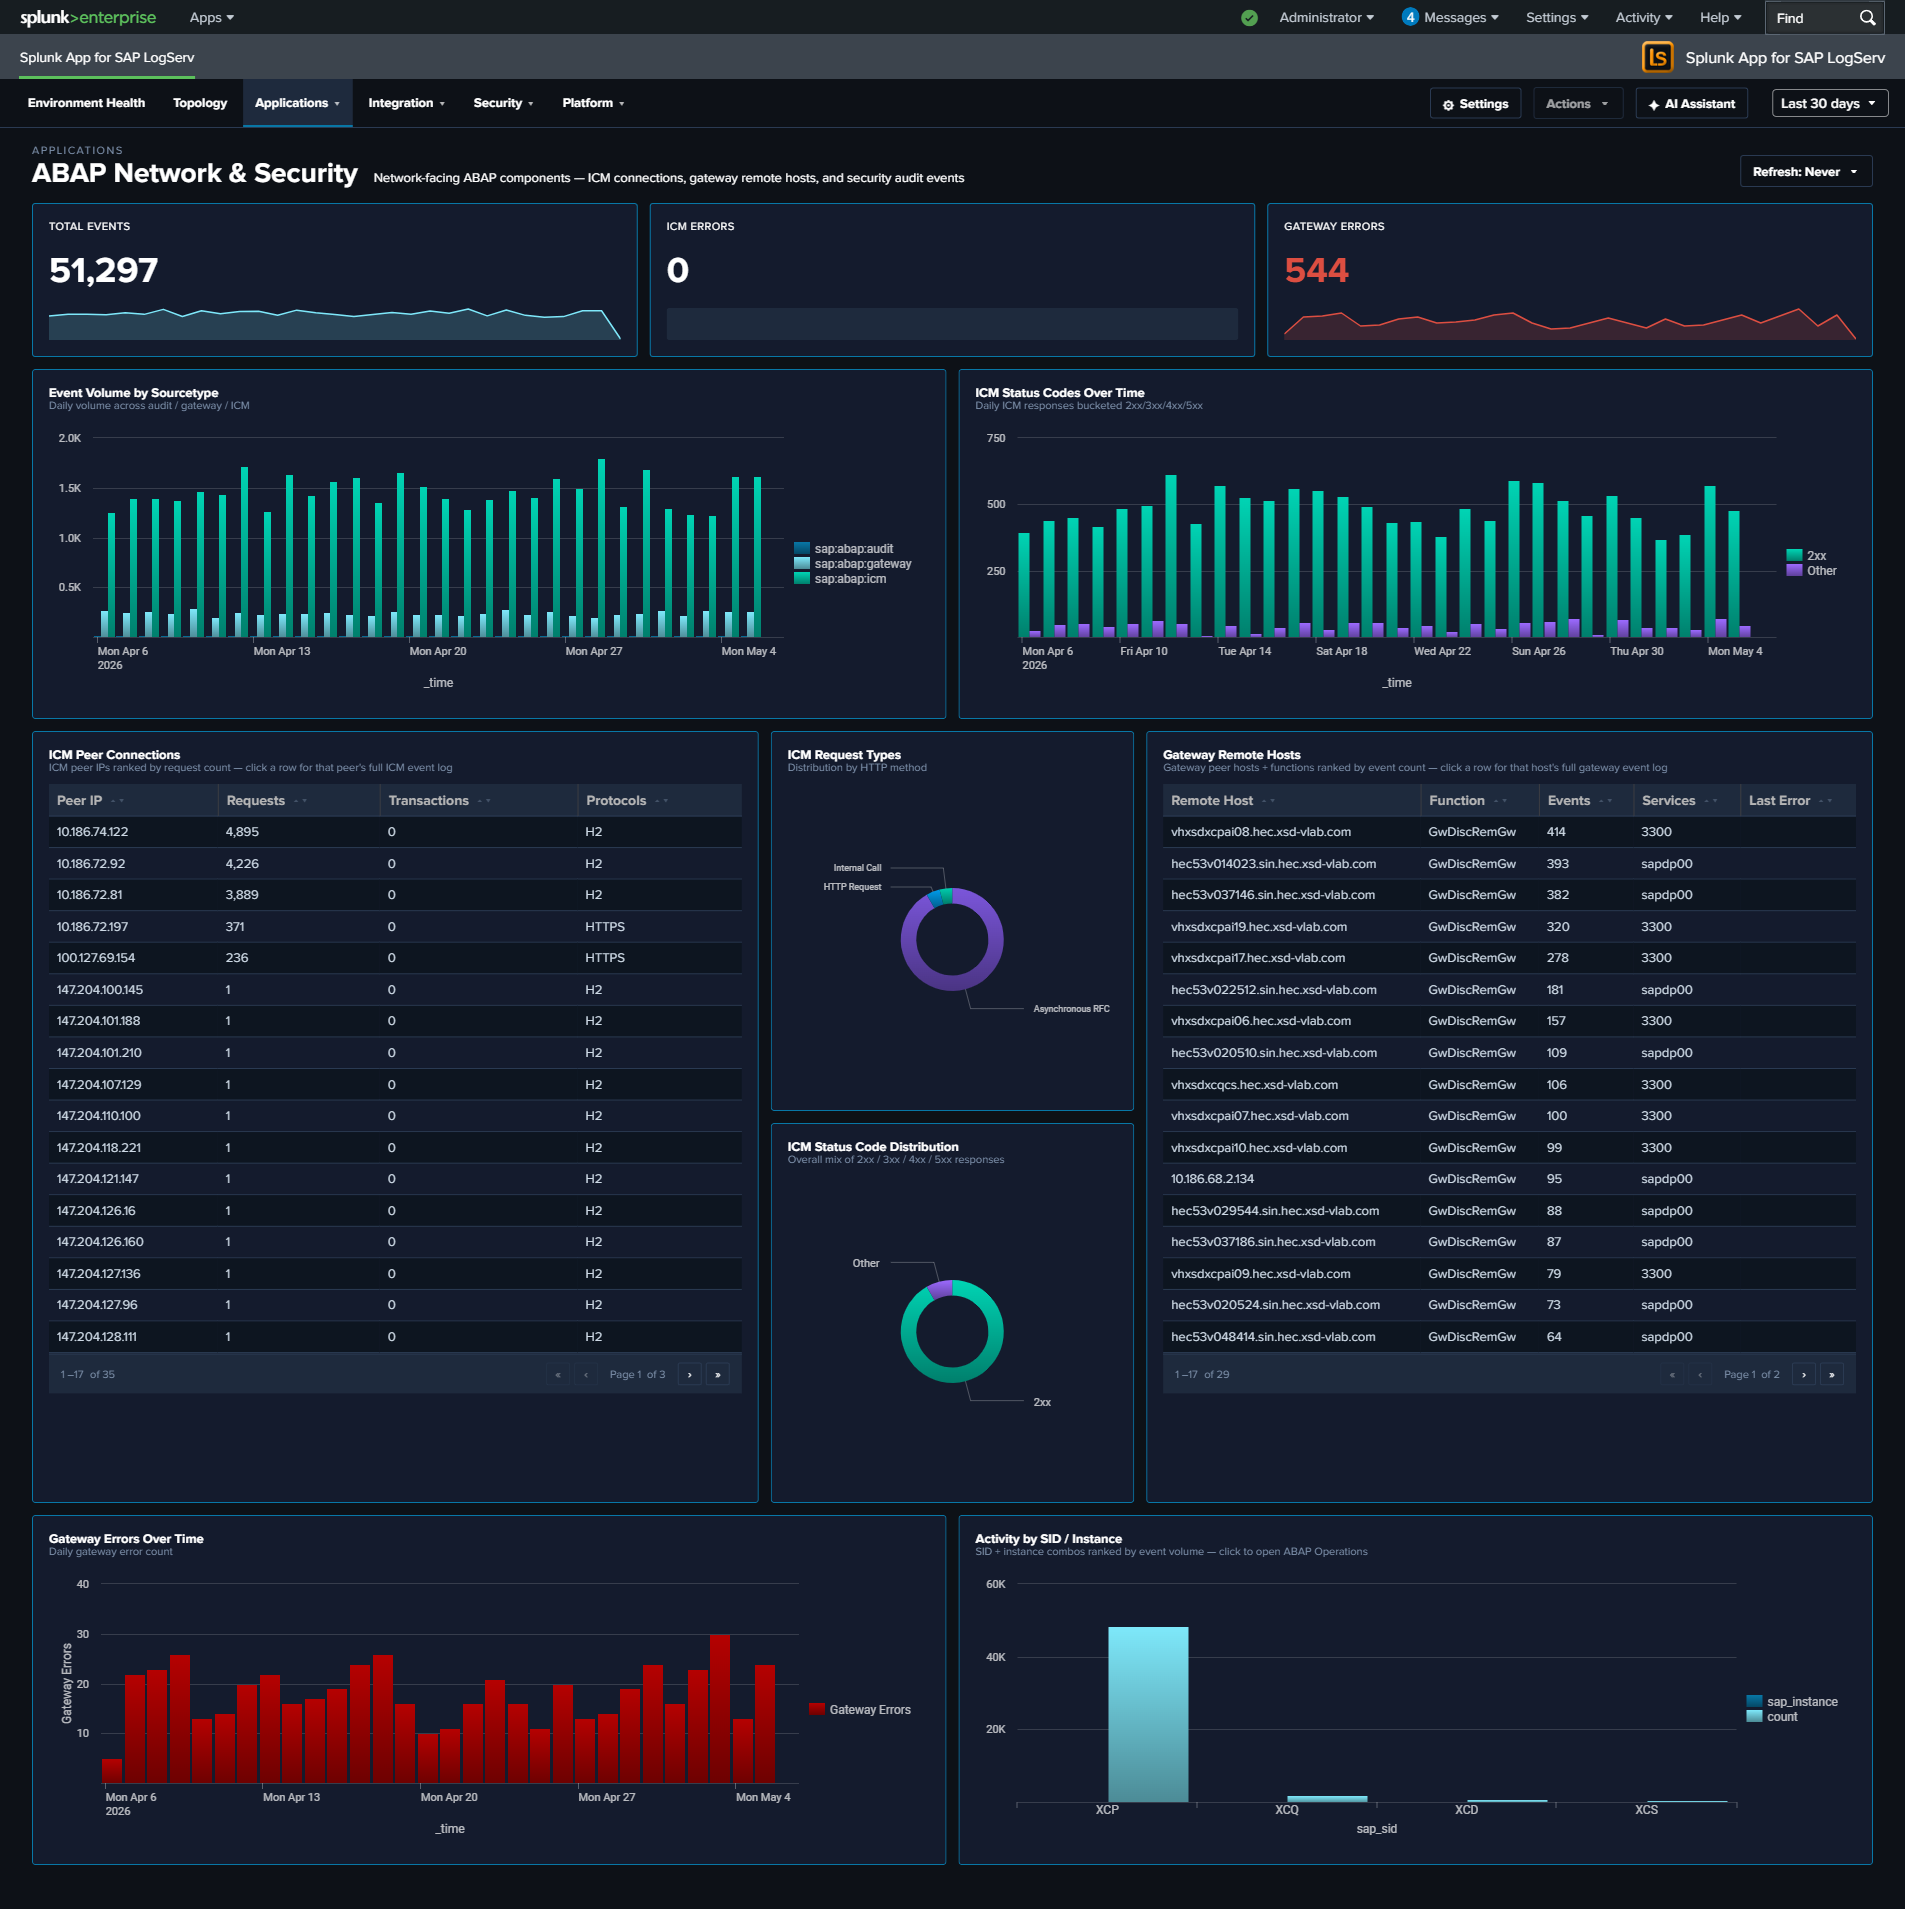
ABAP Operations¶
Why This Dashboard Matters¶
The ABAP Operations dashboard provides runtime health monitoring for the SAP ABAP application layer. It covers the dispatcher (request routing), work processes (transaction execution), enqueue server (lock management), and system uptime. These components are the engine of every SAP ABAP system, and their health directly impacts user experience and business process execution.
Panels¶
- Total Events – Aggregate event count across all ABAP operations sourcetypes
- Active SIDs – Count of distinct SAP System IDs reporting data
- Dispatcher Errors – Count of ERROR/FATAL severity dispatcher events
- Event Volume by Sourcetype – Daily trend across all six sourcetypes
- System Uptime (Latest) – Table showing the most recent uptime in days and hours per SID/instance
- Dispatcher Severity Over Time – Stacked column chart of dispatcher log severity levels
- Top Work Process Functions – Table of the most frequently called work process functions
- Work Process Categories – Donut chart with bottom legend showing activity distribution across all 13 SAP work process categories (e.g.,
B = Database Interface,A = ABAP Processor,S = SQL / Statistics,M = Memory Management,X = RFC / CPIC). The donut uses thewp_category_namefield populated by the app’sprops.confEVAL so every category code gets a friendly name. - Enqueue Lock Activity – Timeline of lock management operations
- Activity by SID / Instance / Type – Event distribution across SAP systems and sourcetypes
What to Look For¶
- Uptime resets – A system showing low uptime (hours instead of days) indicates a recent restart. Unexpected restarts may signal crashes, memory issues, or unplanned maintenance.
- Dispatcher ERROR/FATAL increases – Rising error severity in the dispatcher indicates work process exhaustion, connection failures, or configuration problems that will soon impact users.
- Work process category shifts – A sudden change in the distribution of work process categories (e.g., dialog processes being consumed by batch jobs) suggests resource contention.
- Enqueue lock spikes – A sharp increase in lock operations can indicate application deadlocks, long-running transactions holding locks, or database performance issues causing lock wait times to increase.
- SID/instance imbalance – If one system or instance is generating significantly more events than its peers, investigate whether it’s handling disproportionate load or experiencing issues.
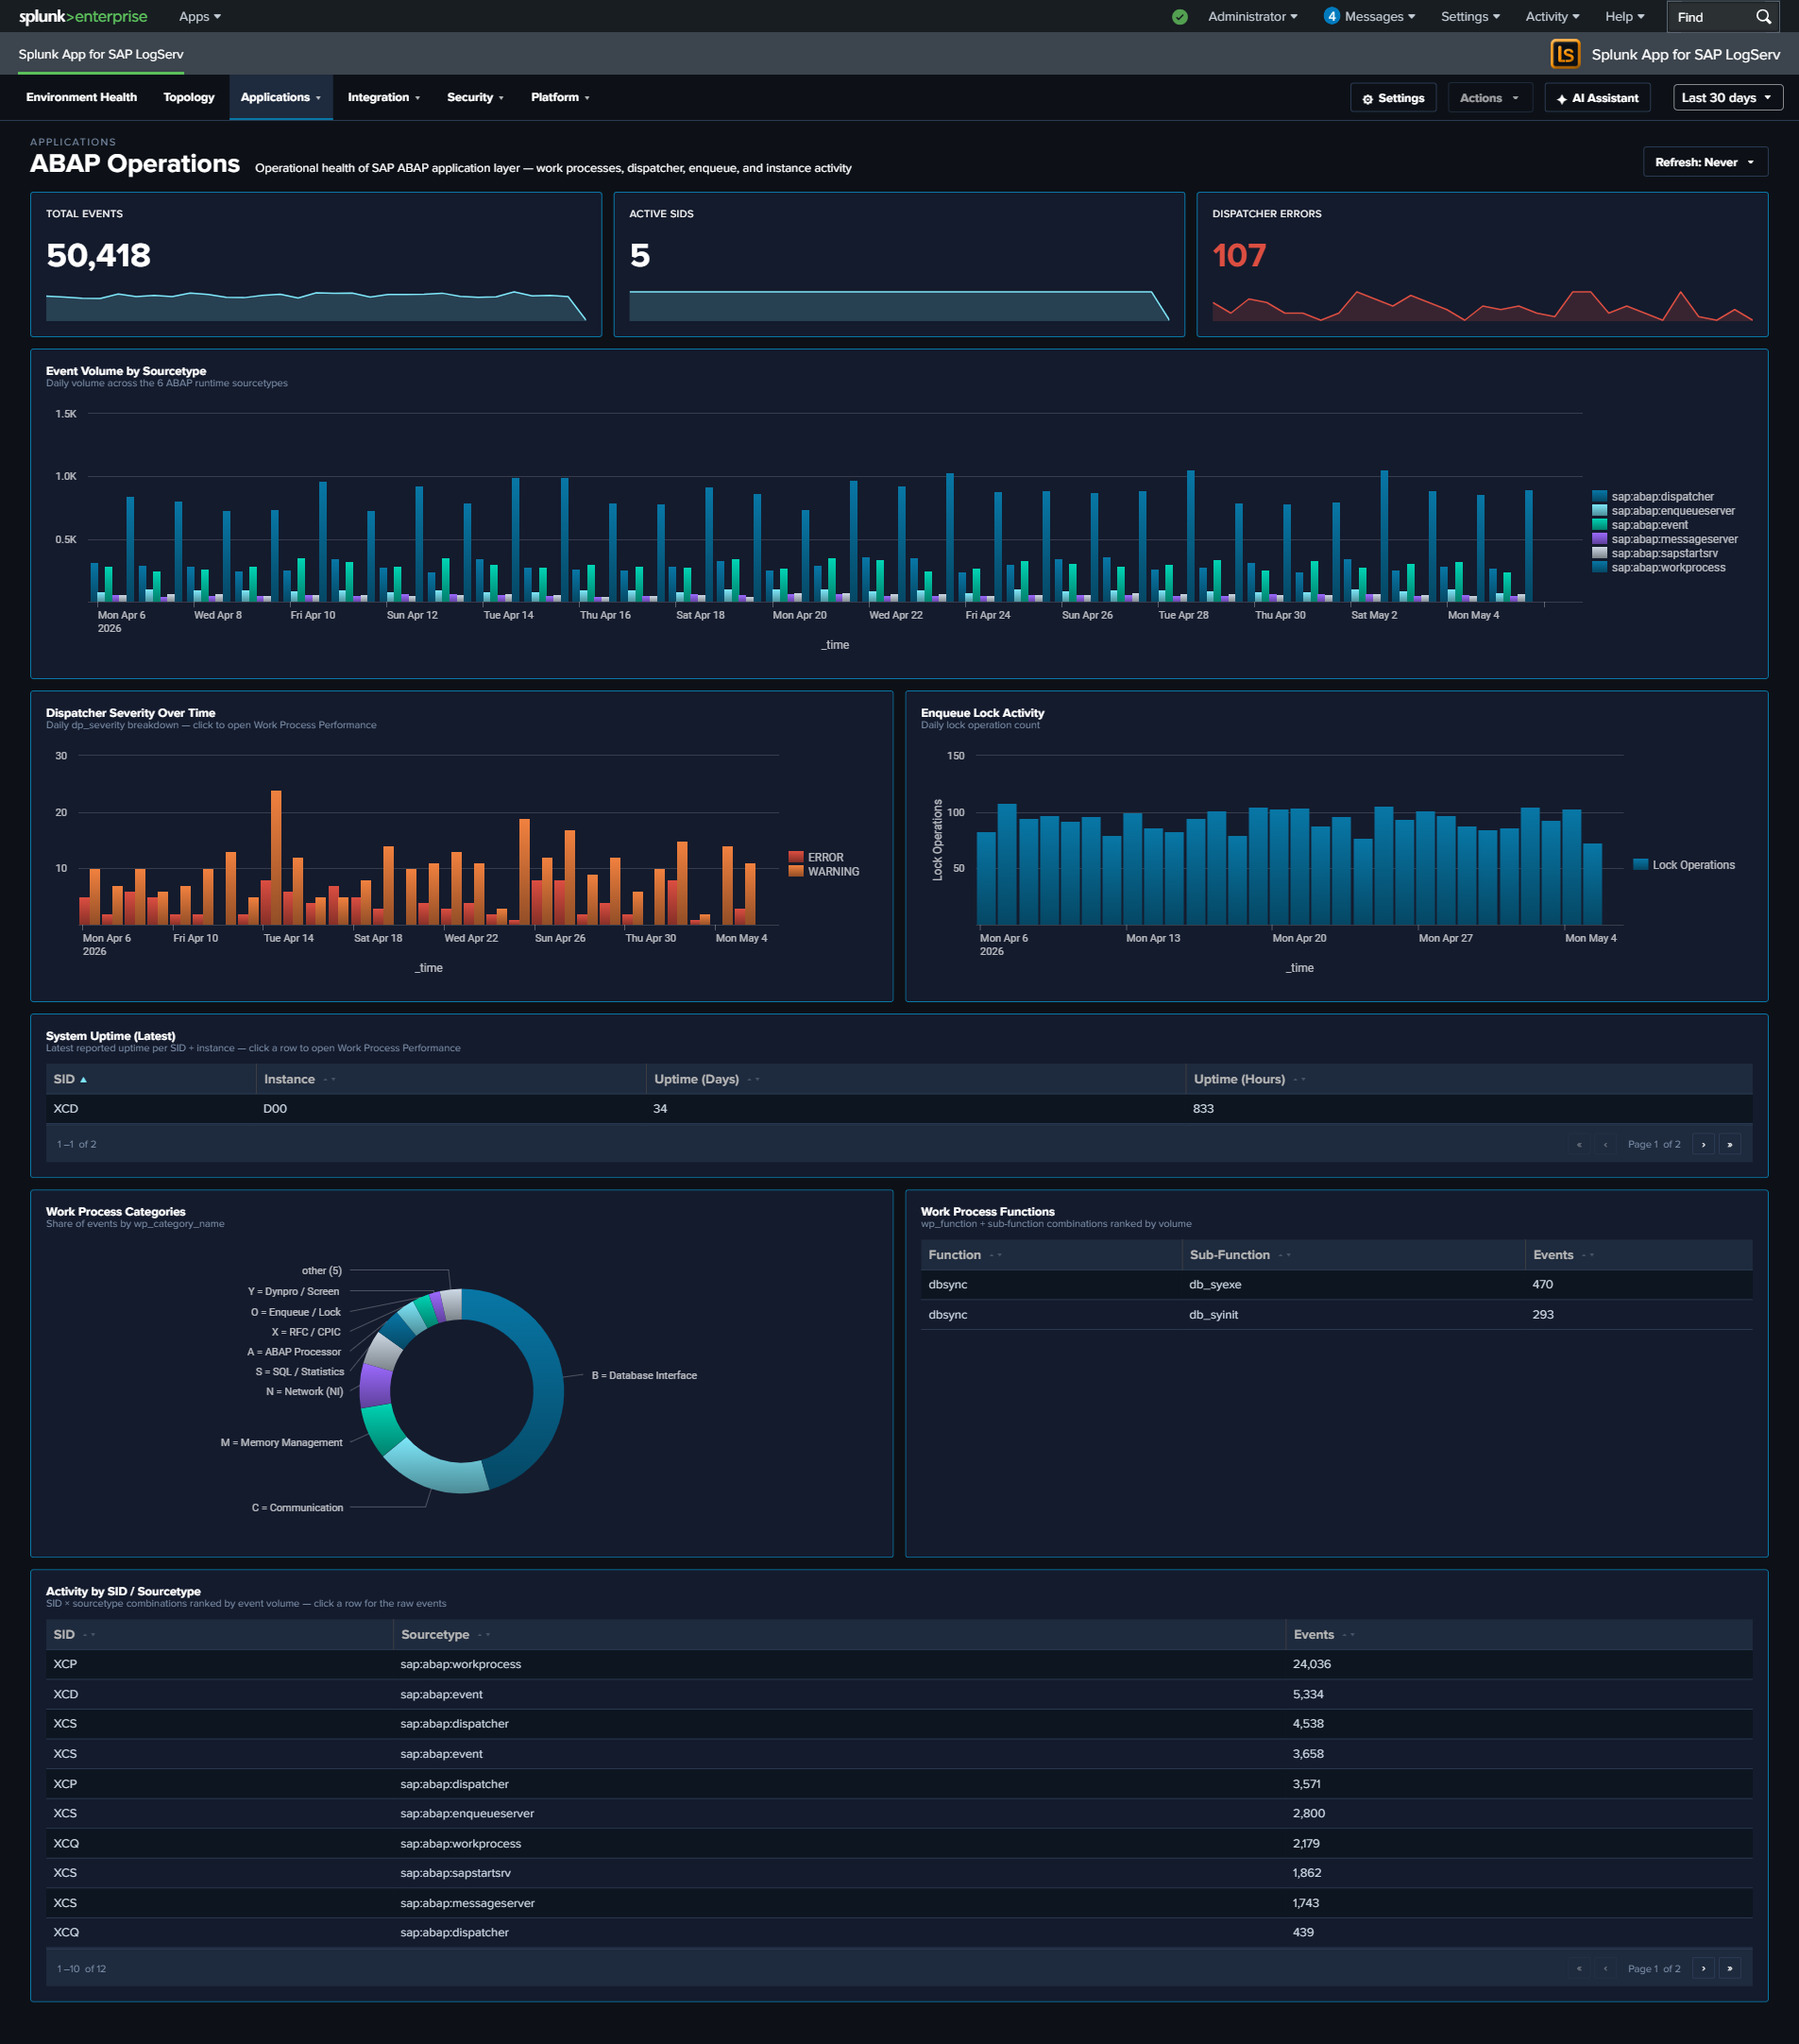
Work Process Performance¶
Why This Dashboard Matters¶
Work Process Performance focuses specifically on the ABAP work process layer: the finite pool of processes that execute every dialog request, background job, and RFC call. When work processes are exhausted, users see “no free work process” errors; when a specific category is saturated, symptoms manifest differently (e.g., database interface saturation causes SQL timeouts; memory category issues cause roll-area swaps). This dashboard breaks activity down by the 13 SAP-standard dev_w* trace component categories so you can target remediation to the right subsystem.
Panels¶
- Total WP Events – Aggregate event count from
sap:abap:workprocessandsap:abap:dispatcher - Active SIDs – Count of distinct SAP System IDs reporting work process data
- Dispatcher Errors – Count of dispatcher severity ERROR/FATAL events
- Active WP Functions – Count of distinct work process function codes observed
- Work Process Category Trend – Stacked column chart showing daily activity by category, with all 13 friendly-named codes (uses the shared
wp_category_namefield) - Category Distribution – Donut chart showing the overall category mix across the time range (same 13-code legend)
- Top Work Process Functions – Horizontal bar of the most-seen function codes (top 15)
- Dispatcher Severity Over Time – Stacked column of dispatcher severity levels over time
- Activity by SID / Instance – Table ranking each SAP system/instance by event count, with drilldown to filter
- Recent Dispatcher Errors – Table of the 25 most recent dispatcher ERROR/FATAL events with host and severity, with drilldown to the full event
What to Look For¶
- Category saturation – If a single category (e.g.,
B = Database InterfaceorM = Memory Management) dominates the Category Distribution donut when it historically didn’t, that subsystem may be a bottleneck. Check the associated detail dashboards (HANA Audit/Trace for database; Linux/ABAP Operations for memory). - Trend shifts between categories – A gradual increase in
N = Network (NI)orC = Communicationevents can indicate network degradation between the ABAP server and HANA/other SAP systems. - Dispatcher error bursts – Spikes in the Dispatcher Severity Over Time chart are often the first user-visible symptom of work process exhaustion. Correlate with Category Distribution to identify which category filled up first.
- Instance imbalance – If one instance’s WP activity is an order of magnitude higher than its peers in the Activity by SID/Instance table, investigate whether that instance is handling disproportionate load or experiencing a local issue.
- Function-code hotspots – The Top Work Process Functions bar surfaces which ABAP functions are running most often; an unexpected code at the top can indicate a runaway background job or custom transaction generating excessive traces.

HANA Audit¶
Why This Dashboard Matters¶
The HANA Audit dashboard is essential for database security compliance and threat detection. SAP HANA stores the most sensitive business data in the SAP landscape, and its audit trail captures every authentication attempt, privilege change, and administrative action. This dashboard transforms raw audit events into actionable security intelligence, supporting both real-time threat detection and compliance reporting.
Panels¶
- Total Audit Events – Aggregate count of HANA audit log entries
- Failed Operations – Count of audit events with non-successful status
- Active Users – Count of distinct users generating audit activity
- User Administration Activity Timeline – Tracks user administration actions (password resets, activations, deactivations) over time
- Daily Security Health Score – Stacked chart combining daily event volume, active users, failures, and success rate
- Audit Category Breakdown – Pie chart of audit event categories
- Security Events Timeline – Shows failed operations, object modifications, and permission grants
- Password Management Activities – Table of password-related audit events with user and IP details
- Failed Operations by Host – Pie chart identifying which hosts generate the most failures
- Top Users by Activity – Table ranking users by audit event count with failure counts
- Activity by Hour of Day – Column chart showing successes vs. failures by hour for after-hours detection
- Client IP Analysis – Table of connecting IPs with user counts, failures, and last-seen time
- Risk-Tiered Event Timeline – Stacked column chart of daily events grouped by
risk_level(critical / high / medium / low), so severe events never get hidden inside overall volume - After-Hours / Weekend Admin Activity – Table filtered to
is_admin_user=true AND (is_business_hours=false OR weekend), surfacing privileged activity outside normal windows; click a row to drill down by user - High-Risk Events – Full-width table filtered to
is_critical=trueshowing the recent top-50 critical audit events with user, client IP, status, action, object, and SQL statement; click a row to drill down by user
What to Look For¶
- Failed operations from unusual IPs – Authentication failures from IP addresses not in your expected range may indicate brute-force attacks or credential stuffing attempts.
- Critical events in the High-Risk Events table – Any non-empty row here warrants investigation. The SQL Statement column makes it straightforward to see whether a critical event was a privilege grant, a schema change, or a failed auth.
- After-hours privileged activity – The After-Hours / Weekend Admin Activity table surfaces admin operations outside business hours; correlate with change management records to separate planned maintenance from suspicious activity.
- Risk-tier shifts over time – A rising “critical” or “high” stack in the Risk-Tiered Event Timeline often precedes an incident. A sudden spike in “medium” may point to scripted workloads that need review.
- Privilege escalation patterns – Watch for sequences where a user’s privileges are modified followed by unusual data access patterns. The Security Events Timeline surfaces GRANT and REVOKE operations.
- Declining security health score – A downward trend in the daily success rate or an increase in failures signals growing security issues that need investigation.
- Password management anomalies – Bulk password resets or resets for service accounts should be correlated with change management records.
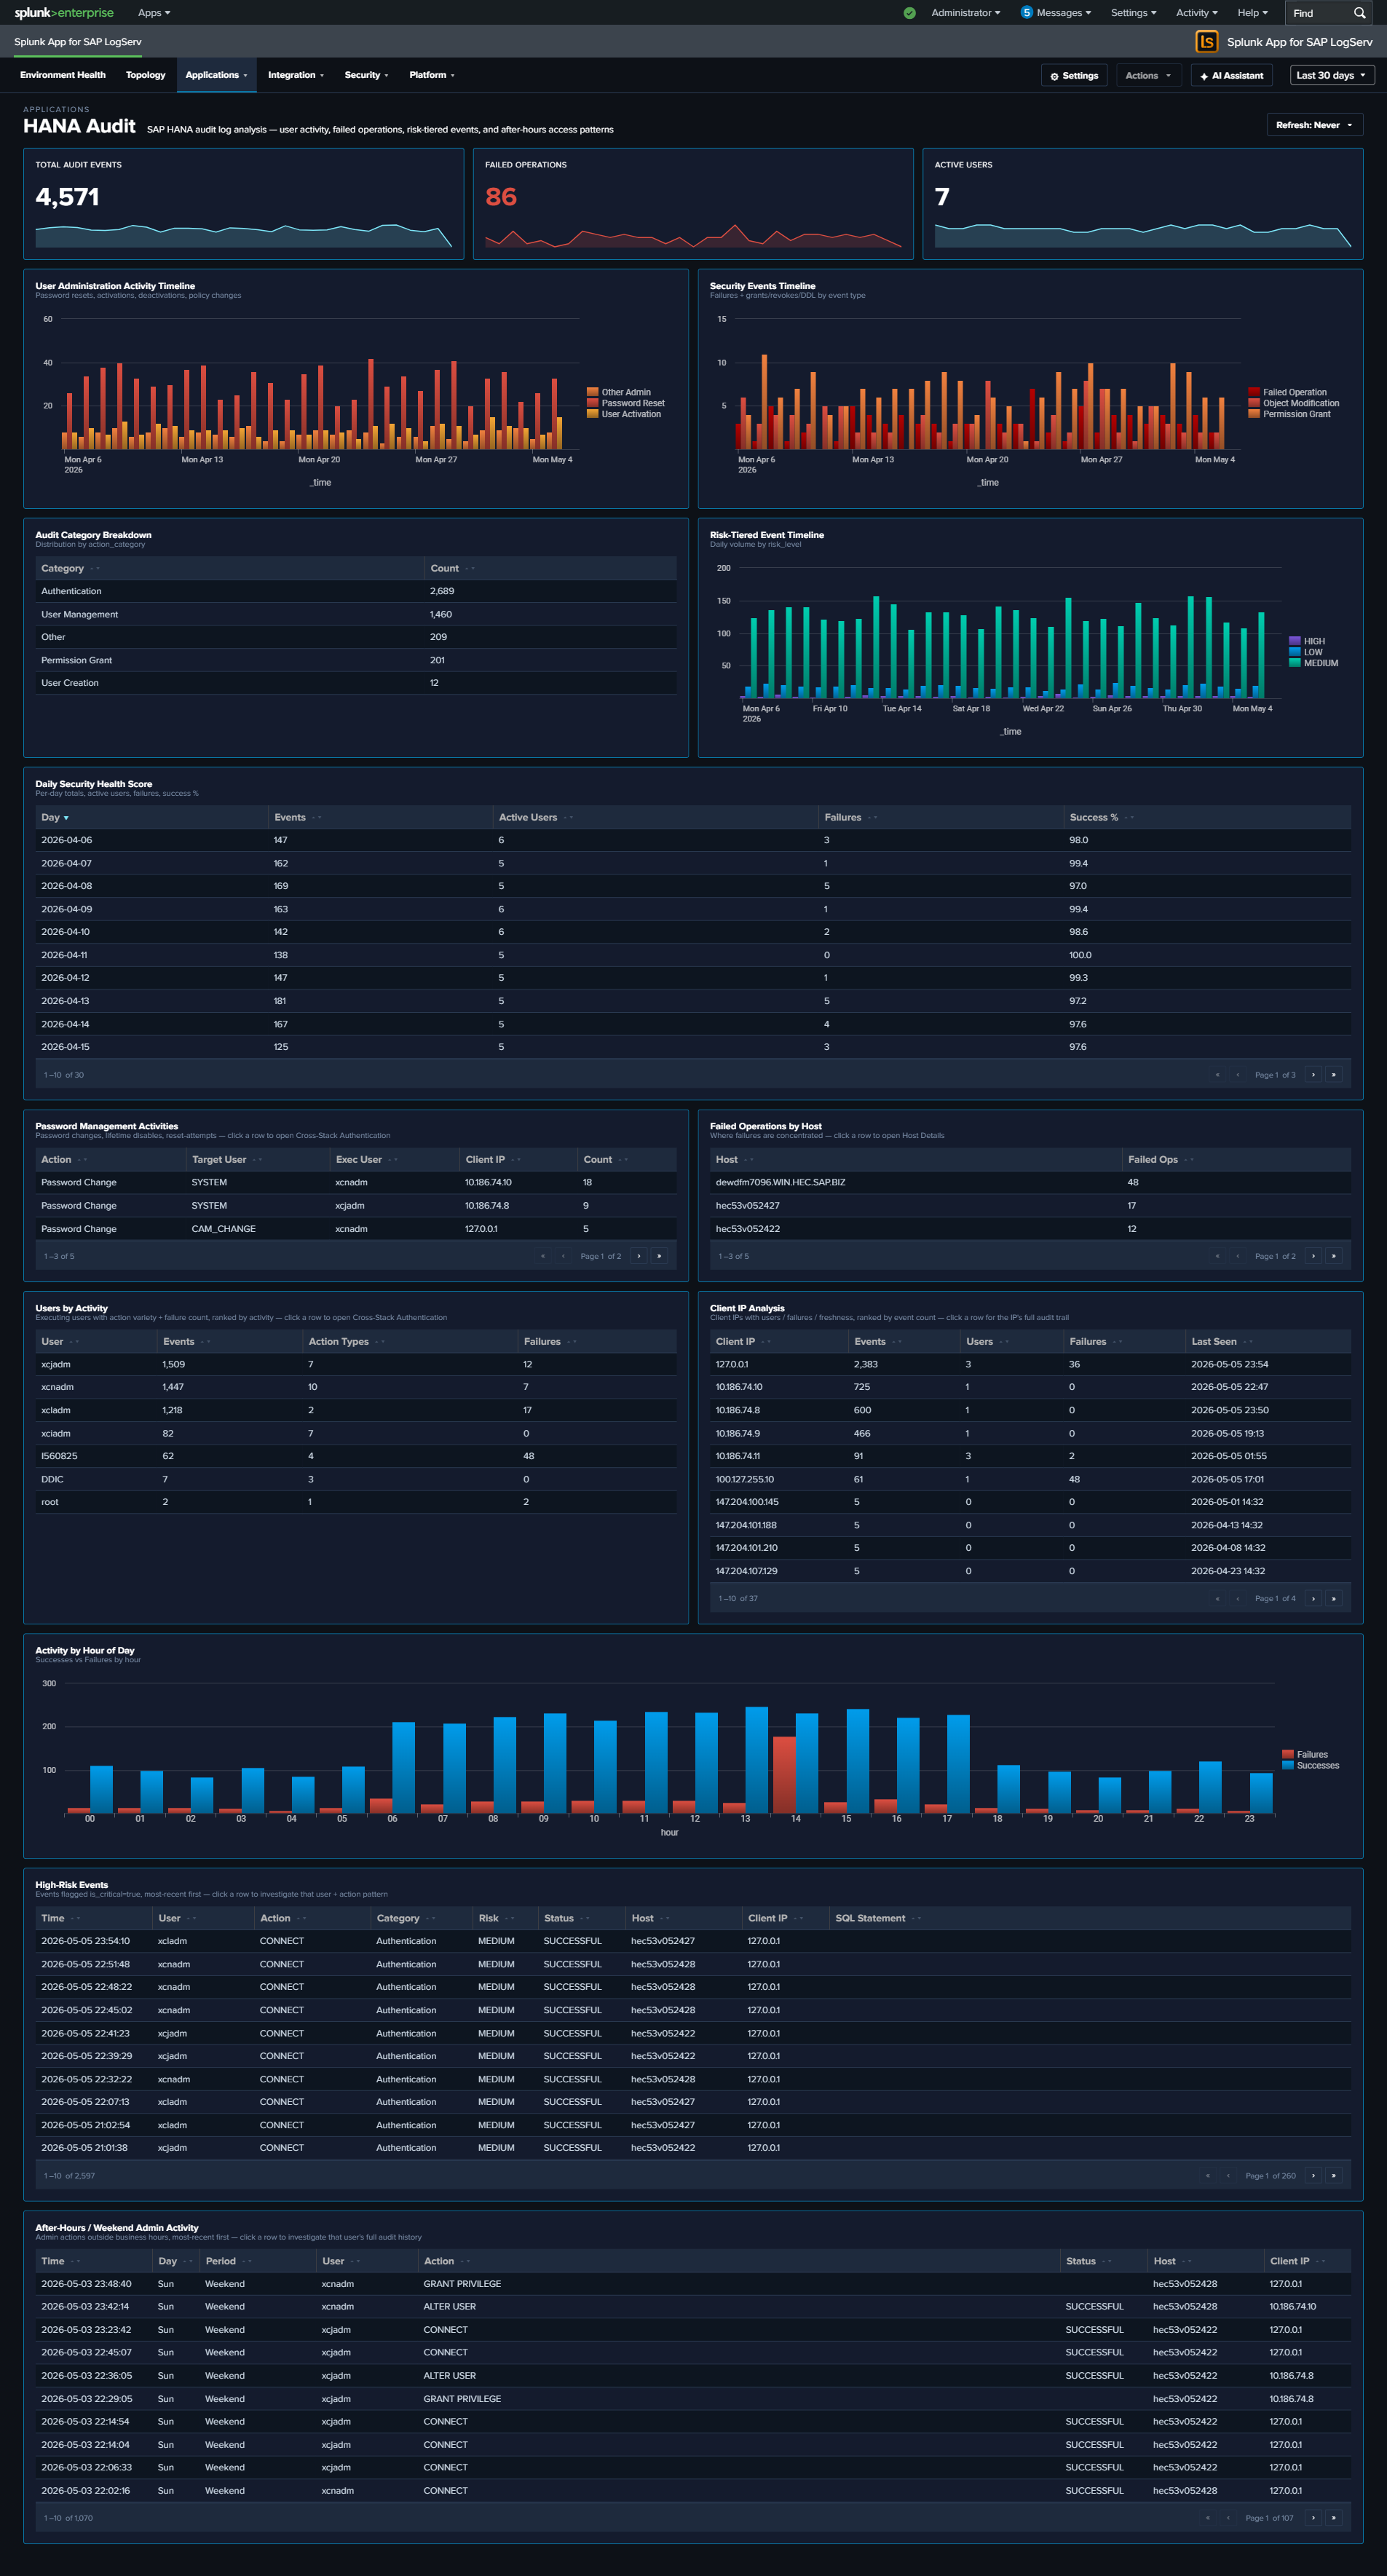
HANA Trace¶
Why This Dashboard Matters¶
The HANA Trace dashboard provides visibility into SAP HANA’s internal diagnostic trace system. Unlike audit logs that capture user actions, trace logs capture what the database engine itself is doing: memory management, query compilation, I/O operations, and internal errors. This is the primary tool for diagnosing HANA performance issues, stability problems, and understanding the root cause of database outages.
Panels¶
- Total Trace Events – Aggregate count of trace log entries (click to drill down)
- Errors / Fatal – Count of error and fatal severity events (click to drill down)
- Unique Components – Number of distinct HANA components generating traces (click to drill down)
- Trace Volume Over Time – Daily trend of total trace events
- Trace Events by Severity – Stacked column chart showing info, warning, error, and fatal distributions
- Top Components – Table of the most active HANA components with source file counts (excludes parsing-artifact values such as
INFO,of,service:so that real components dominate) - Component by Severity (Top 10) – Stacked column chart showing which components produce the most errors (same noise filter applied)
- Source File Hotspots – Table identifying specific source files generating the most trace entries (same noise filter applied)
- Activity by SID / Instance – Event distribution across HANA systems
- Slowest SQL Operations – Table of the top 20 SQL operations ranked by max duration (msec), with average duration and event count per operation. (Reads the hourly rollup layer; the per-event time/host columns are not retained at the aggregate grain – use a row’s drill-down for the underlying events.)
- Operation Duration (Avg / Max) – Daily average and peak HANA SQL operation duration (msec), across the events that carry the duration field.
- Recent Errors / Fatal Events – Table of the latest error and fatal trace events with component and source location
What to Look For¶
- Error/fatal severity spikes – A sudden increase in error-level traces often precedes a HANA outage or performance degradation. Investigate the component and source file generating the errors.
- Single component dominance – If one component suddenly generates significantly more traces than usual, it may indicate a runaway process, memory leak, or infinite loop within that subsystem.
- New source files appearing – Trace entries from source files not seen before may indicate recently applied patches or code changes that are generating unexpected behavior.
- SID/instance imbalance – Uneven trace volumes across instances of the same HANA system may indicate hardware issues, unbalanced workload distribution, or replication problems.
- Persistent warning trends – Warnings that gradually increase over days often signal resource exhaustion (disk space, memory pools) that will eventually escalate to errors.
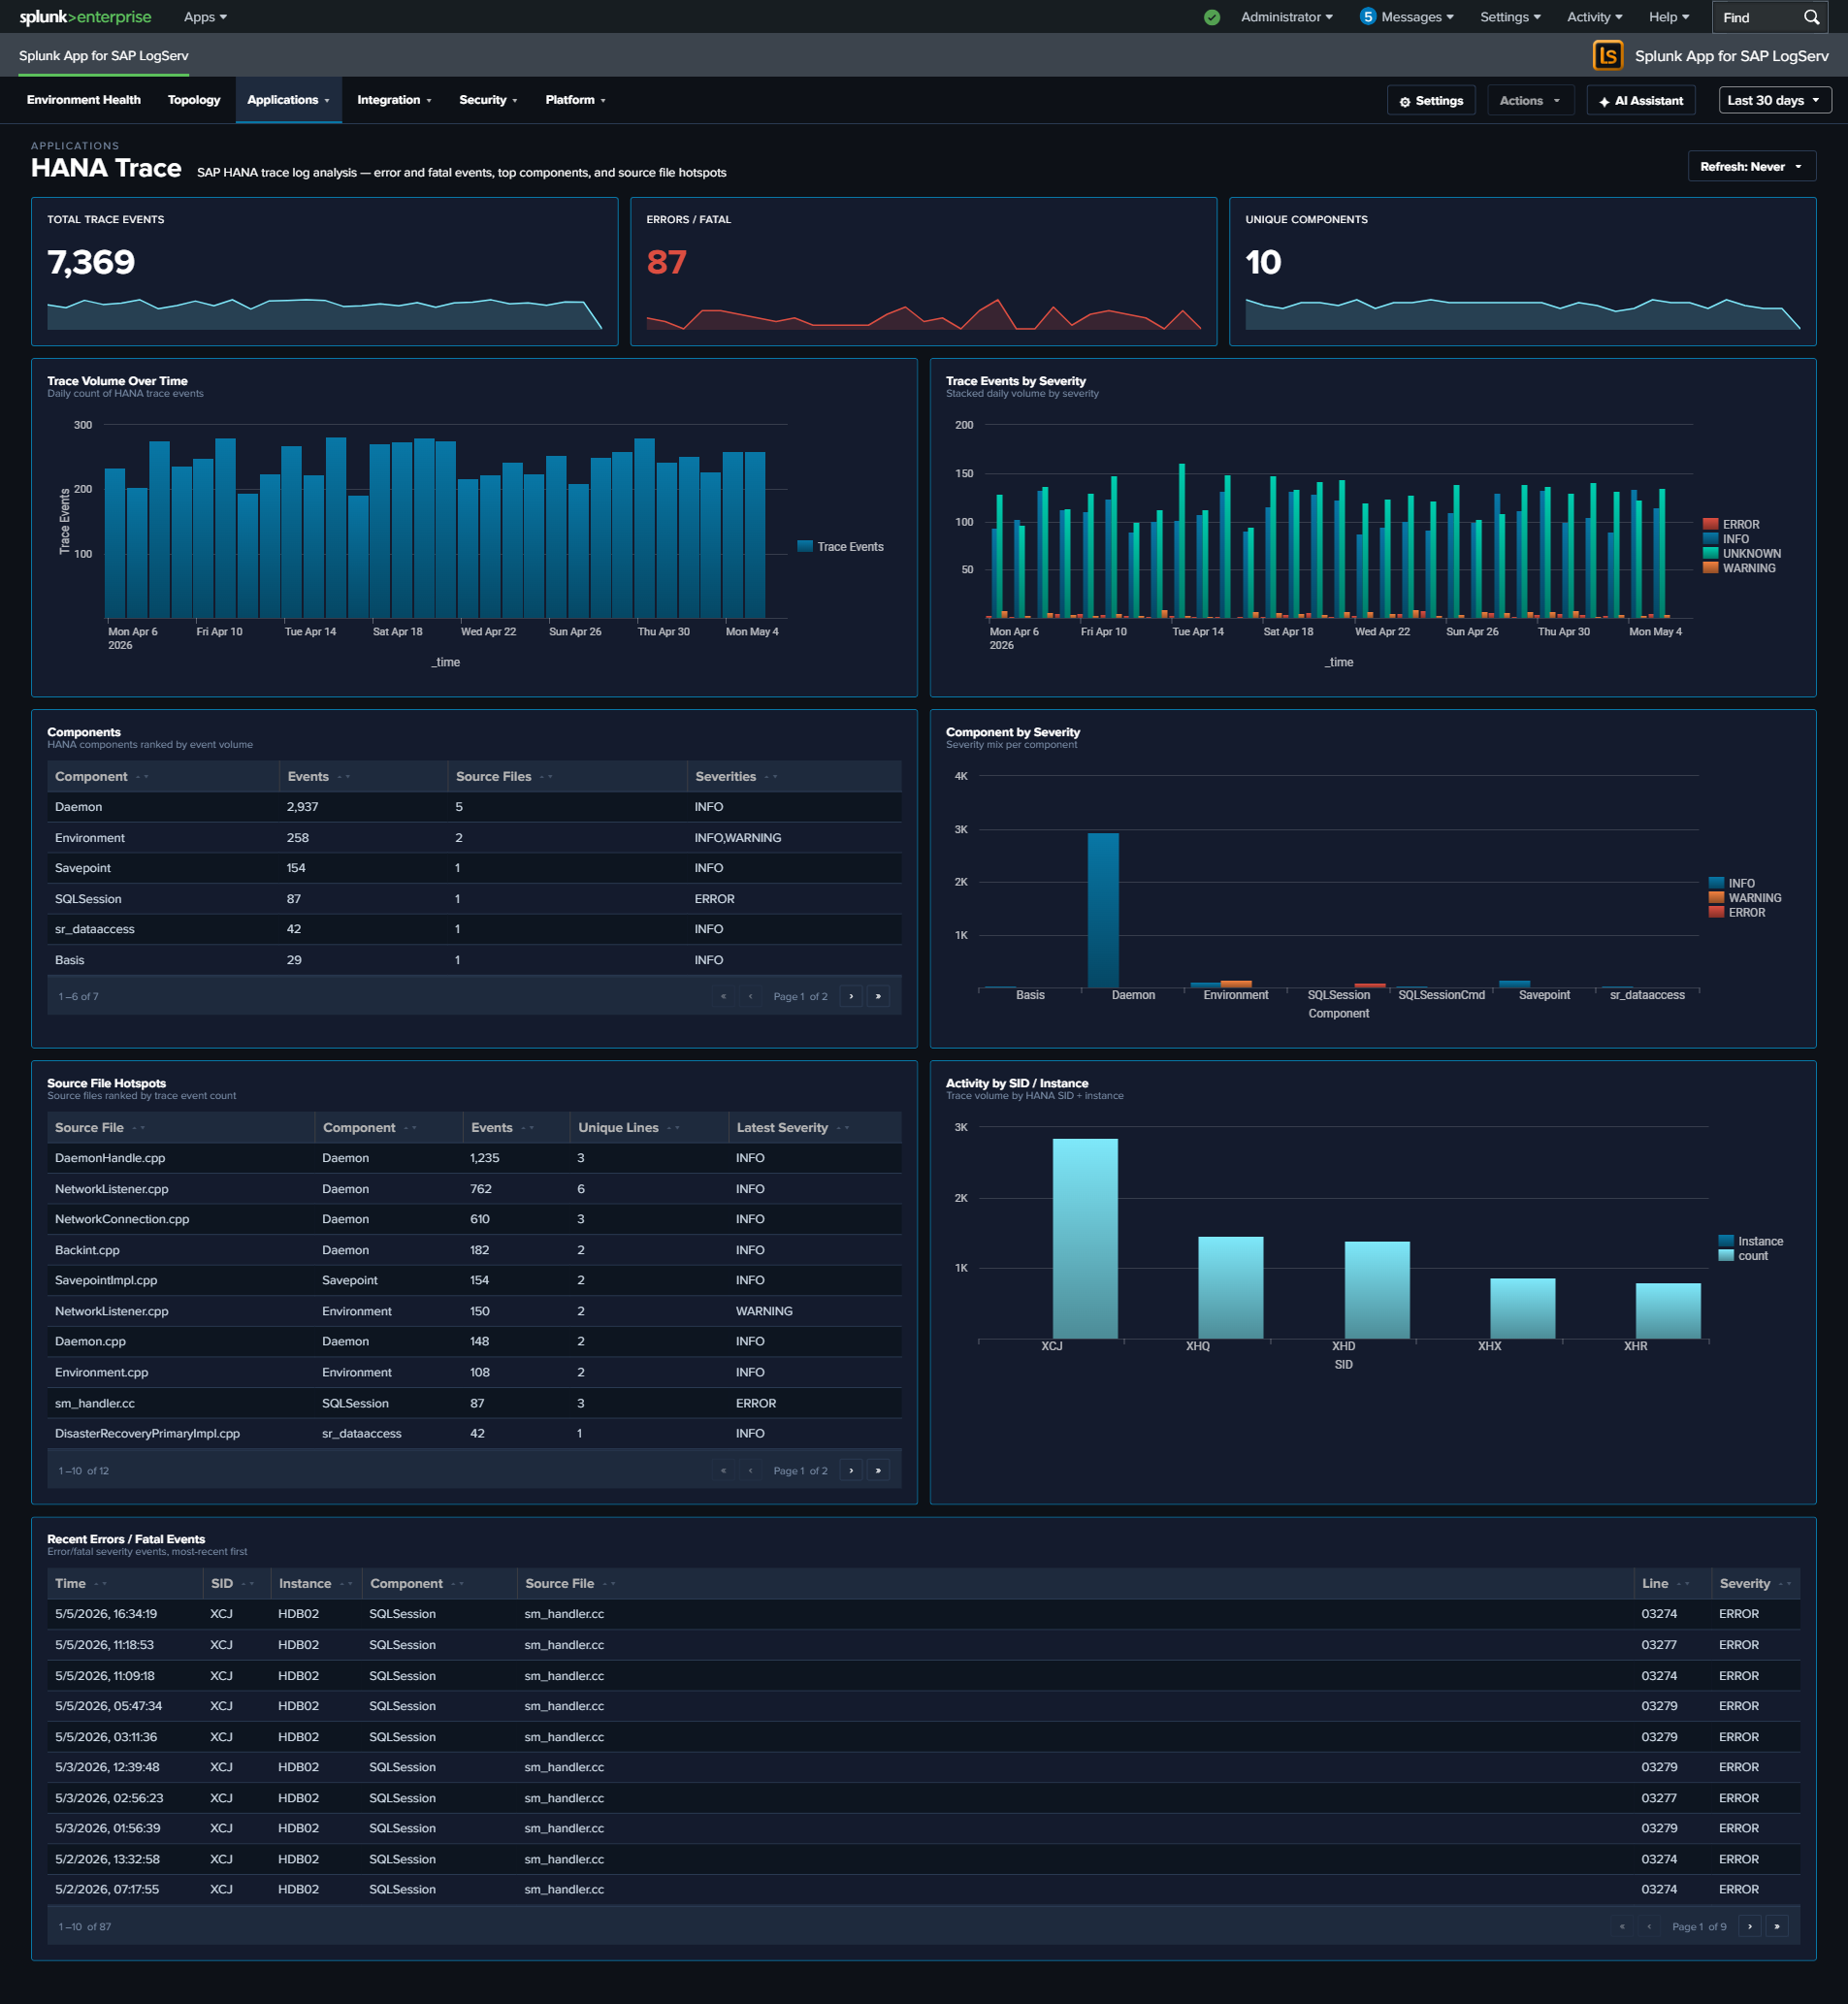
Ended: Applications
Integration ↵
Integration¶
The Integration category covers dashboards that monitor how SAP connects to other systems — host-level services (sapstartsrv, saphostexec), the SAP Router, the Cloud Connector (SAP BTP tunnel), and HTTP traffic through the Web Dispatcher. Use these dashboards to diagnose connectivity issues, auth failures at the integration boundary, and performance problems in the request path.
React refinements (apply to every dashboard in this category)
Every panel, KPI card, chart, and table row is clickable and opens its drill-down destination in a new browser tab with the source dashboard’s currently-selected time range pre-applied via ?earliest=...&latest=.... The destination’s TimeRangeProvider parses the URL on mount and hydrates its initial range. Every dashboard’s title-row toolbar carries a per-dashboard Refresh picker (Never / 30s / 1m / 5m / 15m / 30m / 1hr) with per-user-per-dashboard cadence persisted via Splunk KV Store, plus a Download PNG button (full-canvas capture via html2canvas).
| Dashboard | Purpose | Key Data Sources |
|---|---|---|
| SAP Services | sapstartsrv authentication, SSL/TLS failure analysis, and host agent health | sap:sapstartsrv, sap:saphostexec |
| SAP Router | SAP Router connection activity, error analysis, and network boundary monitoring | sap:saprouter |
| Cloud Connector | SAP Cloud Connector HTTP traffic, audit events, and access denied events | sap:scc:audit, sap:scc:http_access |
| Web Dispatcher | HTTP traffic analysis, response times, status codes, and client patterns | sap:webdispatcher:access |
| Web and API Performance | Four-stage request timing, response-time Avg/Max trends, TLS posture, cross-source error correlation | sap:webdispatcher:access, sap:scc:http_access |
SAP Services¶
Why This Dashboard Matters¶
The SAP Services dashboard monitors two host-level services that are critical to SAP system availability: sapstartsrv (system startup and management) and the SAP Host Agent (host monitoring and management). These services operate at the infrastructure layer, below the application, and their failures can prevent SAP systems from starting or being managed remotely. The authentication story is front-and-center here – sapstartsrv is a common brute-force target, so the dashboard features an SSL-authentication failure panel as the main investigation surface. (SAP Router activity lives on its own SAP Router dashboard.)
Panels¶
- Total Events – Aggregate event count across sapstartsrv and saphostexec
- Auth Failures – Count of sapstartsrv authentication failures
- SSL/TLS Events – Count of events involving SSL/TLS negotiation
- Event Volume by Service (Normal vs Errors) – Full-width stacked column chart with four semantic series: sapstartsrv (normal), sapstartsrv (errors), saphostexec (normal), saphostexec (errors). Errors are defined per service: sapstartsrv = failed authentication events; saphostexec = severity ERROR/WARNING.
- SSL Authentication Failure Sources – Full-width featured table aggregating SSL/TLS auth failures by source IP, with failure count, distinct user count, user list, first/last seen, and activity span (hours). Top 50 sources, row drilldown to the full event set for that IP.
- Sapstartsrv Authentication Events – Table of authentication attempts showing user, IP, method, and result
- Host Agent Severity – Pie chart of SAP Host Agent log severity distribution
What to Look For¶
- Auth failure sources – The SSL Authentication Failure Sources table is the primary investigation surface. A single source IP with many distinct usernames is credential stuffing; many sources with a few usernames each is distributed brute-force; long activity spans indicate a persistent (not opportunistic) attacker.
- Authentication failures from new IPs – Any new source IP appearing in the SSL Authentication Failure Sources table should be cross-referenced with your expected SAP admin network. Production sapstartsrv should rarely see failed authentications from unfamiliar ranges.
- Error stack rising in the volume chart – If the error series (red) in the Event Volume chart grows relative to normal (blue/teal) series, something is actively going wrong. Correlate the spike timing with the host agent severity pie to determine which service is affected.
- Host Agent ERROR severity – If the Host Agent severity distribution shifts toward ERROR, the host monitoring infrastructure may be degrading, which impacts central management capabilities.
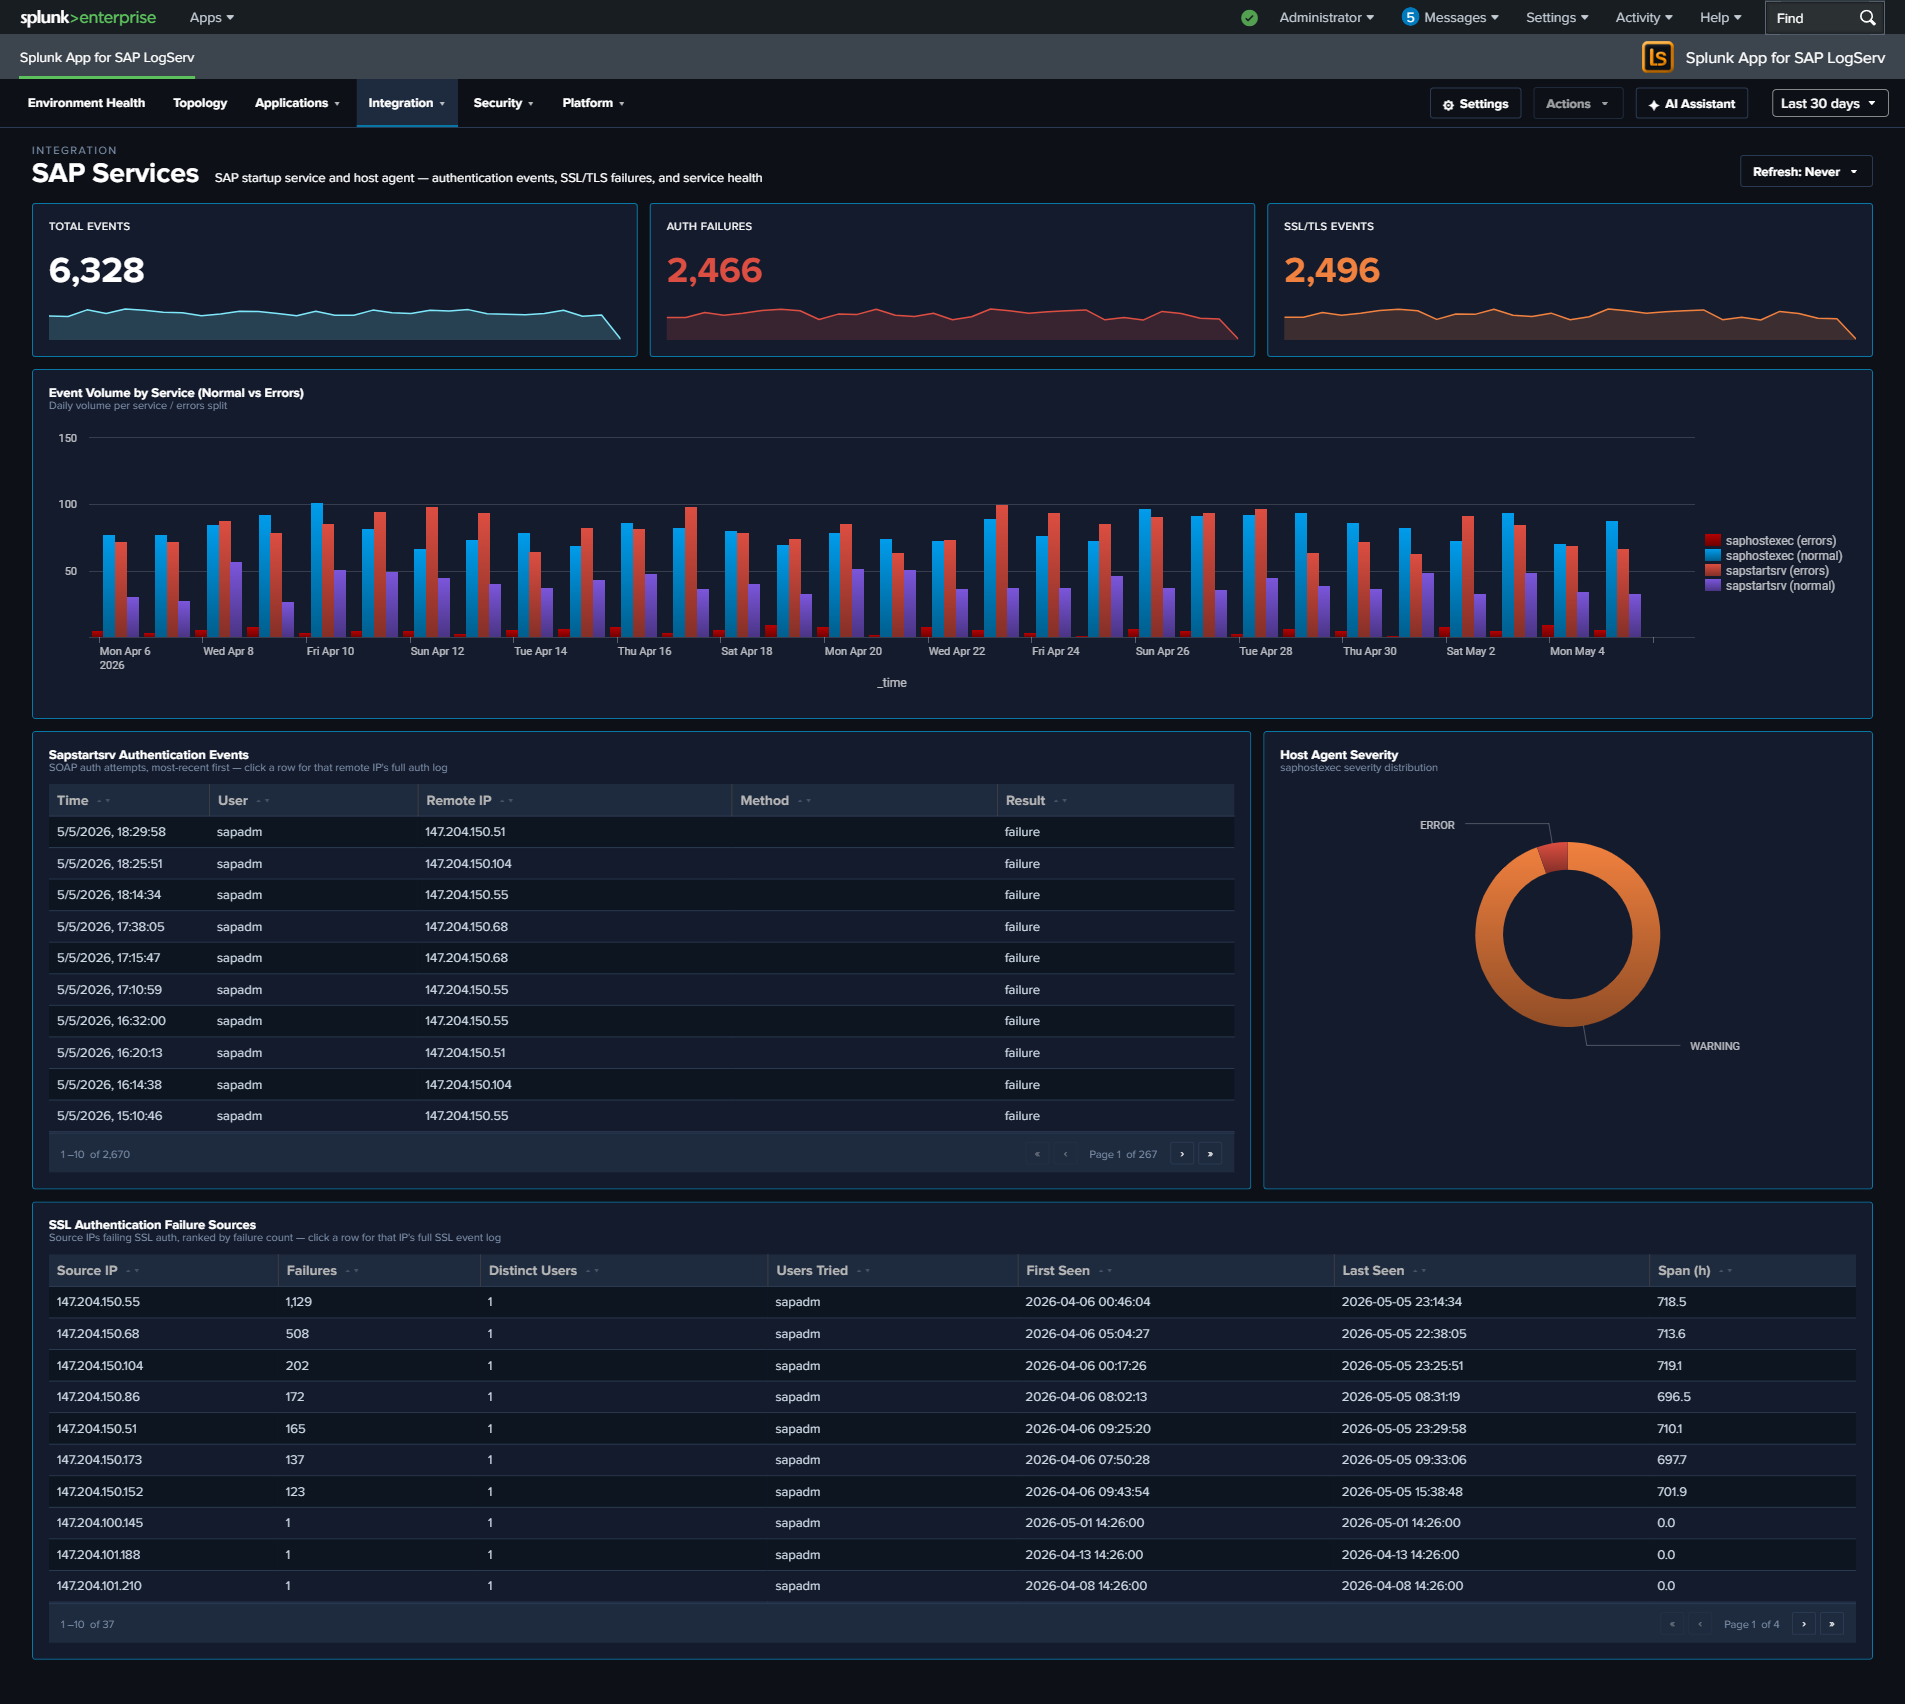
SAP Router¶
Why This Dashboard Matters¶
SAP Router is the network gateway that sits between SAP systems and external networks, forwarding RFC and HTTP traffic across trust boundaries. Because it is exposed to the network, its logs are a primary audit trail for cross-boundary SAP traffic: every connection attempt, protocol error, and invalid-data event gets recorded. This dashboard separates the SAP Router signal from other services so that spikes in router errors (connectivity breakage, misconfigured routetab, or attempted protocol abuse) are visible on their own.
Panels¶
- Total Router Events – Aggregate SAP Router event count
- Router Errors – Count of router error events (click to drill down)
- Invalid Data Events – Count of events where the router received malformed or unexpected protocol data – often indicates a misconfigured client or probing
- Unique Peer IPs – Distinct count of peer IPs seen in the time window
- Connection Actions Over Time – Stacked column chart of CONNECT, DISCONNECT, and error actions daily
- Router Errors Over Time – Daily trend of router error events (area chart)
- Top Peer IPs by Connection Volume – Horizontal bar chart of the most active peer IPs (top 15)
- Return Code Distribution – Pie chart showing the distribution of router return codes (NiBuf, NiI, NiL, etc.) over the time range
- Error Detail by Function – Table of the top 5 router error functions with return code, count, and sample peer detail; row drilldown
- Recent Connection Log – Table of the 25 most recent CONNECT / DISCONNECT entries with peer IP, action, and return code; row drilldown
What to Look For¶
- Invalid Data spikes – A sudden increase in the Invalid Data KPI suggests either a misconfigured client speaking a wrong protocol or a port scan / probe. Check the Top Peer IPs by Connection Volume for new entries.
- Unfamiliar peers in the top-IPs bar – Known SAP-to-SAP traffic should come from a predictable IP set; new IPs in the top bar warrant investigation, especially if they generate high connection volume or show up only in the Error Detail by Function table.
- Return code imbalance – The Return Code Distribution pie should be dominated by normal-case codes. A sudden growth of
NIECONN_REFUSEDorNIEHOST_UNKNOWNslices usually means a downstream SAP system is down or a routetab entry is wrong. - Rising error trend – An upward slope in Router Errors Over Time can precede an outage. Cross-reference with ABAP Operations (dispatcher errors) and Cloud Connector (for hybrid flows) to see whether the root cause is local to the router or broader.
- Concentrated errors by function – If one row of the Error Detail by Function table accumulates most errors, that function is the specific RFC/HTTP path where the problem lives – a much narrower investigation scope than “the router is broken”.
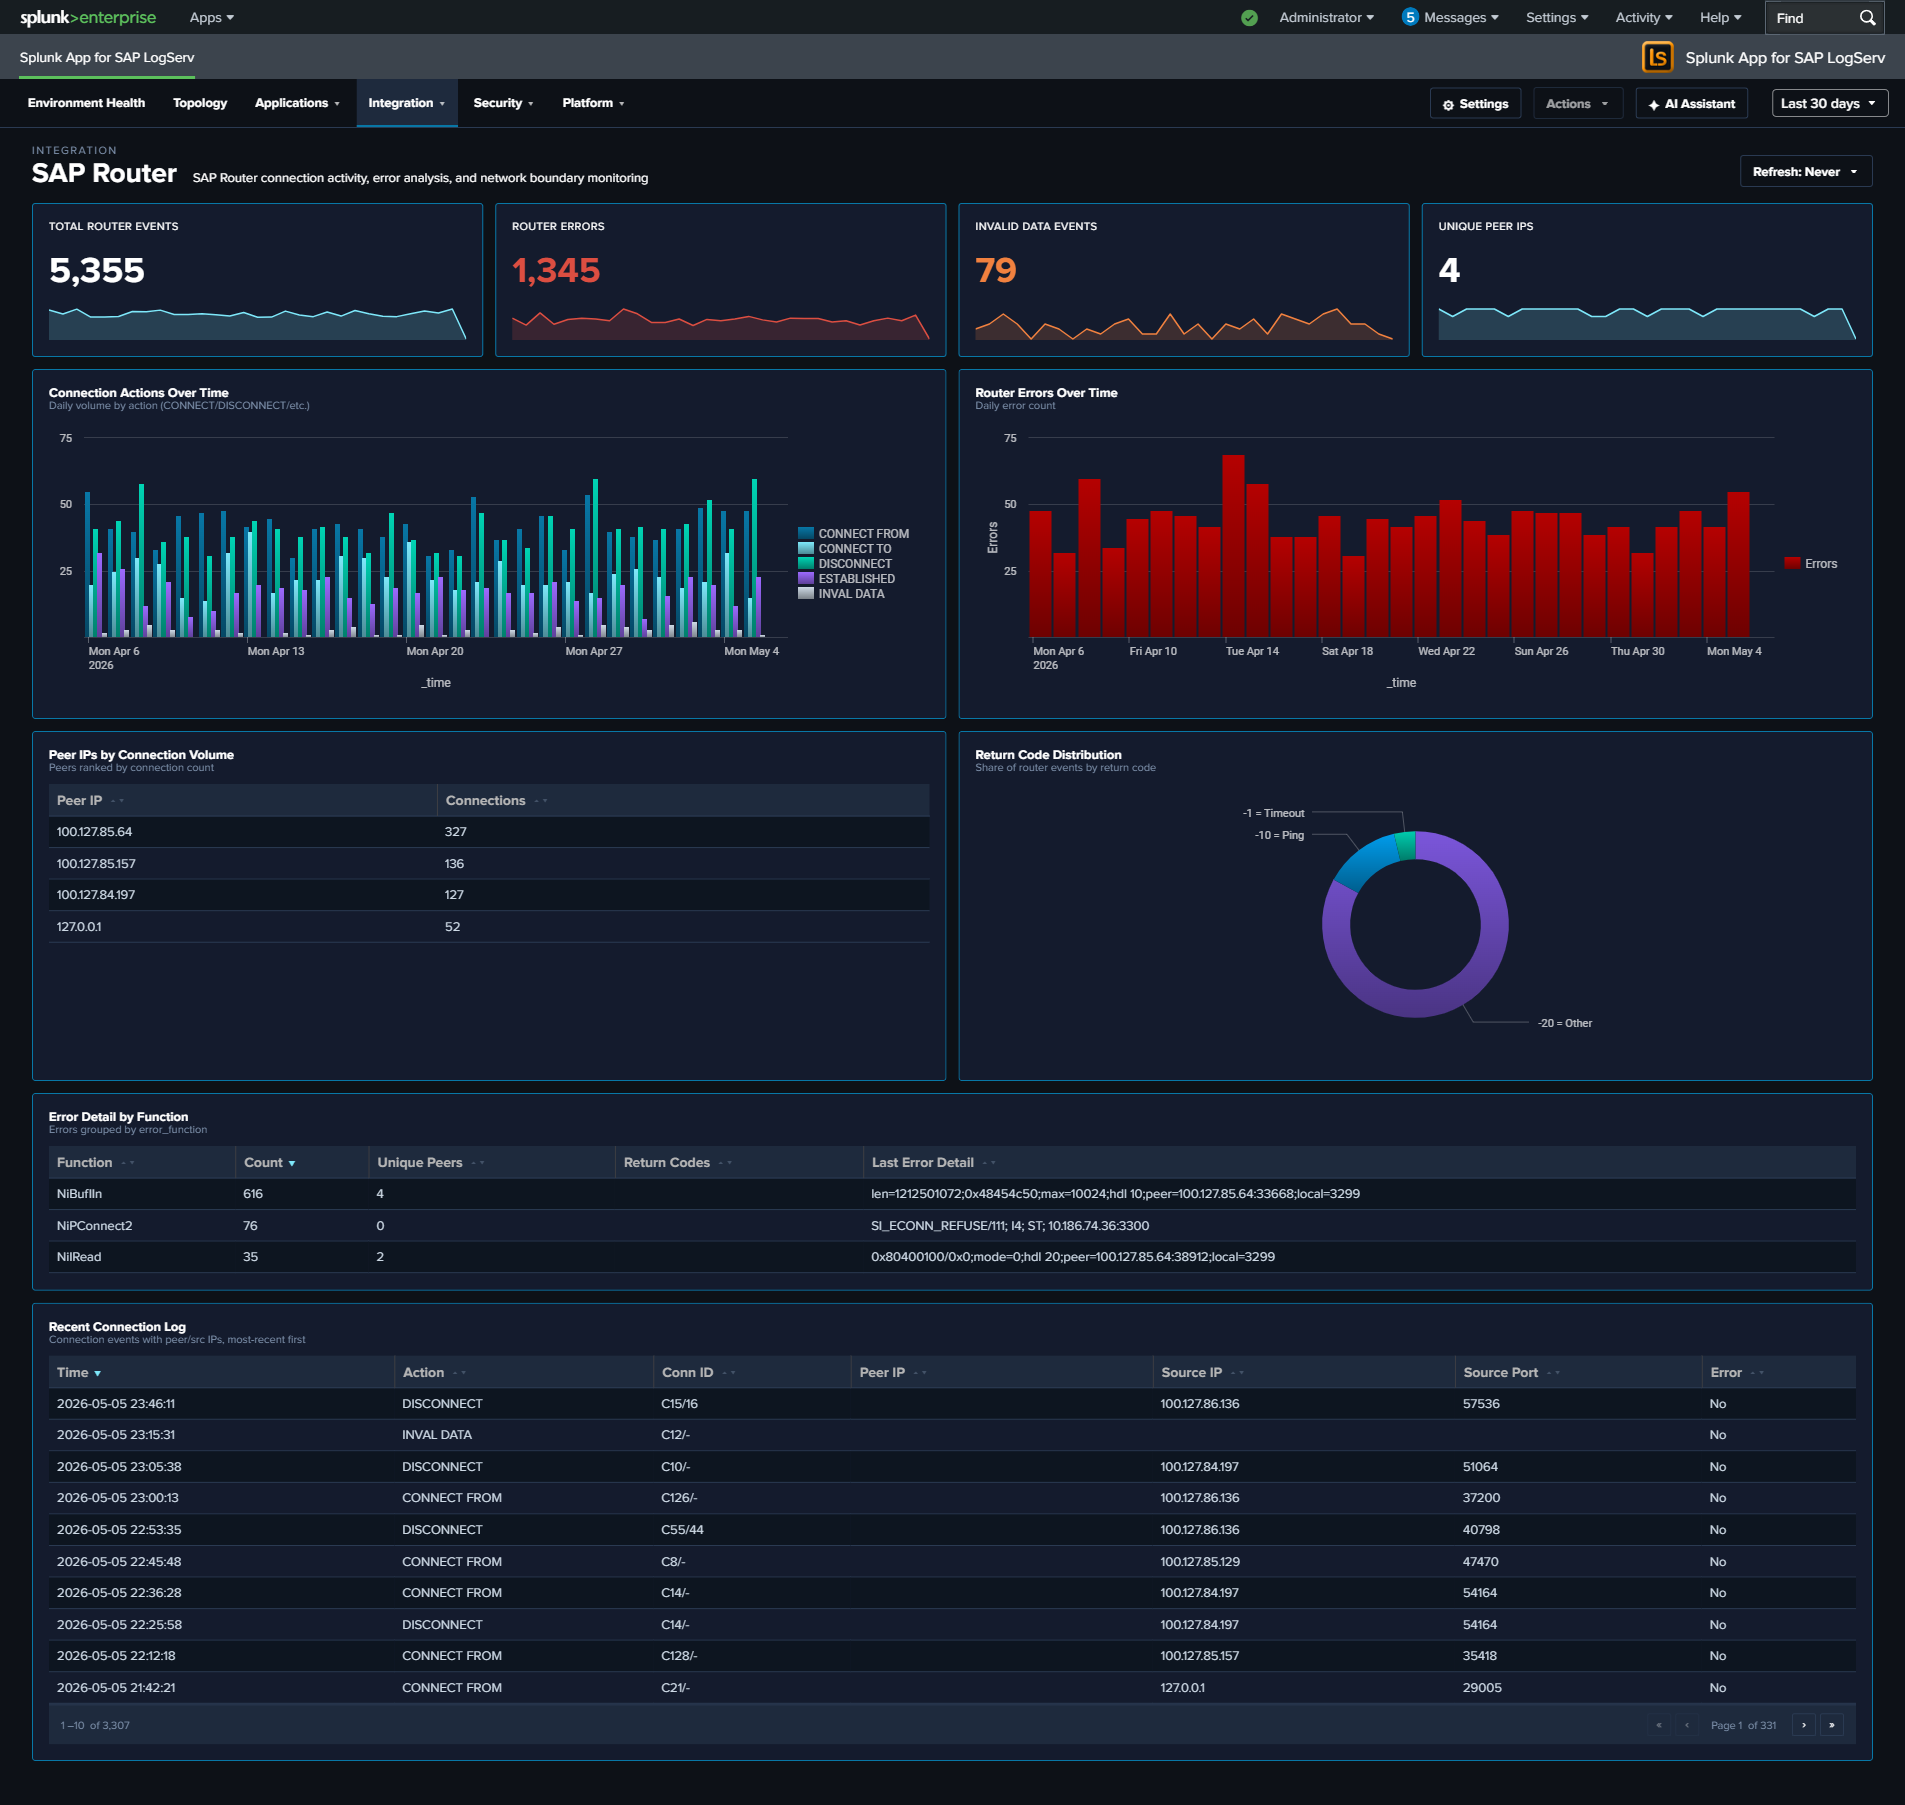
Cloud Connector¶
Why This Dashboard Matters¶
The Cloud Connector dashboard monitors SAP Cloud Connector (SCC), which provides secure tunneled connectivity between on-premise SAP systems and SAP BTP (Business Technology Platform) cloud services. As the bridge between on-premise and cloud, the Cloud Connector’s health directly impacts hybrid integration scenarios, Fiori apps, and cloud-based analytics that depend on on-premise data access.
Panels¶
- Total Requests – Count of HTTP requests processed by the Cloud Connector
- HTTP Error Rate – Percentage of HTTP requests returning 4xx or 5xx status codes (scoped name clarifies that this is HTTP-only, not audit-log errors)
- Audit Events – Count of Cloud Connector audit log entries
- Access Denied Events – Count of
sap:scc:auditentries withscc_audit_type="ACCESS_DENIED"(click to drill down to the matching events) - Request Volume Over Time – Daily HTTP request trend
- Status Code Distribution – Stacked column chart of 2xx, 3xx, 4xx, and 5xx responses
- Top URIs by Request Count – Table of the most requested URIs with average response time and total bytes
- Average Response Time – Line chart trending response time over time
- HTTP Methods – Pie chart breakdown of request methods
- Top Clients – Table of the most active client IPs with request counts and unique URI counts
- Cloud Connector Audit Log – Table of recent audit events with type and account details
What to Look For¶
- HTTP Error Rate increases – A rising error rate indicates connectivity issues between on-premise systems and the cloud. Check the Status Code Distribution for whether errors are client-side (4xx) or server-side (5xx).
- Access Denied events – A non-zero Access Denied KPI means the BTP side actively rejected a request – either a misconfigured subaccount binding, an expired certificate, or an unauthorized access attempt. Click the KPI to see which accounts/URIs are being denied.
- Response time degradation – Gradually increasing response times suggest bandwidth constraints, backend system slowdowns, or Cloud Connector resource exhaustion. Sudden spikes may indicate outages.
- Unusual URIs – Requests to unexpected URI paths in the Top URIs table may indicate scanning or misconfigured cloud applications attempting to access unauthorized resources.
- Audit events indicating config changes – Cloud Connector audit entries for configuration modifications should correlate with approved change windows. Unexpected changes may indicate unauthorized access.
- New client IPs – The Cloud Connector should only receive traffic from expected BTP subaccounts. New client IPs may indicate unauthorized access attempts or misconfigured routing.
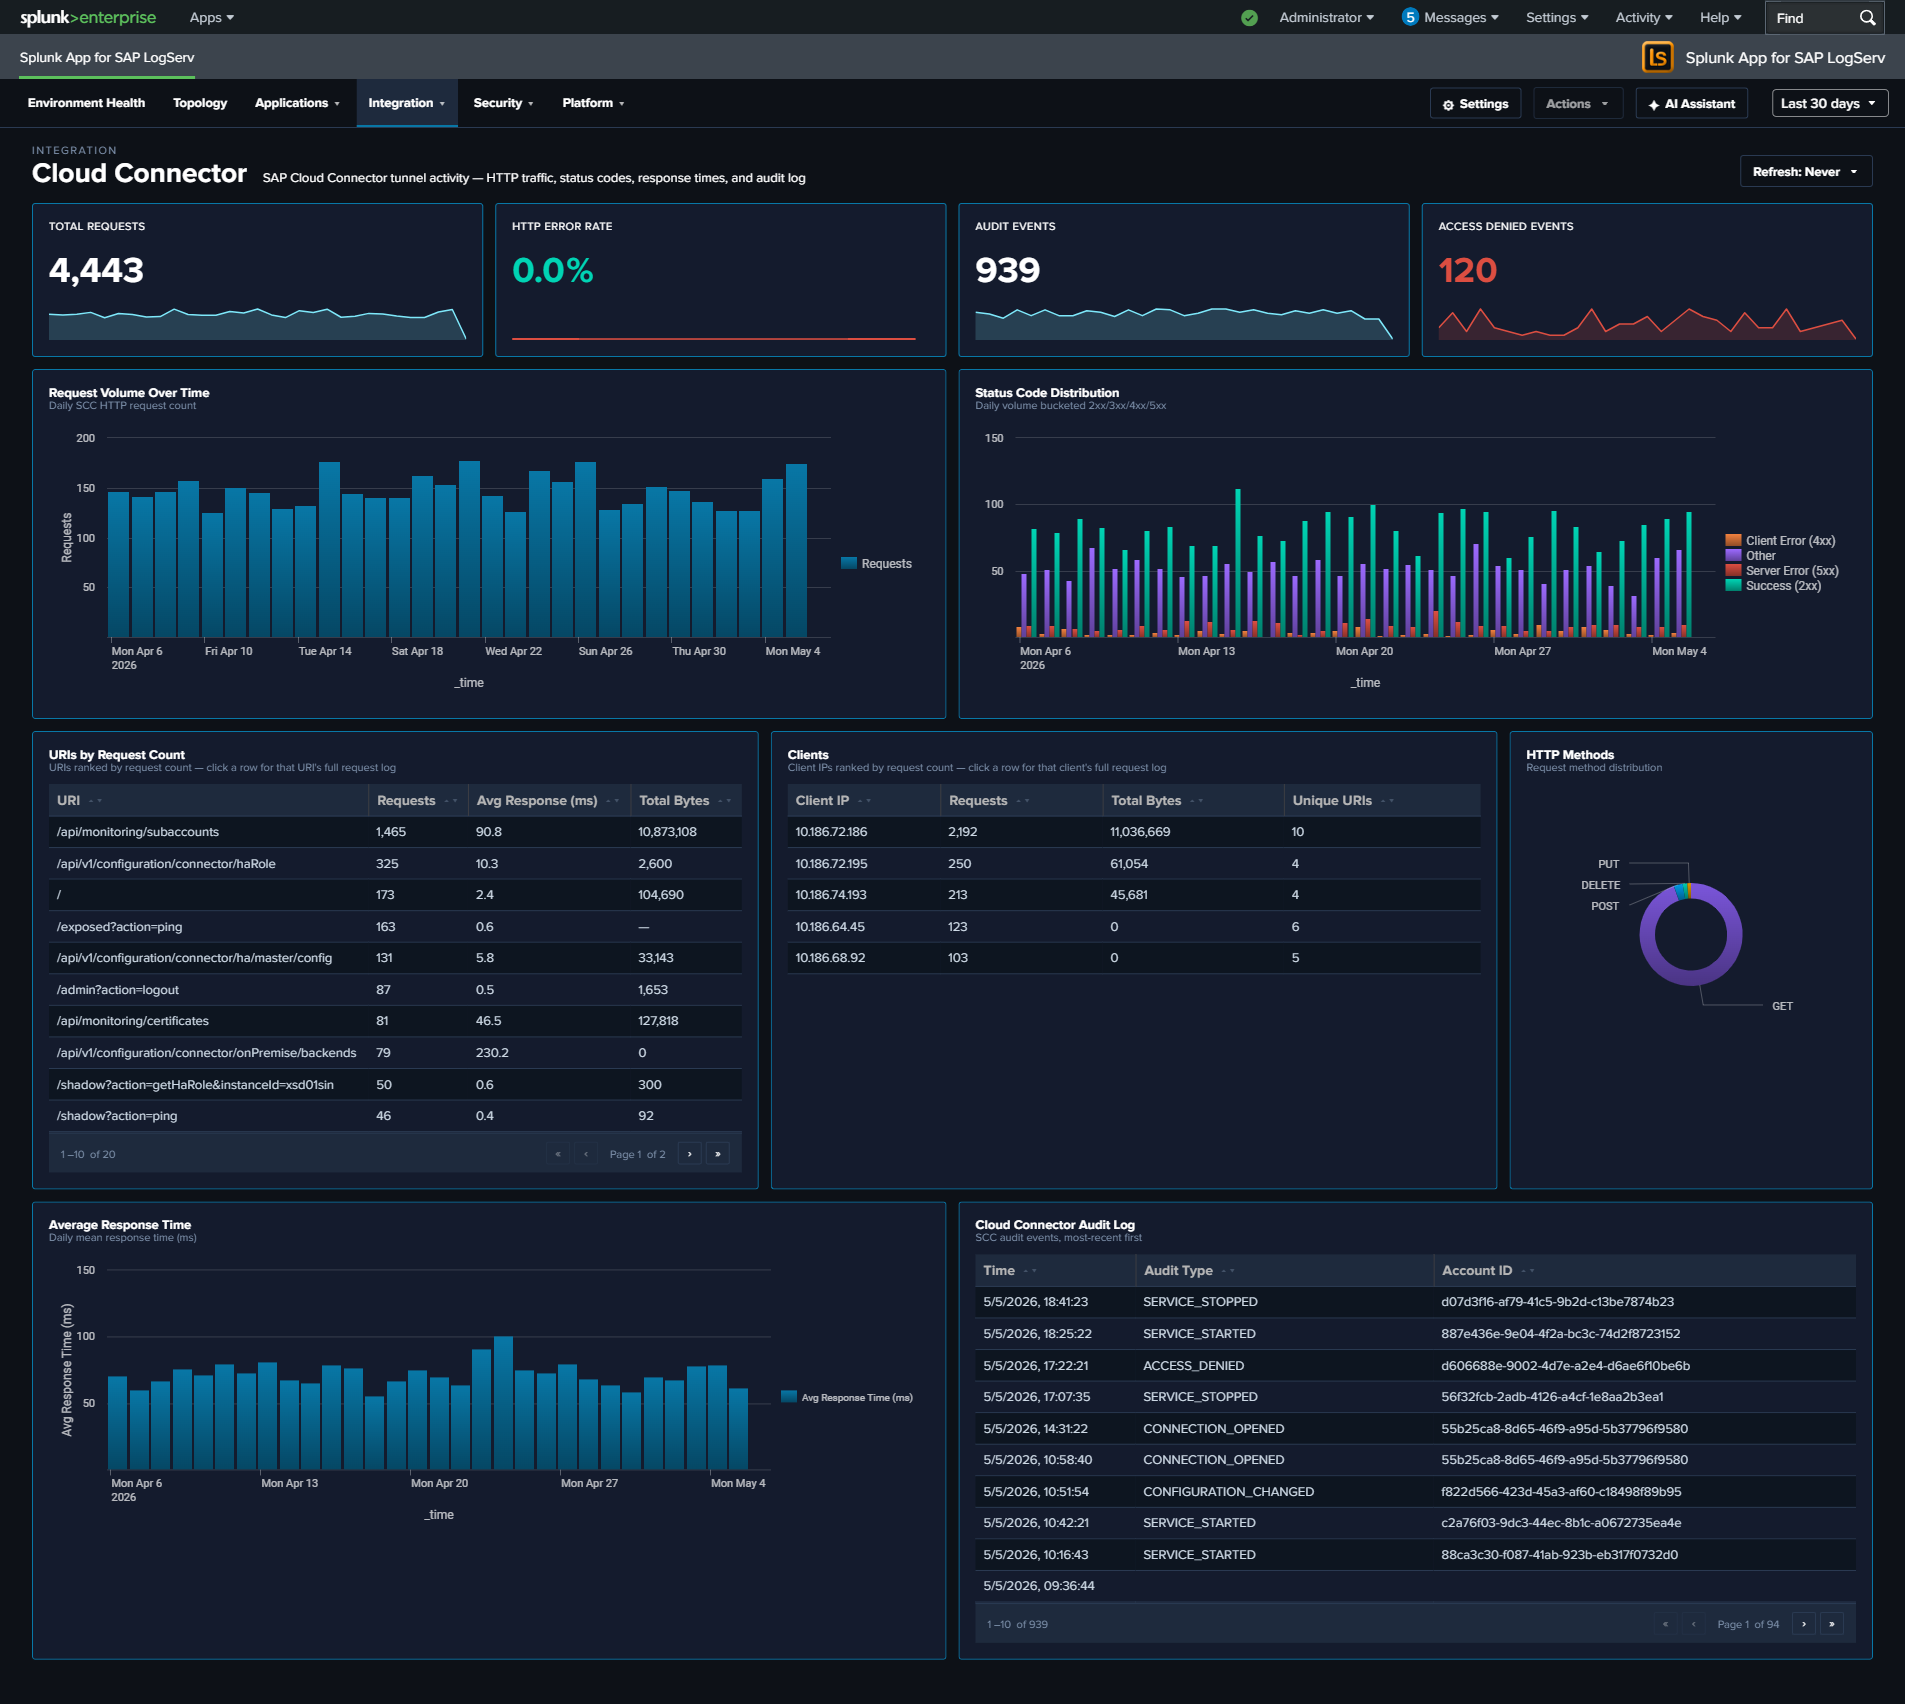
Web Dispatcher¶
Why This Dashboard Matters¶
The Web Dispatcher dashboard analyzes HTTP traffic flowing through the SAP Web Dispatcher, which acts as the reverse proxy and load balancer for SAP web applications including Fiori, WebGUI, and custom web services. As the front door for all web-based SAP access, the Web Dispatcher’s traffic patterns reveal both performance issues and potential security threats. For deeper per-request timing analysis (four-stage breakdown, Avg/Max response-time trends, TLS posture), see Web and API Performance.
Panels¶
- Total Requests – Aggregate count of HTTP requests processed by the Web Dispatcher
- Error Rate – Percentage of requests returning 4xx or 5xx status codes
- Avg Response Time – Average response time across all requests in milliseconds
- Traffic by Status Code – Stacked column chart showing 2xx, 3xx, 4xx, and 5xx response distributions
- Response Time Trend – Response time patterns over time
- Traffic by HTTP Method – Breakdown of GET, POST, PUT, DELETE, etc.
- Top 5 Slowest Pages – Bar chart of the slowest responding URLs
- Top Client IPs by Traffic – Bubble chart showing the most active client IP addresses
- Request Volume Over Time – Daily request trend line
- URIs by Request Count – Table of the most accessed URIs with average response time
- Recent Errors (4xx/5xx) – Table of the latest error events with client IP, method, URI, and status code
What to Look For¶
- 4xx/5xx status code spikes – Client errors (4xx) may indicate broken links, misconfigured apps, or scanning activity. Server errors (5xx) signal backend ABAP or Java system failures.
- Response time degradation – Slow response times impact user experience. Correlate with the Top 5 Slowest Pages to identify which applications are affected, then investigate backend system load.
- Unusual HTTP methods – PUT, DELETE, or PATCH requests where only GET/POST are expected may indicate API abuse or vulnerability exploitation.
- Concentrated client IP traffic – A single IP generating disproportionate traffic in the bubble chart may be a bot, scraper, or denial-of-service source.
- TLS version distribution – If your data includes TLS fields, watch for clients using deprecated TLS versions (1.0, 1.1) that may need to be blocked for compliance.
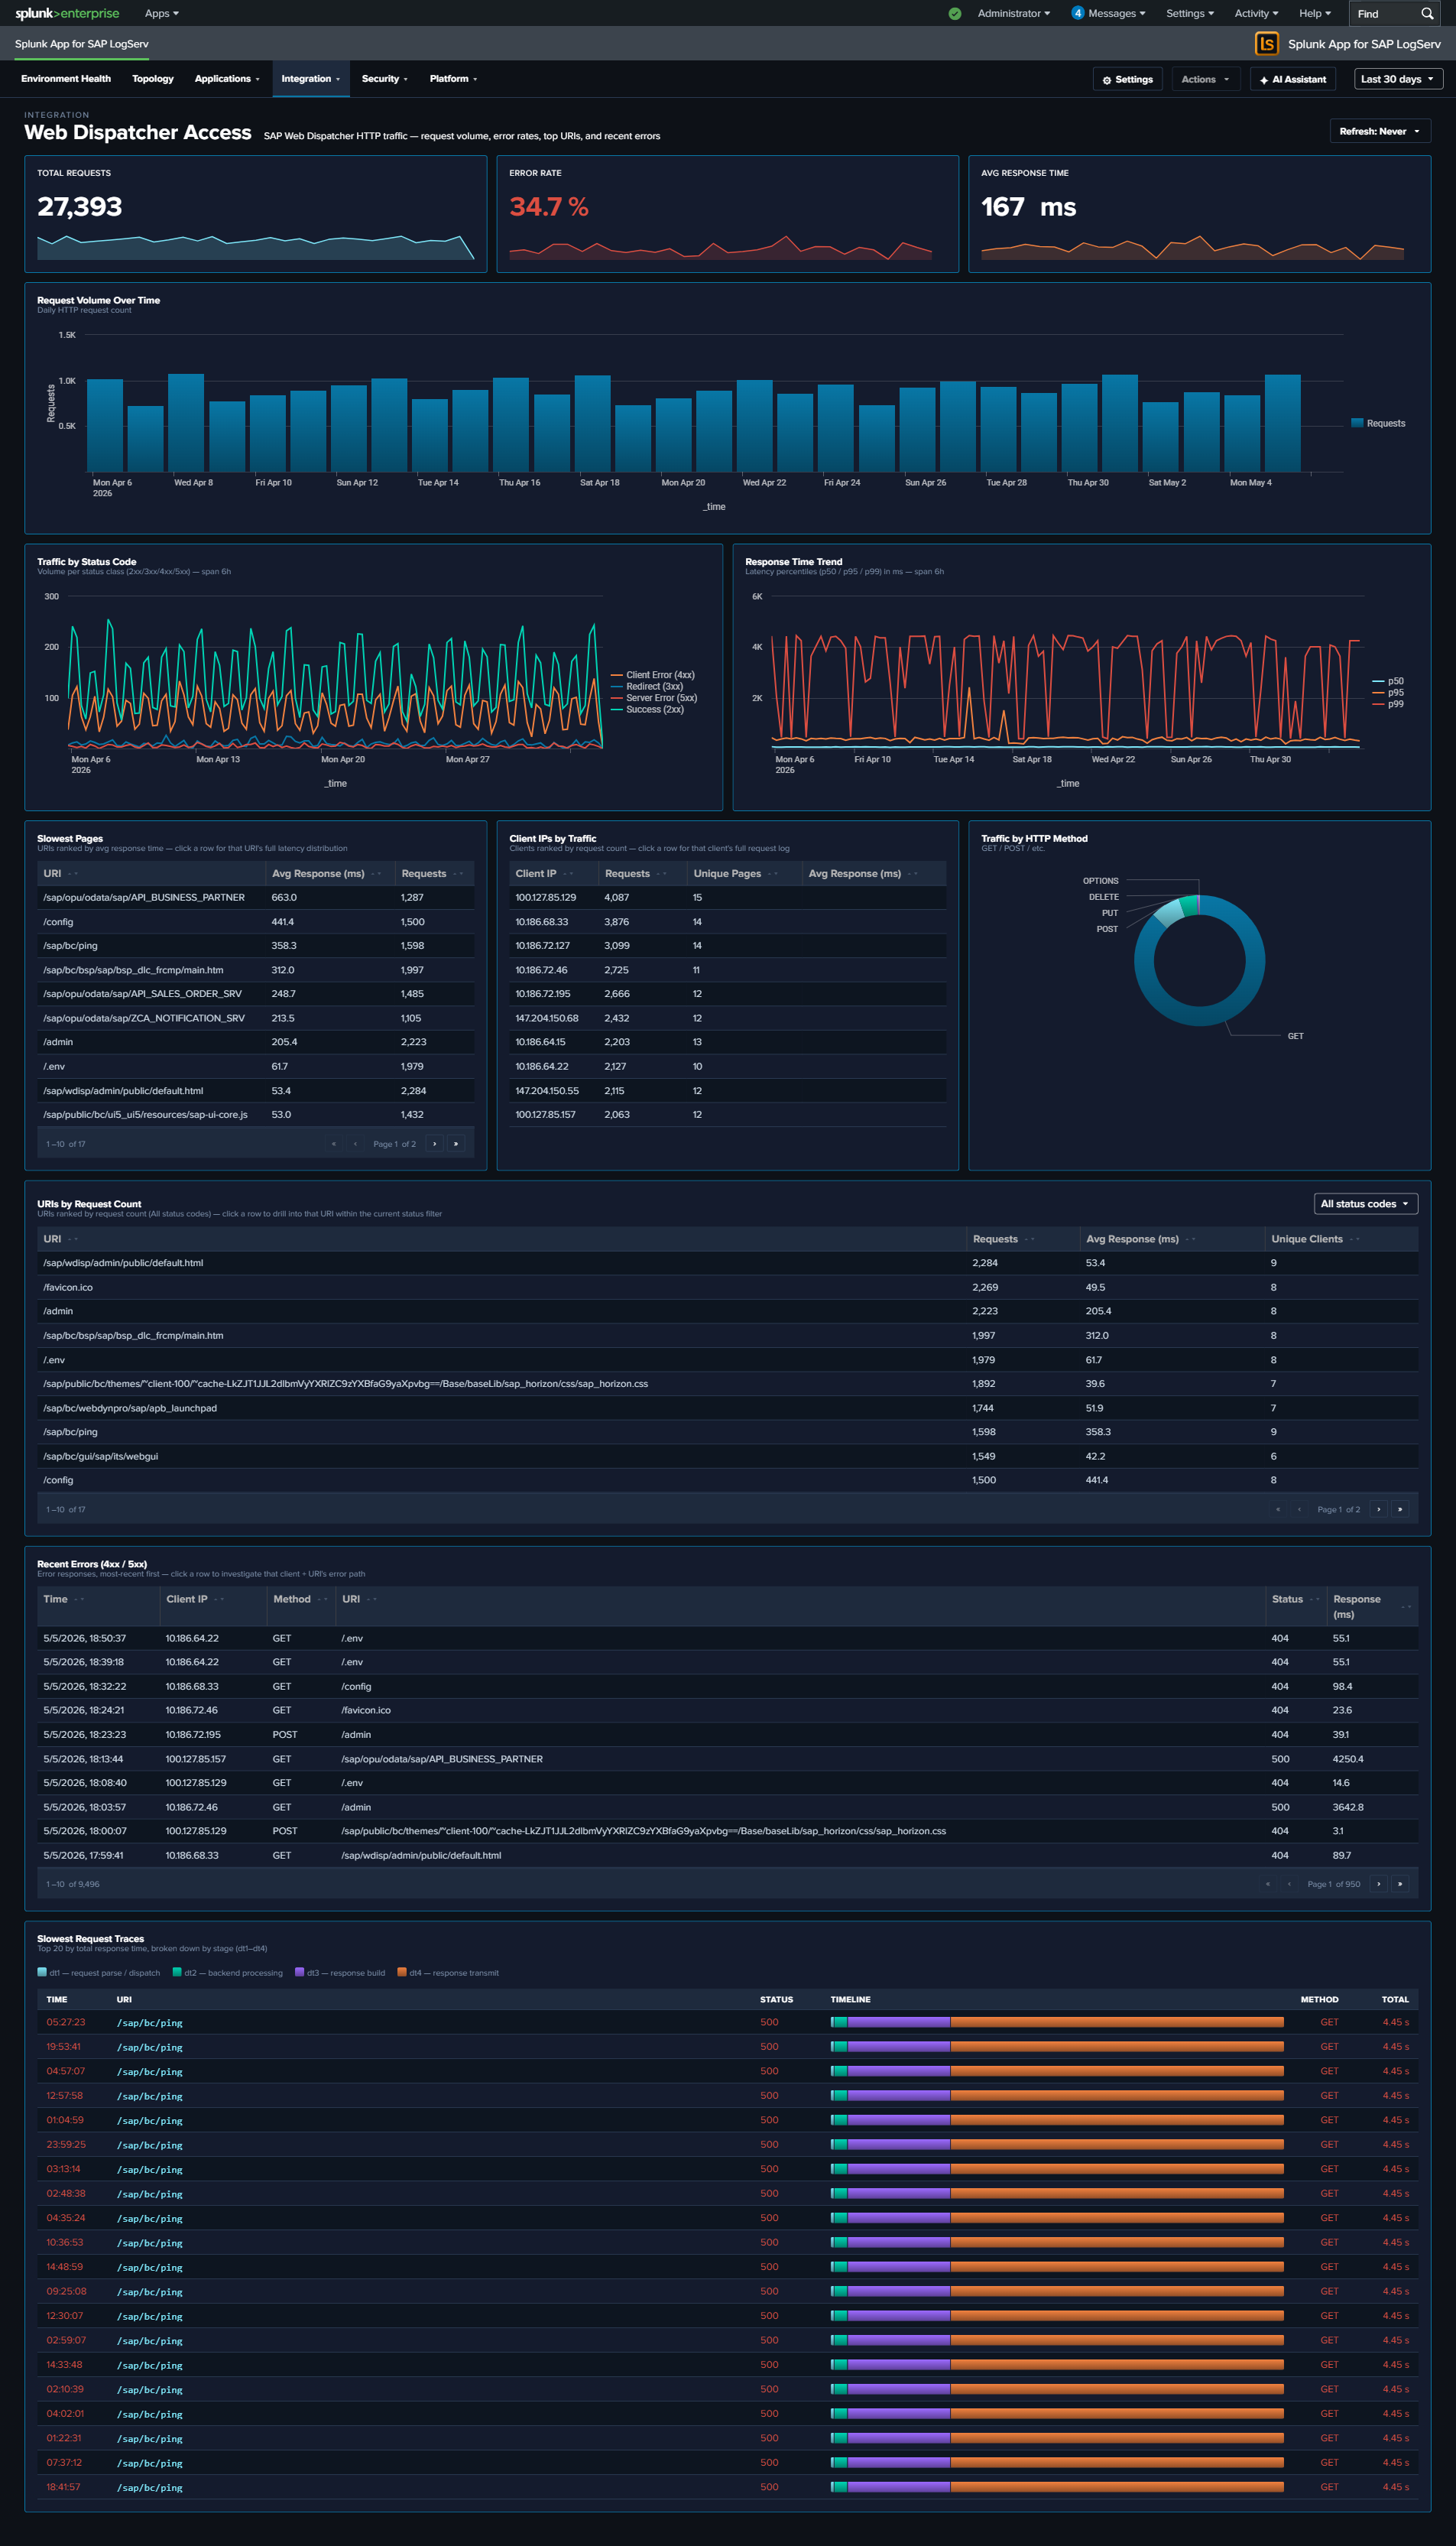
Web and API Performance¶
Why This Dashboard Matters¶
The Web Dispatcher dashboard answers “what’s the traffic doing?” – volume, status codes, top URIs. Web and API Performance answers the next question: “why does it feel slow or unreliable?” It exposes the per-request timing stages that the sap:webdispatcher:access sourcetype records (dt1 receive / dt2 handler / dt3 response / dt4 send), combines response-time averages and maxima across Web Dispatcher and Cloud Connector HTTP traffic, and correlates the HTTP error rate with the Cloud Connector auth failure rate so that you can see whether a spike in user-visible failures is actually a backend-auth problem. It also surfaces TLS posture (version and cipher suite distributions) – data already extracted from Web Dispatcher but previously unused – so that cipher-suite drift or legacy TLS traffic becomes visible.
Panels¶
- Total Requests – Aggregate HTTP request count across Web Dispatcher and Cloud Connector
- HTTP Error Rate – Percentage of requests returning 4xx or 5xx status (combined across both sources); click to open the matching events
- Avg Response Time – Average
response_time_msacross both sources, in milliseconds - Auth Failures – Count of requests rejected for authentication reasons: Web Dispatcher
status IN (401, 403)OR Cloud Connector(status IN (401, 403)) OR is_authenticated="false"; click to drill down - Unique URLs – Distinct count of URIs seen across both sources
- Four-Stage Request Timing Breakdown – Full-width stacked column chart showing the average milliseconds a request spends in each of the Web Dispatcher’s four internal stages per day:
dt1receive (blue),dt2handler (light cyan),dt3response (orange),dt4send (red). The stack composition tells you where time is being spent; the total stack height is the average end-to-end response time. - Response Time (Avg / Max) Over Time – Daily average and peak
response_time_ms(line chart, two series). The Max line climbing while Avg stays flat is the classic tail-latency signal. (Replaces the prior p50 / p95 / p99 percentile chart: averages and maxima roll up byte-exact across the hourly data layer, whereas percentiles cannot — see Dashboard Performance & Data Freshness.) - Slow URIs by Avg Response Time – Table of the slowest URIs ranked by average response time, with source (WebDisp or CC), event count, avg ms, max ms, and error count. Row drilldown opens the events for that URI.
- HTTP Error Rate vs Cloud Connector Auth Failure Rate – Full-width line chart overlaying two series: the overall HTTP error rate (4xx/5xx across both sources, red) and the Cloud Connector auth failure rate (401/403/anonymous, scoped to CC’s own denominator, orange). Use this to answer “are the user-visible errors actually auth failures at the backend?”
- TLS Version Distribution – Column chart with color-coded series: TLS 1.0 red, 1.1 orange, 1.2 yellow, 1.3 teal – reinforcing that older versions are the security concern
- TLS Cipher Suite Distribution (Top 10) – Horizontal bar chart of the 10 most-used cipher suites, with cyan accent
- Slow Clients by Max Response Time – Full-width table of the client IPs experiencing the highest peak latency, with event count, avg ms, max ms, and distinct URI count. Row drilldown opens the events for that client IP.
- Recent 500-Level Errors – Full-width table of the 25 most recent 5xx events with time, source, host, client IP, method, URI, status, and response time. Row drilldown opens the full raw event.
What to Look For¶
- Stage imbalance in the timing breakdown – In a healthy backend,
dt2(handler) dominates the stack because that’s where the ABAP/JVM work happens. Ifdt3(response) ordt4(send) suddenly grow relative todt2, the bottleneck is likely on the response-formation or network-egress side rather than backend processing. - Tail latency growth (Max) – the Max line drifting up while Avg stays flat means a small number of requests are getting dramatically slower – often database contention or garbage-collection pauses. Correlate with Slow URIs to identify which paths are affected.
- Error-rate and auth-failure-rate correlation – When the two lines in the correlation chart track together, your HTTP error spikes are driven by backend auth rejection. When they diverge (HTTP errors up, auth failures flat), the cause is elsewhere (backend unavailable, 500s, timeouts).
- Legacy TLS traffic – Any non-trivial slice of TLS 1.0 or 1.1 in the TLS Version Distribution is a compliance concern. Correlate the TLS Cipher Suite Distribution to see whether legacy ciphers are still being negotiated.
- Slow clients vs slow URIs – The two “Slow” tables answer different questions. A single slow client with diverse URIs suggests network-path problem between that client and your infrastructure; a single slow URI across many clients points at a backend issue with that specific endpoint.
- Concentrated 500 errors – Recurring entries in the Recent 500-Level Errors table from a single host, URI, or client IP narrow the investigation scope immediately.
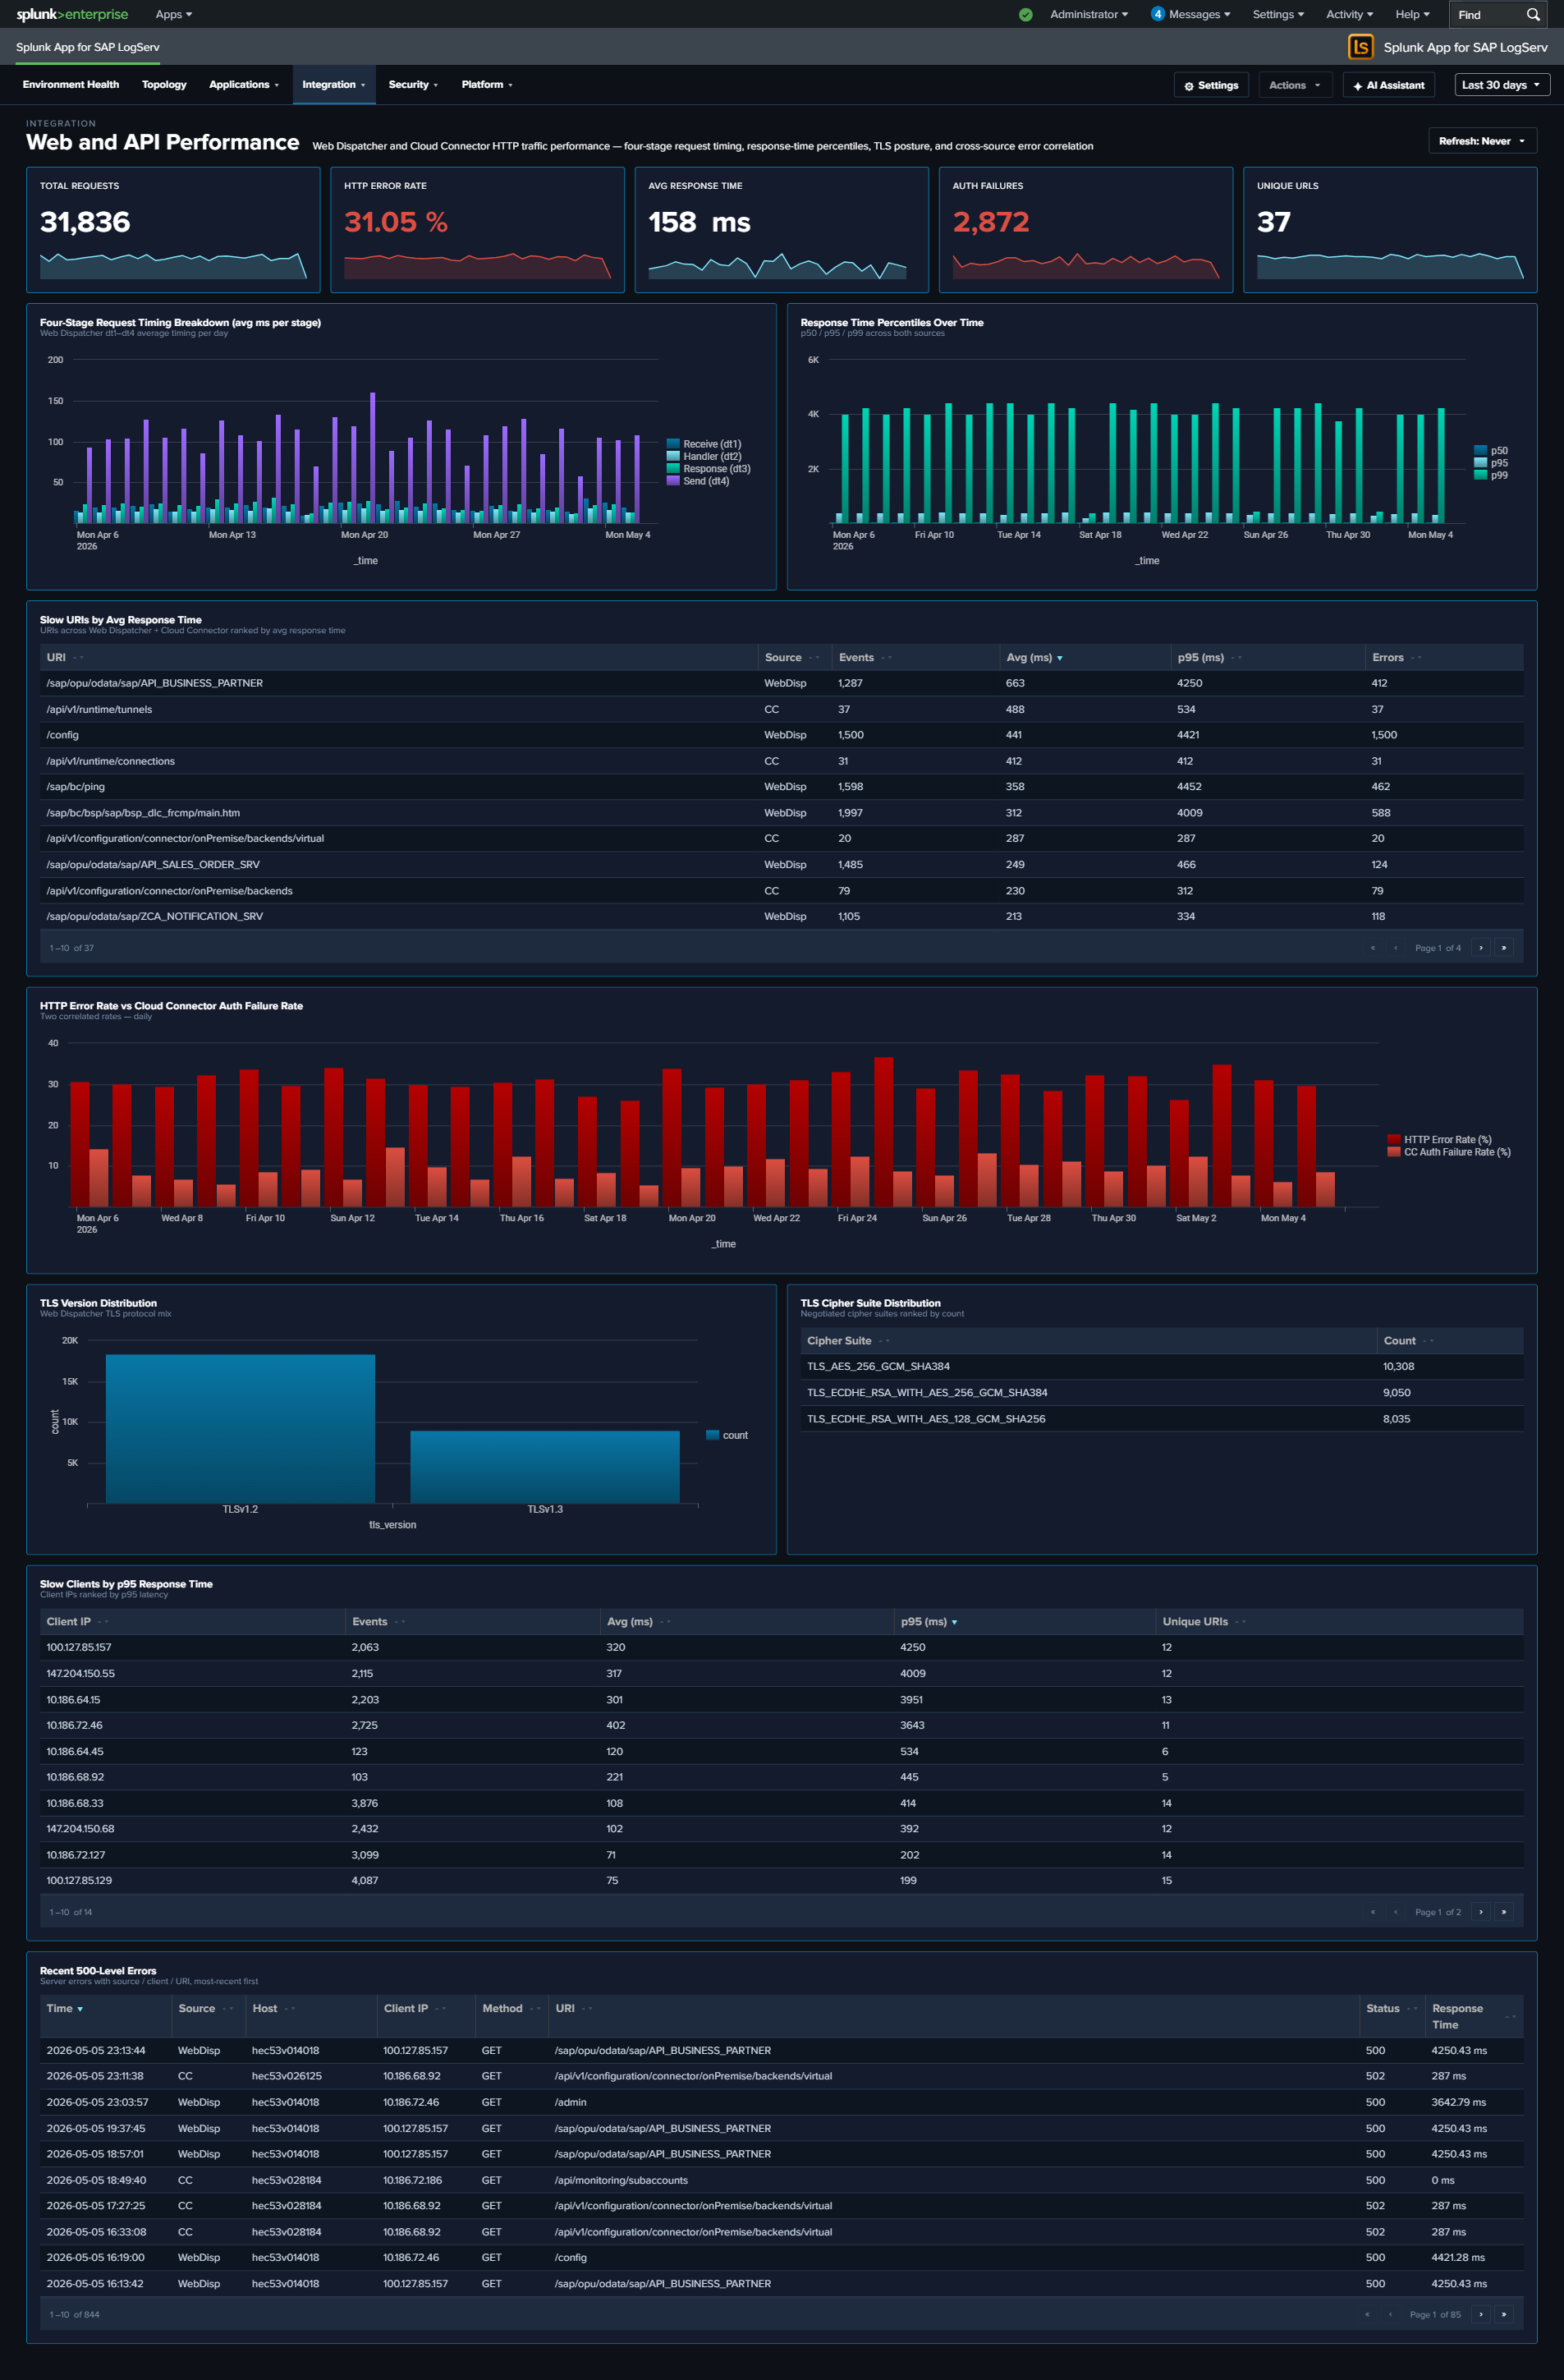
Ended: Integration
Security ↵
Security¶
The Security category contains three cross-source synthesis dashboards designed for security posture analysis and compliance conversations. Each unifies signals that would otherwise live scattered across individual Applications or Platform dashboards, and adds a cross-source correlation panel that surfaces what no single-source dashboard can show.
React dashboard refinements (apply to every dashboard in this category)
Every panel, KPI card, chart, and table row is clickable and opens its drill-down destination in a new browser tab with the source dashboard’s currently-selected time range pre-applied via ?earliest=...&latest=.... The destination’s TimeRangeProvider parses the URL on mount and hydrates its initial range. Every dashboard’s title-row toolbar carries a per-dashboard Refresh picker (Never / 30s / 1m / 5m / 15m / 30m / 1hr) with per-user-per-dashboard cadence persisted via Splunk KV Store, plus a Download PNG button (full-canvas capture via html2canvas).
Two compliance-focused exceptions: the After-Hours Privileged Changes and Recent Privileged Changes tables on the Change & Configuration Activity dashboard intentionally have no row drill-downs — clicking through to raw events from a compliance audit-trail report would pollute the trail with the reviewer’s own search activity in subsequent compliance reports. Per-source operational tables on the same dashboard DO get drill-downs.
| Dashboard | Purpose | Key Data Sources |
|---|---|---|
| Network Perimeter | Unified network-boundary view: firewall drops (inbound), proxy outbound traffic, DNS resolution, and cross-source suspicious-activity correlation | linux_secure, squid:access, isc:bind:query |
| Cross-Stack Authentication | Unified authentication failure analysis across SAP, HANA, and Windows layers | sap:sapstartsrv, sap:hana:audit, XmlWinEventLog |
| Change & Configuration Activity | Cross-stack audit trail: HANA user/role/privilege changes, Windows account and group modifications, Linux sudo and user-management activity, with compliance-focused privileged and after-hours views | sap:hana:audit, XmlWinEventLog, linux_messages_syslog |
Network Perimeter¶
Why This Dashboard Matters¶
Firewall drops, proxy traffic, and DNS queries are three different lenses on the same underlying question: what is crossing the network boundary and should it be there? Each lens lives on its own operational dashboard (Linux, Proxy Analytics, DNS Analytics), but an attacker rarely limits themselves to a single surface – a compromised host often shows up in multiple signals simultaneously, and that correlation is where the security value lives. Network Perimeter synthesizes the three sources into a single view: inbound rejections (firewall), outbound flow (proxy), and resolution activity (DNS), with a dedicated cross-source panel that ranks hosts by combined suspicious-signal score. Use it as the first stop for “is our network perimeter healthy and clean?”
Panels¶
- Firewall Drops – Count of kernel firewall
IN_DROPevents fromlinux_secure - Proxy Requests – Count of HTTP requests handled by Squid
- DNS Queries – Count of DNS queries from
isc:bind:query - Beaconing Domains (red) – Domains exhibiting periodic query patterns (low variance in inter-query interval) – candidate C2 channels
- Denied Requests (red) – Count of proxy requests with
status=403orvendor_action="TCP_DENIED"; click to drill down - Outbound Bandwidth –
sum(bytes_out)across all proxy requests, formatted KB/MB/GB - Perimeter Activity Over Time – Full-width multi-line chart (log-scale y-axis) showing daily counts of all three sources on a single timeline. Log scale keeps Firewall Drops and Proxy Requests visible alongside the much larger DNS Queries volume; simultaneous spikes across two or three lines are the correlation signal to watch for.
- Top Blocked Source IPs – Table of the 20 source IPs most rejected by the firewall, with unique target count and protocols seen; row drilldown to the matching events
- Top Blocked Destination Ports – Table of the 20 destination ports most targeted by rejected traffic, grouped by port + protocol
- Firewall Drops by Protocol – Stacked column showing daily IN_DROP events split by TCP / UDP / ICMP. Protocol shifts are often the clearest signal (ICMP spikes = ping flood / recon; UDP spikes = DNS amplification / port scan; TCP spikes = SYN-style port scan)
- Proxy Denied Traffic Over Time – Area chart of daily denied proxy requests – the outbound complement to firewall drops (inbound)
- Top Outbound Domains by Volume & Bytes – Table of the 20 destination domains receiving the most outbound traffic, ranked by bytes, with request count and unique client count. Row drilldown opens the events for that domain.
- DNS Query Type Distribution – Donut of query-type mix (A / AAAA / PTR / TXT / MX / other). High TXT or MX volume from non-mail hosts is a DNS-tunneling / exfiltration indicator.
- Top Queried Domains – Full-width table of the 30 most queried domains with unique-client count and per-domain
%TXTand%MXratios for quick anomaly spotting. Row drilldown opens DNS query events for that domain. - Suspicious Activity Indicator – Full-width cross-source table of internal hosts appearing in both beaconing DNS queries and denied proxy requests, ranked by signal score (
beacon_domains × 3 + denied_requests). Columns: Host, Beaconing Domains, Beaconing Queries, Denied Proxy Requests, Signal Score. Row drilldown opens both DNS and proxy events for that host.
What to Look For¶
- Correlated spikes across sources – The Perimeter Activity Over Time chart is the quickest read on “is something happening right now?” Watch for days when two or three of the lines spike together – that’s usually an active event (port scan, active C2, exfiltration window) rather than baseline drift.
- Protocol shifts in firewall drops – The stacked column by protocol is more diagnostic than raw drop counts. A normally TCP-heavy mix suddenly showing large UDP or ICMP bands signals a different attacker technique.
- Top Blocked Source IPs concentration – A single source IP generating the overwhelming majority of drops is either a persistent attacker or a misconfigured internal host. Either way, the action is the same: investigate that specific IP.
- TXT-heavy queries to a single domain – A domain in Top Queried Domains with a high
%TXTratio is a DNS-tunneling pattern. Cross-reference the Suspicious Activity Indicator to see which hosts are issuing those queries. - Hosts in the Suspicious Activity table – Any non-empty row here is worth investigating. A host showing up in both beaconing DNS and denied proxy is strong evidence of compromise – the DNS lookups suggest malware C2, and the denied proxy requests suggest the same malware trying to reach blocked destinations.
- Outbound Bandwidth spikes – A sudden rise in the Outbound Bandwidth KPI that isn’t matched by a proportional rise in Proxy Requests means individual transfers are getting larger – often the signature of an exfiltration event.
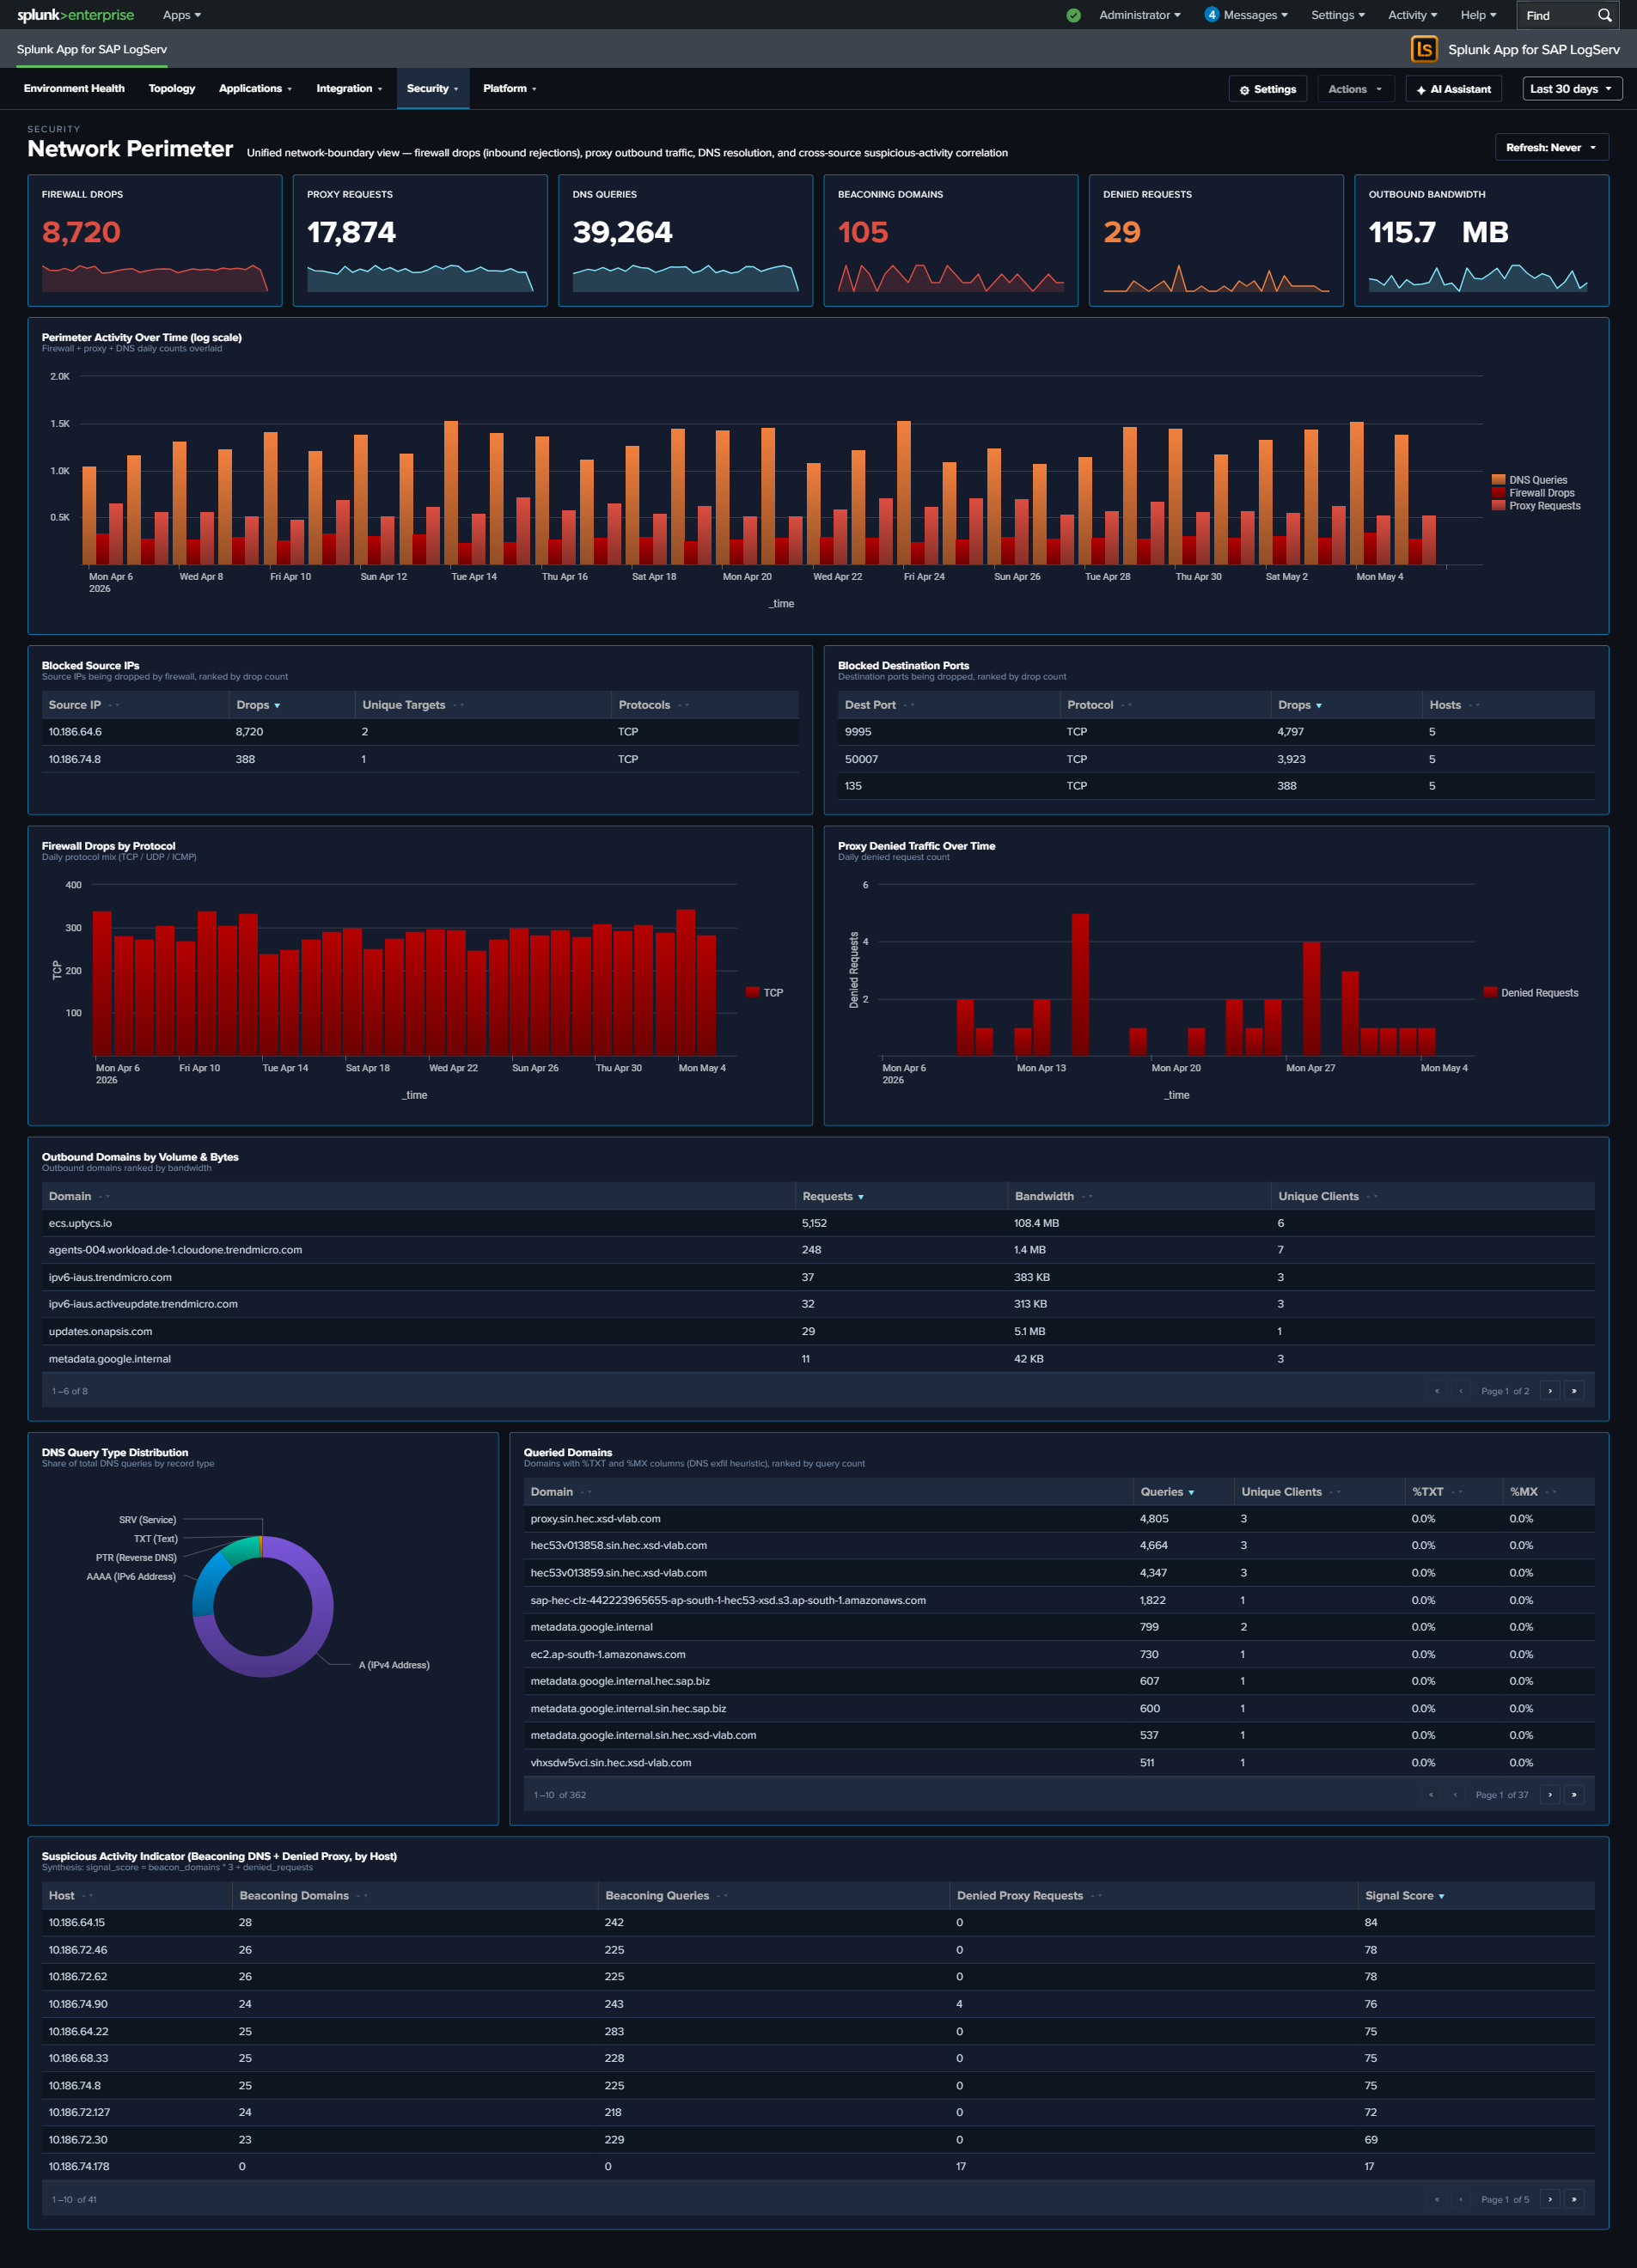
Cross-Stack Authentication¶
Why This Dashboard Matters¶
Authentication failures are usually investigated one layer at a time – someone looks at HANA audit logs, then switches to Windows Event Log, then opens the SAP services dashboard. An attacker who probes multiple layers at once is therefore hard to spot. Cross-Stack Authentication unifies the failure signal across the three layers that matter in an SAP landscape – SAP sapstartsrv, HANA audit, and Windows Security Event Log – so that a single pane shows the total, the per-layer split, and the source IPs and users in common across layers. Use it as the first stop when you suspect credential-based attacks or widespread misconfiguration after a password rotation.
Panels¶
- Total Auth Failures – Aggregate failed authentication count across all three layers (click to drill down)
- SAP Auth Failures – Count of sapstartsrv authentication failures (click to drill down)
- HANA Auth Failures – Count of HANA audit events where the connection/authentication was rejected (click to drill down)
- Windows Auth Failures – Count of Windows
XmlWinEventLog:Securityevents corresponding to logon failures (click to drill down) - Auth Failures Over Time by Layer – Stacked column chart showing daily totals per layer (SAP / HANA / Windows) so correlated spikes across layers are visible at a glance
- Top Users by Auth Failures – Horizontal bar of the 15 usernames with the most failures, summed across all layers
- Auth Failure Source IPs – Table of the top 20 source IPs with failure counts and per-layer breakdown; row drilldown to the matching events
- HANA Auth Activity by User – Table of the top HANA users by failed-auth count with client IP and last-seen time; row drilldown
- Recent Windows Auth Failures – Table of the 25 most recent Windows logon-failure events with user, source workstation, and logon type; row drilldown
- Recent SAP Auth Failures – Table of the 25 most recent sapstartsrv failed-auth events with user, source IP, and method; row drilldown
What to Look For¶
- Correlated spikes across layers – If the stacked Auth Failures Over Time chart shows all three layers ramping simultaneously, that’s almost always a network-level attack (password spray, credential stuffing) rather than a local misconfiguration. Investigate source IPs immediately.
- Single source IP across layers – The Auth Failure Source IPs table makes it obvious when one IP is failing against SAP, HANA, AND Windows. That’s the hallmark of a targeted attack rather than an expired-password incident.
- High user failure count concentrated on service accounts – Service accounts (sapadm, sapservice accounts, DBADMIN-style) with large failure counts suggest either a recently rotated password that wasn’t updated downstream, or an attacker trying to abuse a high-privilege account.
- Asymmetry between layers – Many HANA failures but zero SAP / Windows failures usually indicates an application-layer issue (bad connection string, expired JDBC cert). Asymmetry the other way (many Windows failures, no HANA failures) often points to a domain-level issue.
- After a password rotation – Expect a short burst of failures across one or more layers immediately after a change. If the burst persists beyond the rotation window, some downstream system is still using the old credential.
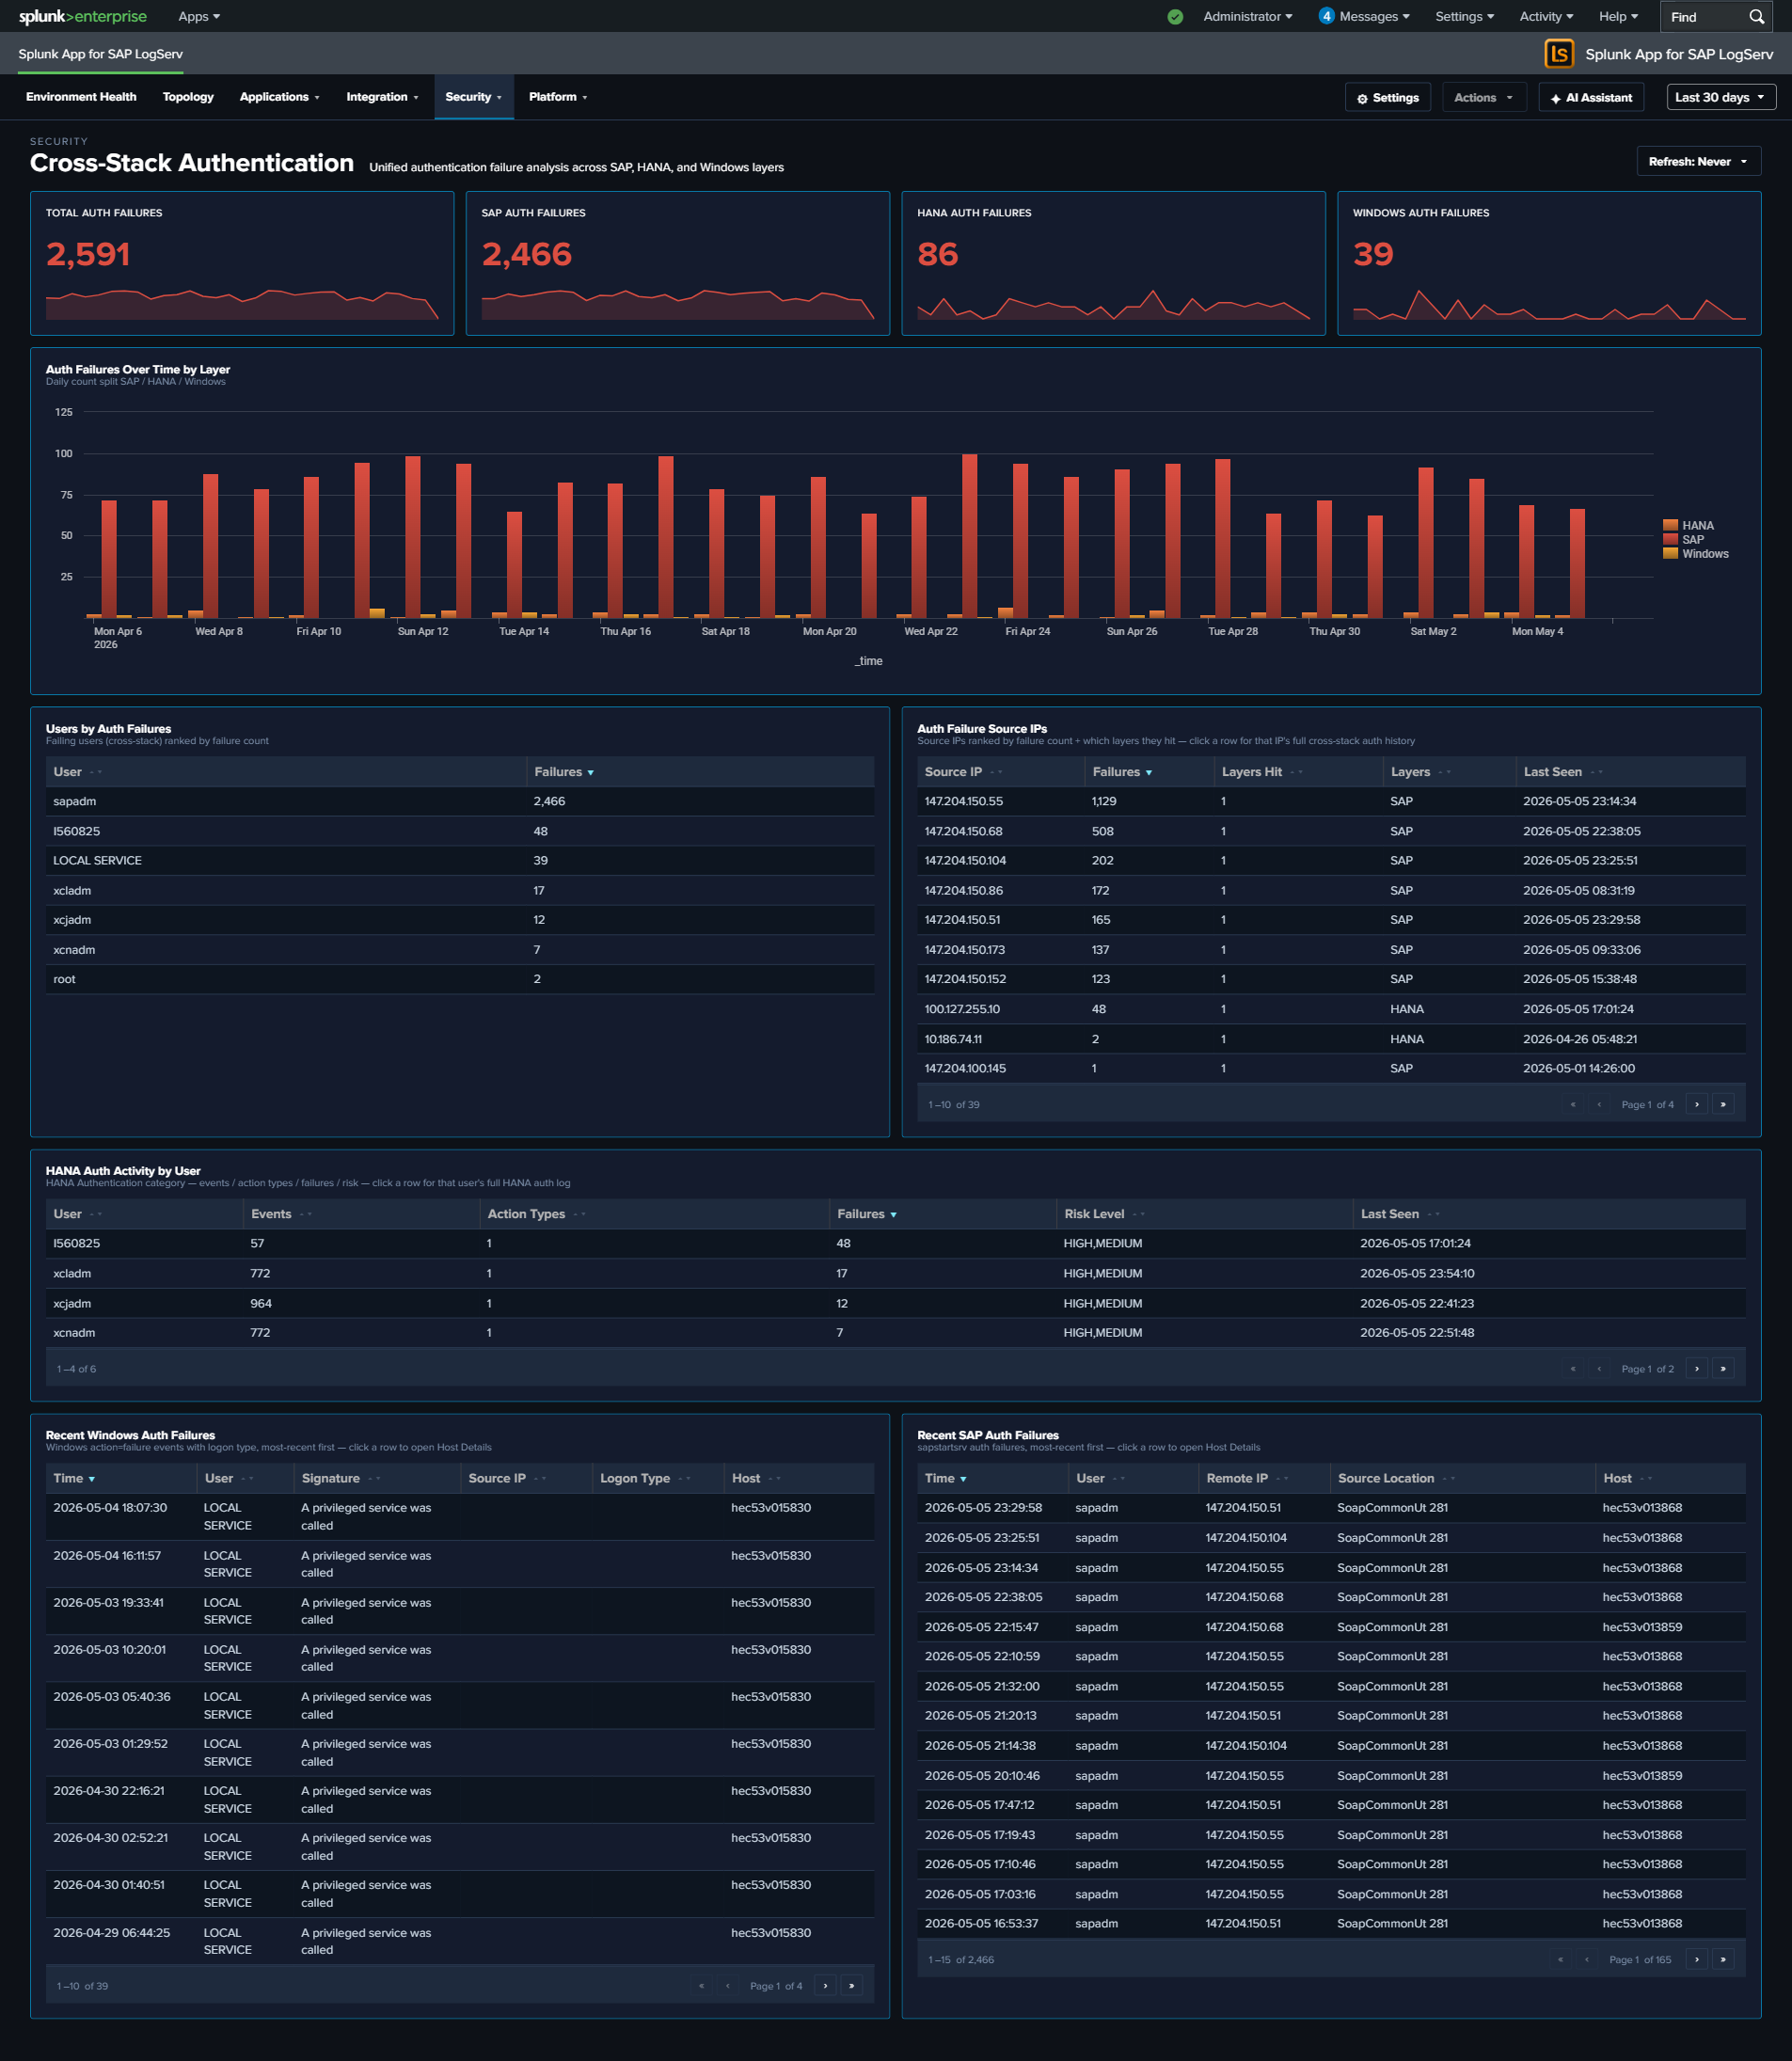
Change & Configuration Activity¶
Why This Dashboard Matters¶
Compliance conversations (SOX, PCI, internal change management) all require evidence that configuration changes are (1) authorized, (2) attributable to a specific operator, and (3) happening in approved maintenance windows. That evidence lives scattered across three audit trails: HANA audit logs (user/role/privilege/password operations and DDL), Windows Security Event Log (account and group modifications), and Linux syslog (sudo commands plus useradd/usermod/userdel/passwd events). This dashboard unifies the three into a single audit trail with a consistent operator column and category taxonomy, plus two compliance-focused “recent” tables: one filtered to privileged actions, one filtered to after-hours activity.
Panels¶
- Total Change Events – Aggregate count of change events across all three sources
- User Account Changes – Count of user-management actions (HANA
User Management/User Creation/User Deletion; Windows EventCodes 4720/4722/4725/4726/4738/4781; Linuxuseradd/usermod/userdel) - Permission Grants (red) – Count of privilege/group-membership grants (HANA
Permission Grant; Windows EventCodes 4728/4732/4756 – “added to group”) - Password Events – Count of password changes and resets (HANA
Password Management/Password Reset; Windows EventCode 4724; Linuxpasswd) - After-Hours Changes (red) – Count of change events occurring outside business hours (weekday 7am-7pm) or on weekends; HANA events use the pre-computed
is_business_hours/is_weekendflags, other sources compute from_time - Unique Operators – Distinct count of source-prefixed operator identities (e.g.,
HANA:XCPADM,Windows:domain\admin,Linux:ops-user) - Change Activity Over Time – Full-width stacked column by day, series split by source (HANA / Windows / Linux). Same-day spikes across two or three series often line up with maintenance windows; isolated spikes in one source worth investigating.
- Change Events by Category – Donut showing the category mix: Permission Grant, Permission Revoke, User Management, Password Change, Group Membership, Account Status, Sudo Command, DDL / Config, Other.
- Top Operators by Change Count – Horizontal bar chart of the 15 operators generating the most change events, with source-prefixed identities so operator activity is clearly scoped to each system.
- HANA Audit – Change Events – Full-width table of the 50 most recent HANA user/role/privilege/password/DDL actions with Operator, Target, Category, Action, Status, Host.
- Windows – Account & Group Modifications – Full-width table of the 50 most recent Windows Security events across all 15 canonical account/group EventCodes, with human-readable Description column derived from EventCode.
- Linux – Sudo & Command Activity – Full-width table of the 50 most recent sudo commands +
useradd/usermod/userdel/groupadd/groupmod/groupdel/passwdactivity, with Operator (extracted from sudo prefix or PAM(user)pattern) and Command. - Recent Privileged Changes (Top 25, Compliance Focus) – Full-width table filtered to the highest-risk subset: HANA Permission Grants + User Creations + Audit Policy changes; Windows account creation/enable/password-reset + local-group additions; Linux
useradd/visudo/admin-group modifications. This is the “who gave themselves or others more access” report. - Recent After-Hours Changes (Top 25) – Full-width table of any change event filtered to
is_after_hours=1. This is the “who was working outside the change window” report – high compliance value.
What to Look For¶
- Rows in the Privileged Changes table with unfamiliar operators – The “headline” compliance question. A permission grant or group-addition you don’t recognize is the first thing to investigate.
- After-Hours activity on business days – The After-Hours table surfaces all outside-window activity. Weekend entries are often planned maintenance; weekday late-night or early-morning entries warrant a check against your change tickets.
- Single operator dominating the Top Operators bar – One identity generating most changes can be legitimate (an admin performing a large rollout) or concerning (an account being abused). The source prefix tells you which system to look at first.
- Category-mix drift – If the Change Events by Category donut suddenly shows a large “Permission Grant” slice where it’s historically been minor, someone has been handing out privileges. Check the HANA Audit table for details.
- Source asymmetry – The stacked column should show all three sources over time. If one source goes silent, it’s likely a logging-pipeline issue rather than “no changes happened”. Correlate with Data Pipeline Overview.
- Linux sudo commands starting with useradd/usermod/visudo/passwd – These are the Linux equivalent of admin changes; they show up in both the Linux table and the Privileged Changes table for visibility.
Compliance-focused exception: no row drill-downs on the After-Hours and Privileged Changes tables
Two compliance-focused tables on this dashboard intentionally have no row drill-downs — the After-Hours Changes and Recent Privileged Changes tables. Clicking through to raw events from a compliance audit-trail report would pollute the trail with the reviewer’s own search activity in subsequent compliance reports. Per-source operational tables on the same dashboard (HANA Audit, Windows Account & Group Modifications, Linux Sudo & Command Activity) DO get drill-downs.
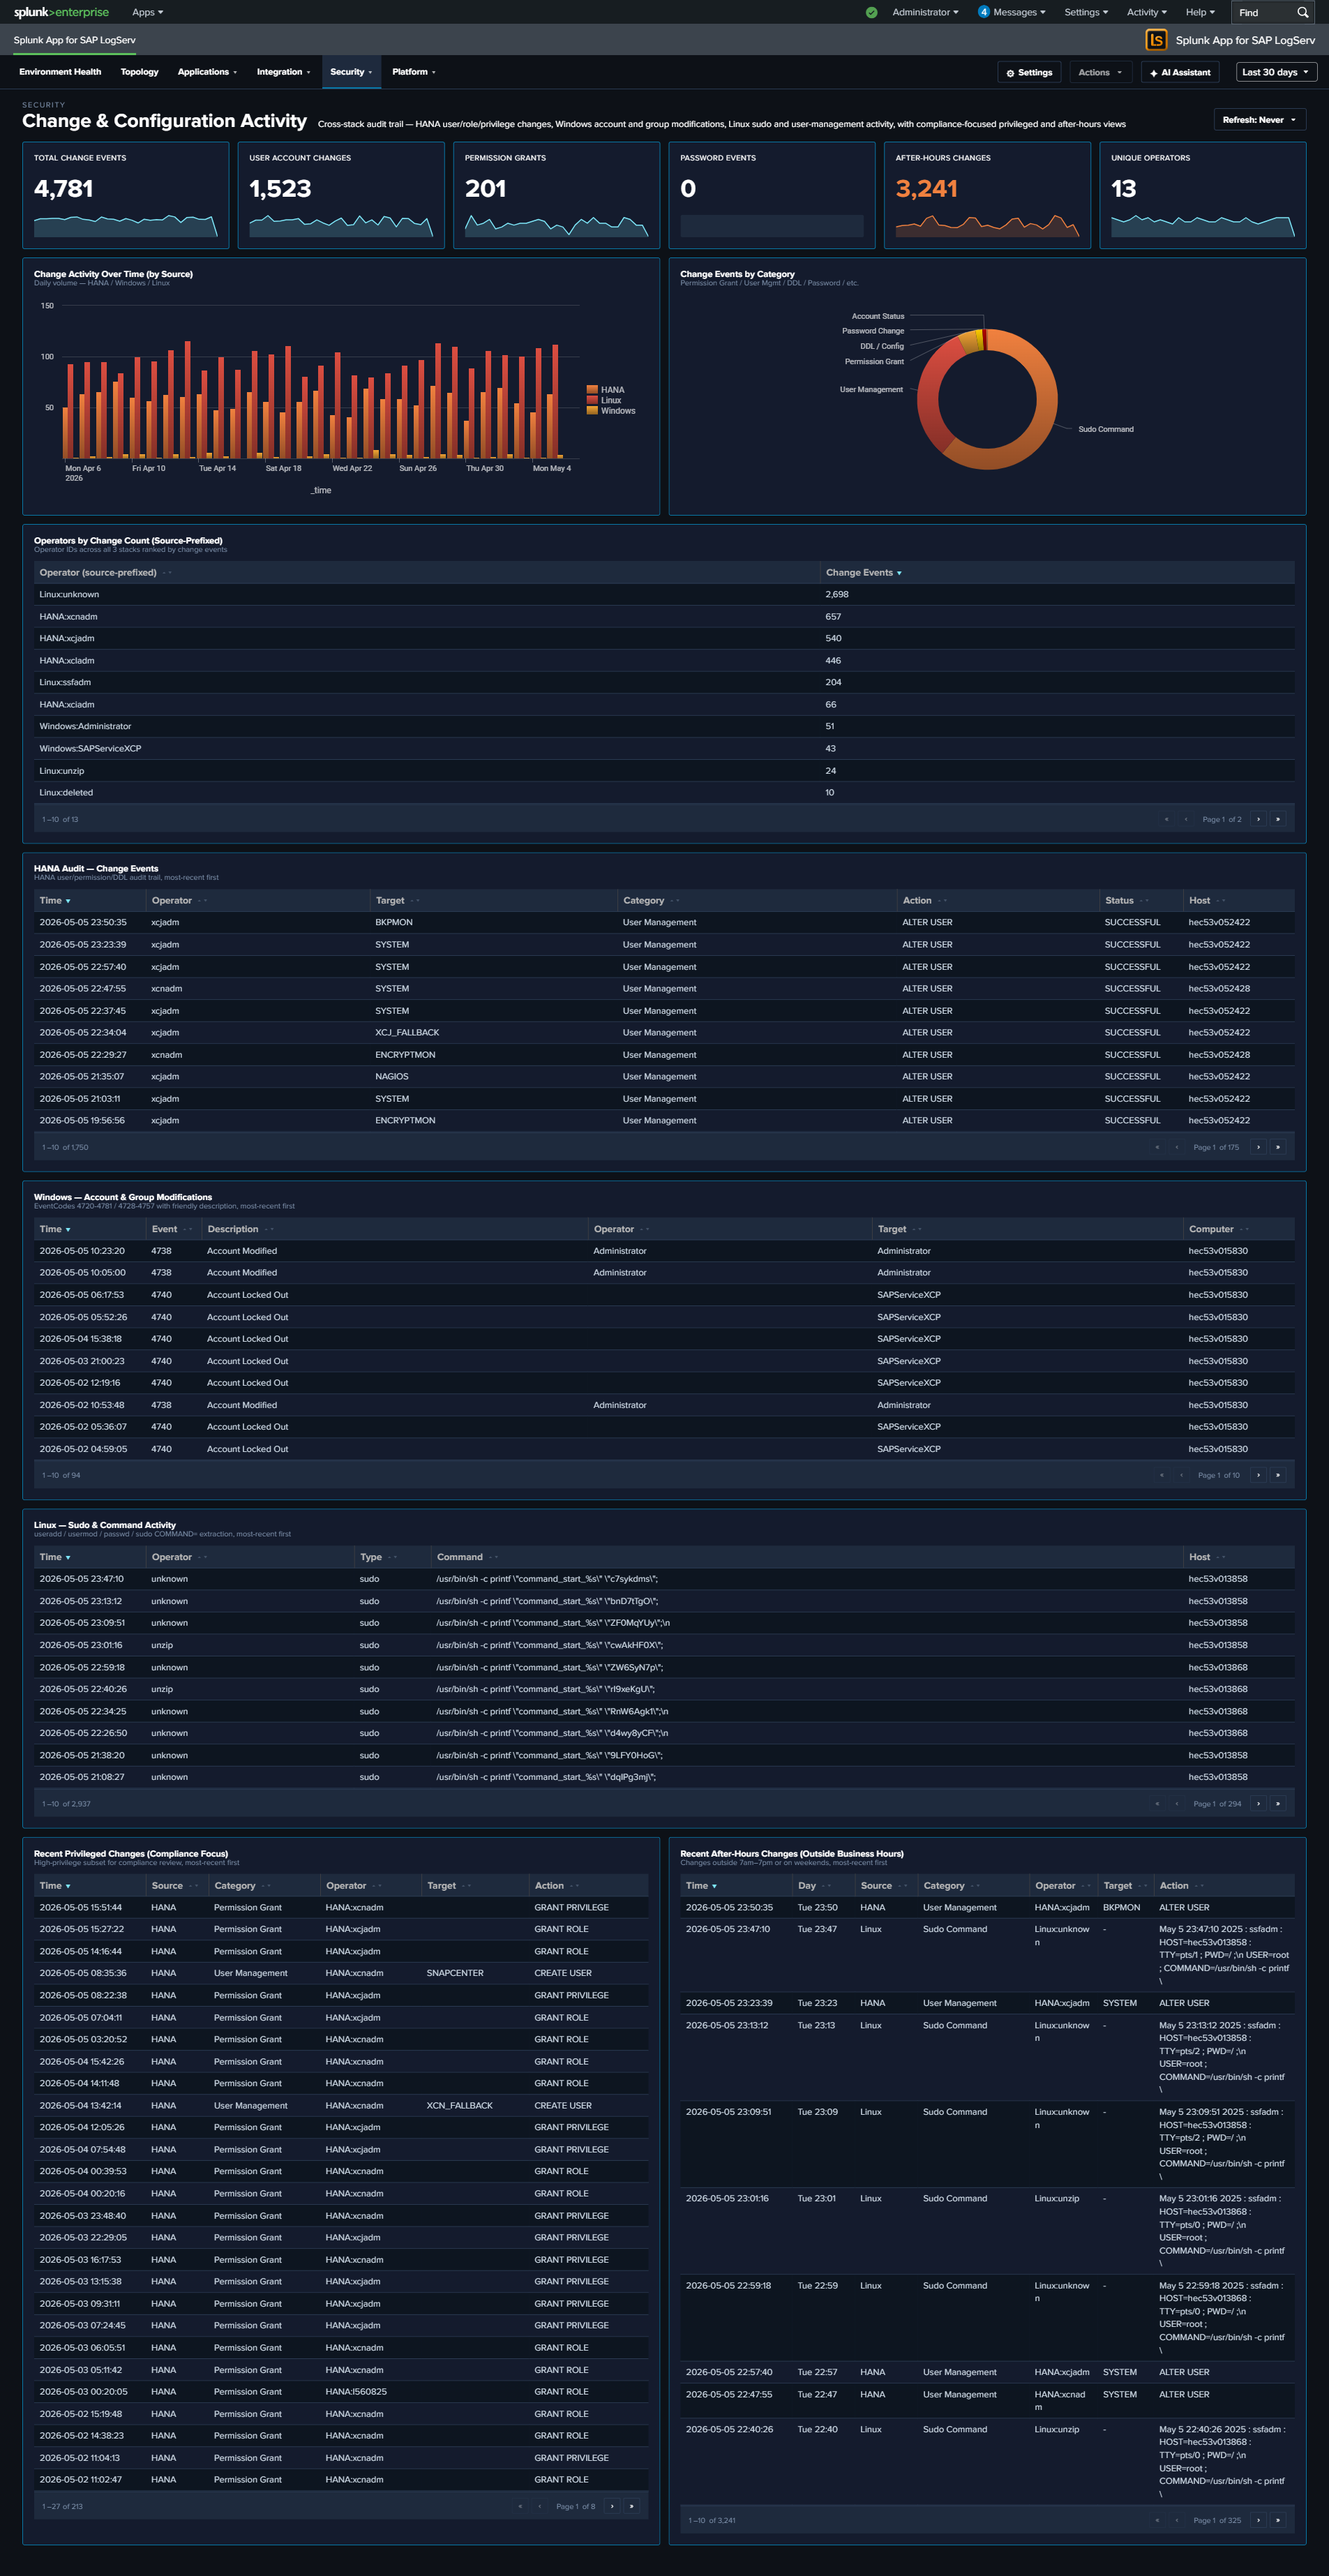
Ended: Security
Platform ↵
Platform¶
The Platform category covers the infrastructure underneath SAP — data pipeline health (Splunk ingest), network services (DNS, Proxy), host operating systems (Linux, Windows), and a per-host forensic drill-down. These dashboards answer questions about the underlying systems and the data-collection pipeline itself rather than the SAP workloads on top. The graph-based Environment Topology view is its own top-level entry in the app nav, not a Platform-group dashboard.
React dashboard refinements (apply to every dashboard in this category)
Every panel, KPI card, chart, and table row is clickable and opens its drill-down destination in a new browser tab with the source dashboard’s currently-selected time range pre-applied via ?earliest=...&latest=.... The destination’s TimeRangeProvider parses the URL on mount and hydrates its initial range. Every dashboard’s title-row toolbar carries a per-dashboard Refresh picker (Never / 30s / 1m / 5m / 15m / 30m / 1hr) with per-user-per-dashboard cadence persisted via Splunk KV Store, plus a Download PNG button (full-canvas capture via html2canvas).
| Dashboard | Purpose | Key Data Sources |
|---|---|---|
| Data Pipeline Overview | Ingest pipeline view: 5 KPIs, Sourcetype Summary table, host activity, and source-to-sourcetype link graph (in second tab). Two tabs (Overview + Linked Graph). Dashboard-wide host filter in title row scopes every panel + the linked graph. | All sourcetypes |
| Multi-Cloud Overview | Per-cloud-provider ingest split: AWS vs Azure event counts, sourcetype distribution per provider, recent activity. Built on the indexed cloud_provider field with the sap_logserv_cloud_provider_default_macro for legacy AWS defaulting. See Azure Setup Guide for Azure-side configuration. |
All sourcetypes (filtered by cloud_provider) |
| DNS Analytics | DNS query analysis, top resolvers, beaconing detection, and client activity | isc:bind:query, isc:bind:network, isc:bind:transfer |
| Linux System & Security | Linux OS events, SAP application activity, and firewall monitoring (with Top Drop Source surface) | linux_messages_syslog, linux:cron, linux:warn, linux:sudolog, linux:slapd, linux_secure |
| Windows Events | Windows operational health — event severity trends, top event codes, service state changes, PowerShell activity | XmlWinEventLog |
| Proxy Analytics | Squid proxy traffic, top domains by bandwidth, cache action distribution, client diversity | squid:access |
| Host Details | Per-host drill-down with Overview, Role Activity, and Sourcetype Mapping tabs. Title-row Multiselect filter to one host, multiple hosts (host IN (...)), or All Hosts; role-specific panels auto-hide for hosts without that data. |
All sourcetypes (host-filtered) |
Data Pipeline Overview¶
Why This Dashboard Matters¶
The Data Pipeline Overview is your single pane of glass for the entire SAP LogServ ingestion pipeline. It answers the most fundamental question: is data flowing from all expected hosts and sourcetypes? In a distributed SAP landscape with multiple SIDs, instances, and log types, a gap in data collection can go unnoticed for days without centralized visibility. This dashboard has two tabs: Overview for the operational KPI/table view, and Linked Graph for the full-width source-to-sourcetype mapping.
The title row carries a dashboard-wide host filter: a Multiselect (with filter input + Select All Matches) plus a Top-N picker that scopes EVERY panel on BOTH tabs to the chosen hosts. The filter splices a host="X" (1 host) or host IN (...) (2+ hosts) clause into all 4 KPIs + their sparklines, the Events Over Time chart, the Sourcetype Summary table, the Host Latest Activity table, AND the linked-graph view on the second tab. Top N kicks in only when zero specific hosts are selected.
Multi-cloud ingest split
The Data Pipeline Overview aggregates across BOTH AWS S3 and Azure Blob Storage ingest channels without distinguishing them — events from either channel land under sap_logserv_logs and route to the same downstream sourcetypes. For a per-cloud-provider breakdown (AWS vs Azure event counts, sourcetype distribution per provider, recent activity), see the Multi-Cloud Overview dashboard in the same Platform group. See Azure Setup Guide for Azure-side configuration.
Tab 1 – Overview¶
- Total Events – Aggregate event count across all LogServ sourcetypes
- Total Sourcetypes – Count of distinct sourcetypes seen in the time range
- Total Volume – Sum of
_rawbytes, formatted as KB/MB/GB - Ingest Errors – Count of Splunk ingest-pipeline errors from
Splunk_TA_awsandsplunk_ta_sap_logserv(filters out ExecProcessor scheduled-input noise; click to open the matching events) - Active Hosts – Count of distinct hosts reporting data
- Host Event Count – Daily event volume per host (log scale)
- Sourcetype Summary – Rich table with 14 columns: Sourcetype, Status (Fresh/Stale/Very Stale), Trend (sparkline), Events, % of Total, Avg/Day, Volume, App Errors, Hosts, Sources, Events (1h), First Seen, Last Seen, Lag. Click a row to open the search app pre-filtered by sourcetype.
- Host Latest Activity – Table showing each host’s last event time, event count, and sourcetypes (click a row to drill down to Host Details)
Tab 2 – Linked Graph¶
- Source to Sourcetype Mapping – Full-width link graph visualizing the flow of data from source paths to sourcetypes, with column widening tuned so 3 columns fit inside the frame without horizontal scroll
What to Look For¶
- Hosts going silent – A host that was previously reporting data but suddenly stops may indicate an agent failure, network issue, or system outage. Check the Host Latest Activity table for stale timestamps and the Sourcetype Summary Status column for “Stale” or “Very Stale” entries.
- Sourcetype volume drops – A sudden decrease in events for a specific sourcetype often signals an ingestion pipeline issue. The Sourcetype Summary Events (1h) and Trend sparkline columns make recent drops visible at a glance.
- Unexpected volume spikes – A sharp increase in event volume from a single host could indicate a log storm (runaway process, debug logging left enabled) or a security event generating excessive audit entries.
- Ingest errors climbing – The Ingest Errors KPI is a curated count (after filtering harmless noise); a non-zero count sustained over days usually points to a misconfigured S3 input, SQS permissions issue, or malformed records in a specific prefix.
- Missing sourcetype mappings – If a host shows data but is missing an expected sourcetype in the link graph (second tab), the routing transforms may need attention.
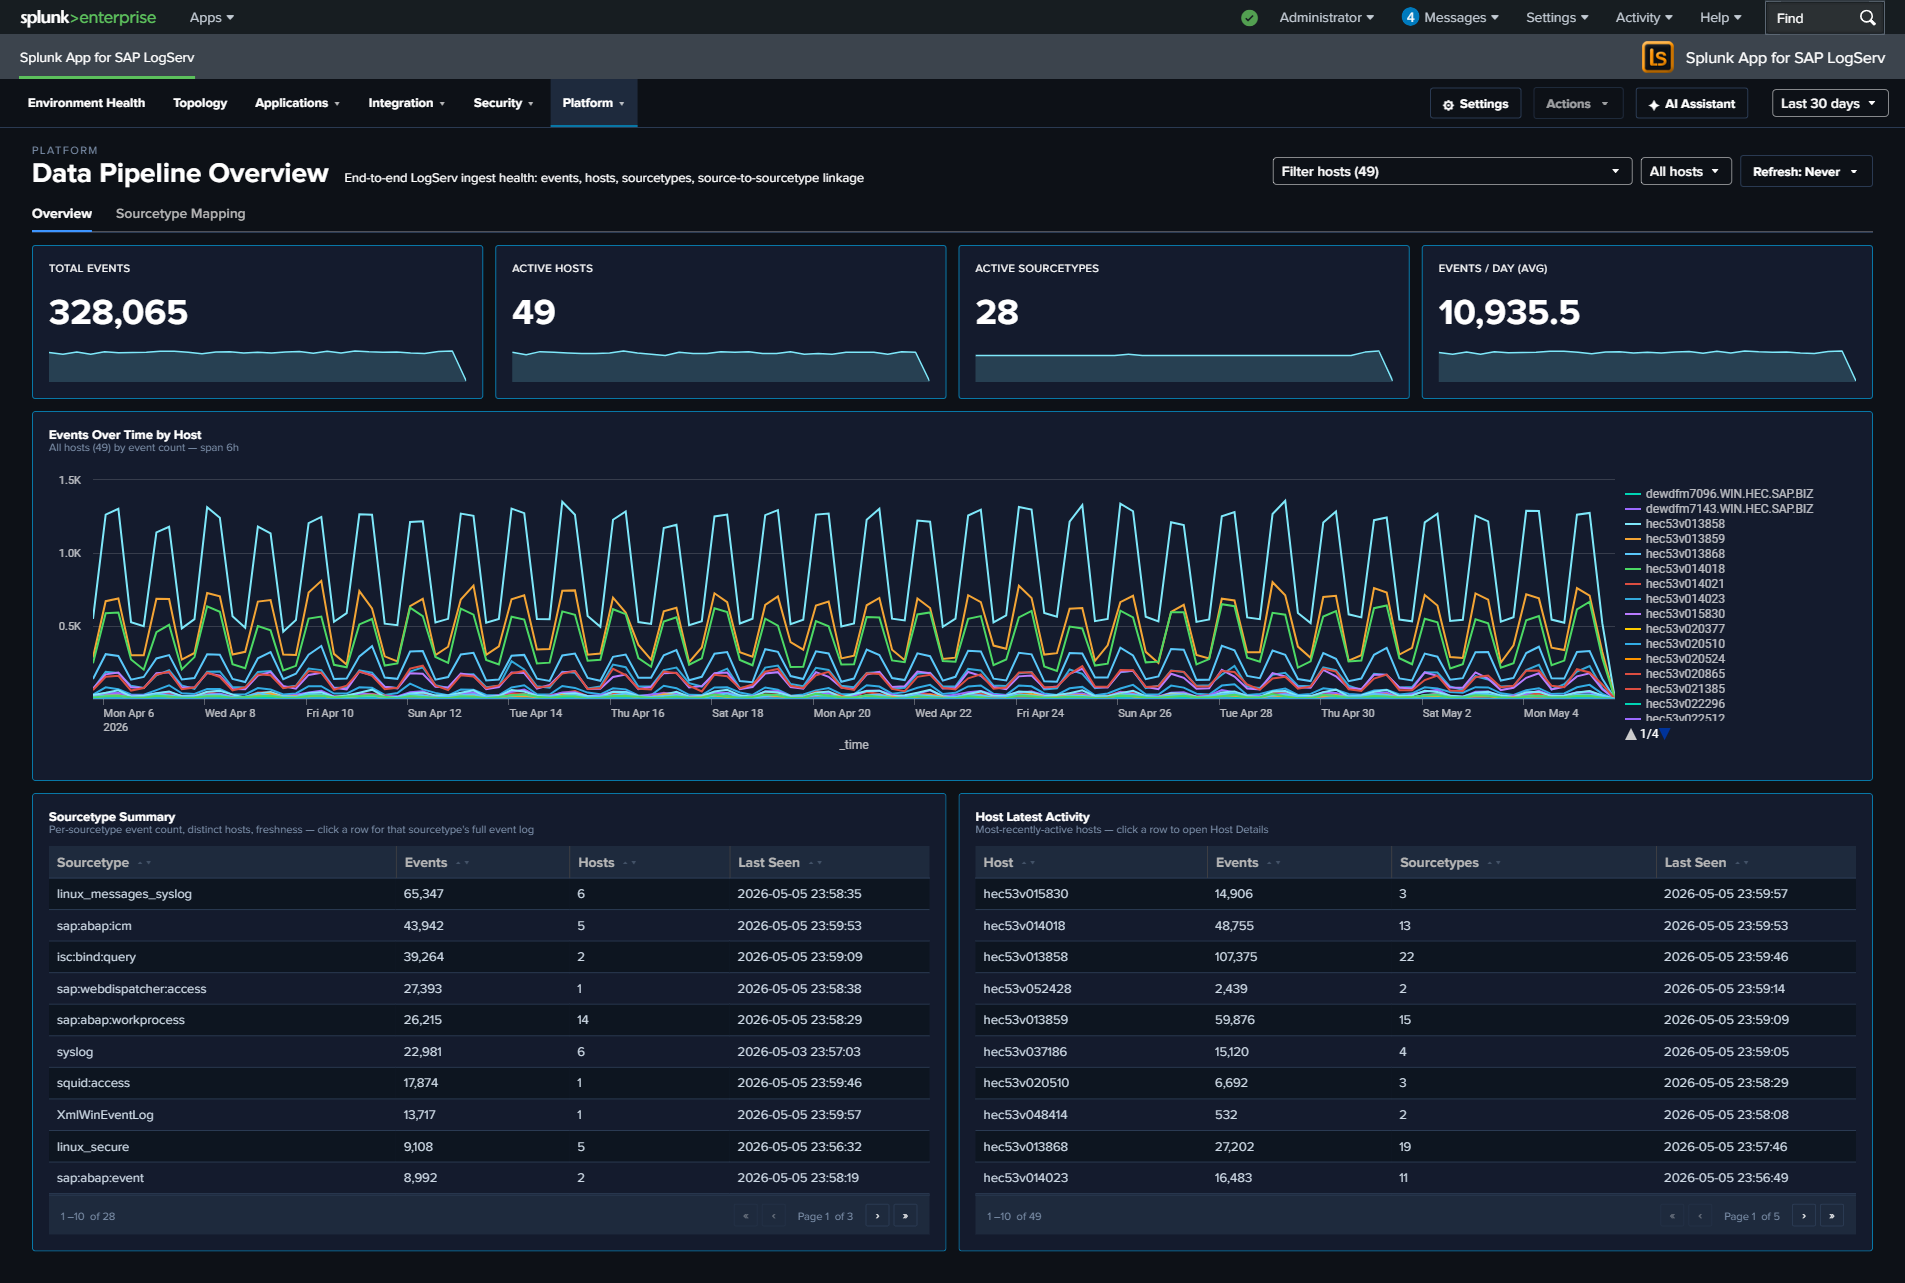
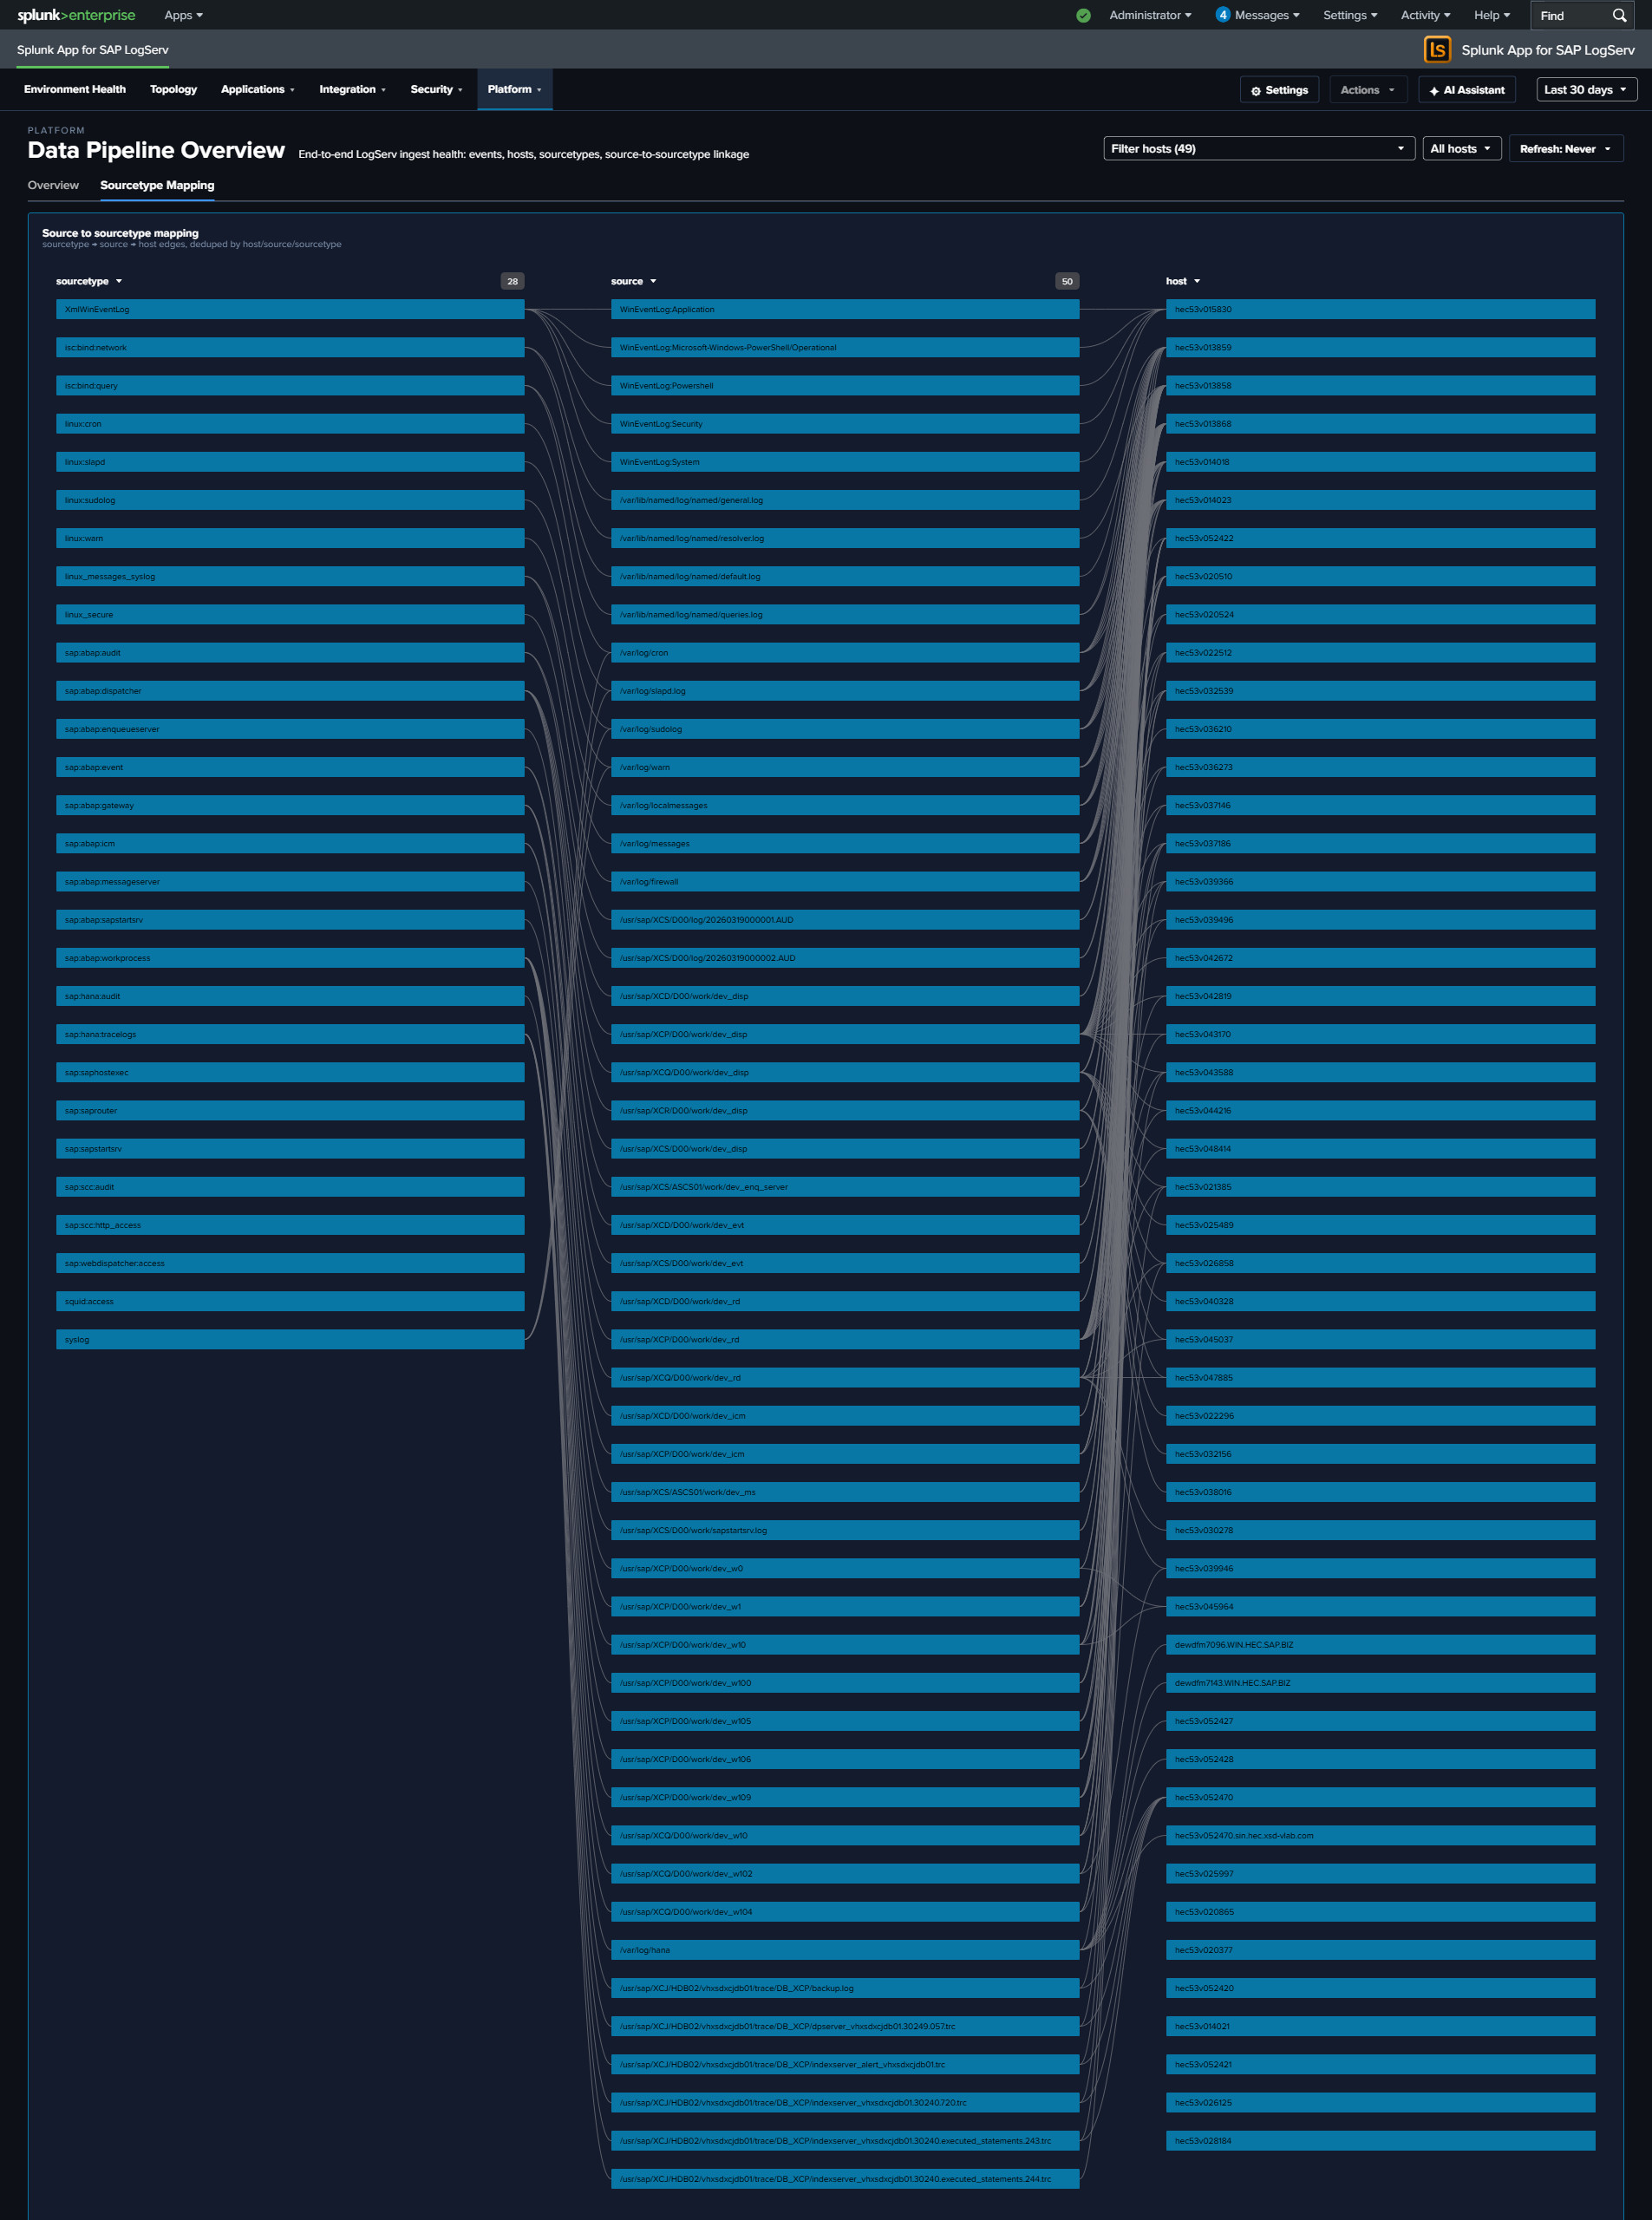
Multi-Cloud Overview¶
Why This Dashboard Matters¶
The Multi-Cloud Overview dashboard answers the question: “Where is our LogServ data coming from, and is it balanced between cloud providers?” It splits ingest by the indexed cloud_provider field so admins running both AWS S3 and Azure Blob Storage ingest can confirm both pipelines are healthy and see relative volume at a glance.
Customers running a single cloud see the dashboard collapse cleanly to one provider (the unused-provider KPI shows 0, the other provider’s series carries the trend chart). Customers running both clouds — common during a migration or in a multi-region SAP landscape — see comparative KPIs + side-by-side trend so they can spot a stalled ingest channel before it becomes a visible gap in their other operational dashboards.
How cloud_provider is attributed
Azure-sourced events carry an indexed cloud_provider = azure field, set by the Splunk TA for SAP LogServ on Azure add-on’s sap_logserv_azure_queue input stanza via _meta = cloud_provider::azure (the add-on injects it automatically). Legacy AWS events without the field are defaulted to aws at search time via the sap_logserv_cloud_provider_default_macro (eval cloud_provider=coalesce(cloud_provider, "aws")). Every panel on this dashboard applies the macro so the AWS/Azure split is always meaningful regardless of when the events landed. To attribute new AWS events explicitly at ingest time (recommended for any new HF rollout), set _meta = cloud_provider::aws on your Splunk_TA_aws SQS-based S3 input stanzas — see the Azure Setup Guide for the full configuration pattern (the same pattern applies symmetrically to both clouds). Alternatively, the LogServ Data TA’s Configuration → Cloud Provider dropdown (AWS / Microsoft Azure / Not set) stamps cloud_provider on every event the TA processes — the simpler, TA-managed option for a Heavy Forwarder that ingests from a single cloud. See Configuring Filters → Cloud Provider Attribution.
Panels¶
- Total Events – Aggregate event count across BOTH ingest channels with a daily-volume sparkline. Useful as the baseline for comparing the two per-provider KPIs that follow.
- AWS Events – Event count where
cloud_provider = "aws"(includes events explicitly attributed at ingest time AND legacy events defaulted via the macro). Sparkline shows daily AWS-only volume. - Azure Events – Event count where
cloud_provider = "azure". Sparkline shows daily Azure-only volume. On a single-cloud-AWS install, this KPI shows0with a flat-zero sparkline. - Daily Event Volume by Cloud Provider – Stacked column chart showing daily event counts split AWS vs Azure. Each bar is the day’s total; the AWS and Azure segments stack to make the per-provider contribution visible. Useful for spotting day-over-day shifts (a sudden drop in one provider’s stack height while the other stays flat = that provider’s ingest stalled).
- Event Count by Provider – Two-row table with the raw cumulative event counts. The same data as the AWS Events / Azure Events KPIs but in tabular form so the per-provider ratio is easy to read.
- Distinct Hosts by Provider – Two-row table showing how many unique
hostvalues reported under eachcloud_provider. Confirms forwarder coverage across the cloud boundary. - Distinct Sourcetypes by Provider – Two-row table showing how many distinct sourcetypes have at least one event per provider. Useful for confirming both clouds are producing the full sourcetype mix (e.g., not just
linux_messages_syslogfrom Azure while AWS has the SAP stack). - About the cloud_provider field – Inline reference panel (not a search result) explaining how the field is set + linking to the Azure Setup Guide. Always visible as a customer-friendly reminder of the attribution mechanic.
- Top Sourcetypes by Cloud Provider – Wide table of the 30 most-active sourcetypes with per-provider columns (AWS Events / Azure Events / Total). The Total column is sorted descending so the high-volume sourcetypes lead. Useful for spotting per-sourcetype anomalies (e.g.,
sap:hana:auditis only appearing under one cloud when both should be producing it).
What to Look For¶
- Stalled ingest channel – If the Azure KPI sparkline goes flat-zero for the most recent 1–3 days while the AWS sparkline continues to climb (or vice versa), the affected channel’s input has likely stalled. Check the LogServ Azure add-on’s
sap_logserv_azure_queueinput on the Heavy Forwarder (or theSplunk_TA_awsS3 input for AWS) — the Azure input logs its per-firing summary tosplunk_ta_sap_logserv_azure_queue.log(Input '<name>' done: messages=N blobs=N events=N ...); for AWS check theS3Inputcomponent inindex=_internal sourcetype=splunkd. - Asymmetric sourcetype coverage – If both clouds report comparable total event counts but the Top Sourcetypes table shows one cloud with a narrow sourcetype mix (e.g., AWS only producing
sap:hana:auditwhile Azure produces 25+ sourcetypes), the AWS-side filter rules may be set to include-only rather than include-all. Check the Configure Filters page. - Unexpected appearance of
awsfrom Azure-only customer – If your environment is Azure-only but the AWS Events KPI shows non-zero values, it likely means some legacy events that pre-date the cloud_provider field landed without explicit attribution and the macro defaulted them toaws. This is benign for trend-reporting (the events are still real), but to keep the labeling accurate you can addcloud_provider::azureto those legacy events via a one-time backfill or simply let them age out per index retention. - Distinct Hosts count substantially lower than expected – If a single cloud’s “Distinct Hosts” count is much lower than the actual count of SAP hosts in that cloud, your add-on input config may be too narrow (wrong container prefix on the Azure side, wrong bucket prefix on the AWS side). Compare against your topology source-of-truth.
- Total Events ≠ AWS Events + Azure Events – This should never happen given the macro defaults legacy events to
aws. If you see a mismatch, check that thesap_logserv_cloud_provider_default_macromacro is loaded in your search head’smacros.conf(the LogServ App ships it indefault/macros.conf). Run| rest /services/configs/conf-macros | search title=sap_logserv_cloud_provider_default_macrofrom a Search Head to confirm.
Drill-Down Behavior¶
Every KPI sparkline and the Daily Event Volume chart respect the dashboard’s global time-range picker + the per-dashboard Refresh picker like any other LogServ App dashboard.
Tables on this dashboard are inventory views — they don’t yet wire click-to-drill-down behavior (because the natural drill destination would be a Splunk search filtered by cloud_provider which most customers will see directly via the macro on any dashboard).
Required Configuration¶
This dashboard works out of the box on any LogServ App install (it gracefully shows 0 for unused providers), but the data quality is governed by the upstream ingest config:
- For Azure ingest: the
_meta = cloud_provider::azureline is present on the[sap_logserv_azure_queue://...]stanza automatically (the LogServ Azure add-on injects it). See Azure Setup Guide. - For explicit AWS attribution (optional): either set the LogServ Data TA’s Configuration → Cloud Provider dropdown to AWS (stamps
cloud_provider = awson every event the TA processes — simplest for a single-cloud Heavy Forwarder), OR add_meta = cloud_provider::awsto eachfiltr2_logserv_s3_*SQS-based S3 input stanza inSplunk_TA_aws’slocal/inputs.conf(use this per-input form when one HF ingests from both clouds). Without either, AWS events get the value via the search-timesap_logserv_cloud_provider_default_macromacro — still correct for this dashboard, but the field is not indexed which means it can’t be used as a filter on raw-event searches outside this dashboard’s macro-wrapped panels. See Configuring Filters → Cloud Provider Attribution. - Macro must be present: the LogServ App’s
default/macros.confdefines[sap_logserv_cloud_provider_default_macro]withdefinition = eval cloud_provider=coalesce(cloud_provider, "aws"). If you’ve overriddenmacros.confin your local app directory, ensure this macro is still defined.
See Azure Setup Guide for the canonical setup procedure (including the cloud_provider attribution pattern that applies symmetrically to both clouds).
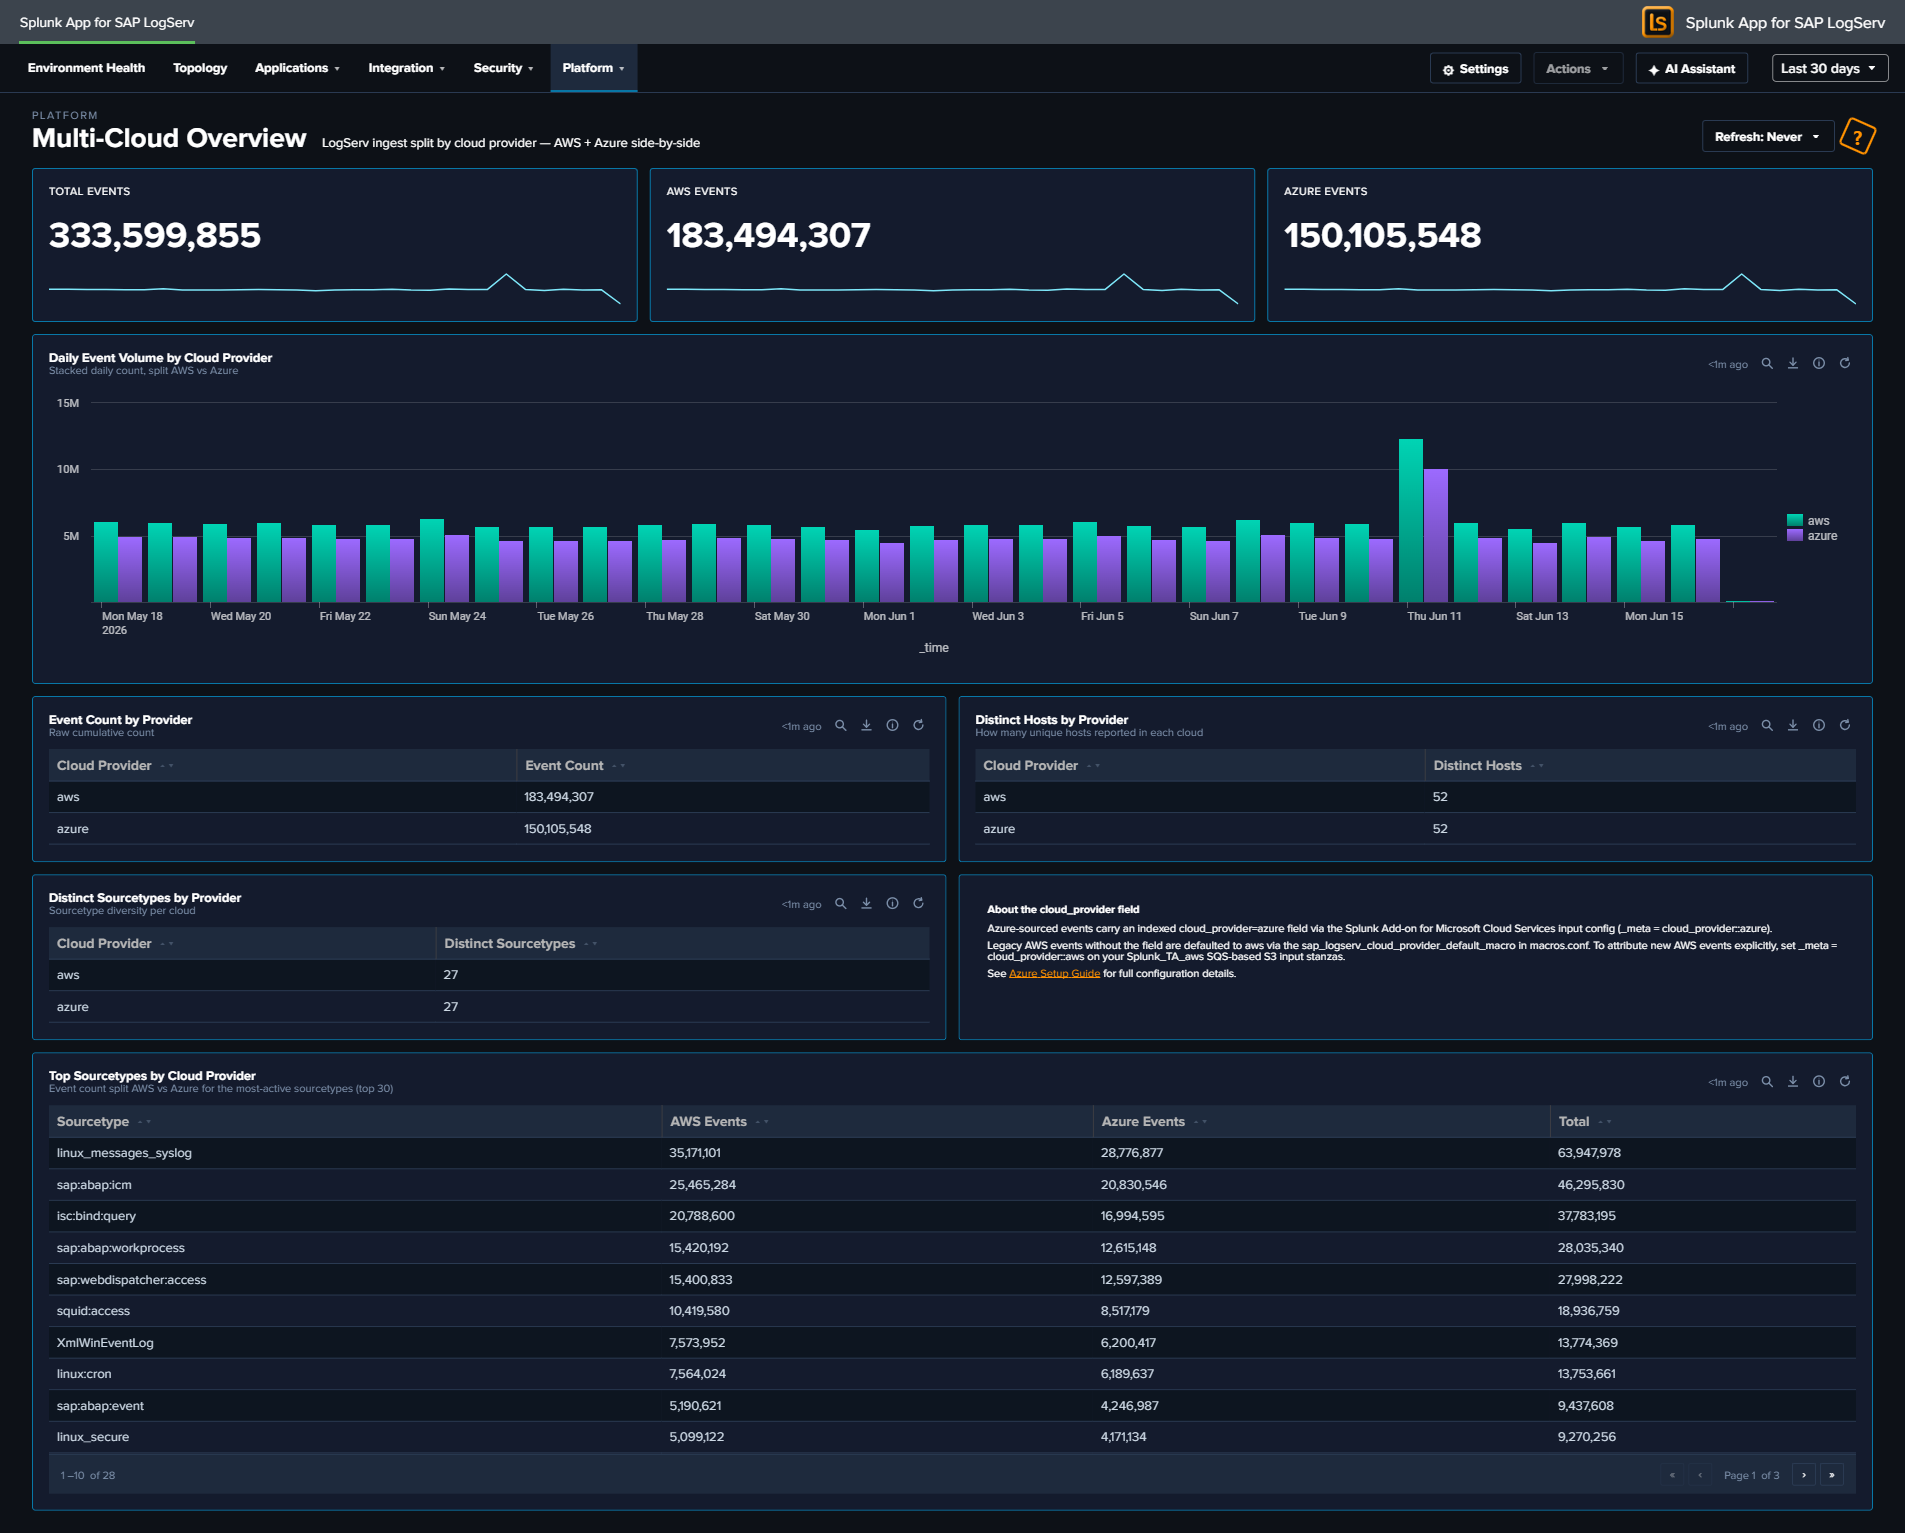
DNS Analytics¶
Why This Dashboard Matters¶
The DNS Analytics dashboard transforms DNS query data into a security detection tool. DNS is used by virtually all network communications and is often exploited by attackers for command-and-control (C2) beaconing, data exfiltration via DNS tunneling, and reconnaissance. Because DNS traffic is rarely inspected by traditional security tools, this dashboard fills a critical visibility gap in SAP infrastructure security.
Panels¶
- Total Queries – Aggregate count of DNS queries in the selected time range
- Unique Clients – Count of distinct client IPs generating DNS queries
- Beaconing Domains – Count of domains exhibiting periodic query patterns consistent with C2 beaconing
- Top 10 Clients - Request Volume – Time-series line chart of the most active DNS clients
- Query Type Distribution – Donut chart showing the breakdown of DNS record types (A, AAAA, PTR, TXT, etc.)
- Top DNS Resolvers – Table of the BIND resolvers (the DNS hosts processing queries) ranked by query count; the
hostfield is the authoritative resolver sincesrc/destare always 127.0.0.1 in this environment - Requests by Record Type – Line chart trending DNS query types (A, AAAA, PTR, MX, etc.) over time
- Beaconing Activity – Bubble chart highlighting domains with regular, periodic query patterns that may indicate C2 beaconing
- Hosts to Beaconing Domains – Full-width bubble chart mapping which hosts are communicating with suspected beaconing domains
- Top Queried Domains – Table of the most looked-up domains with unique client counts
- Top Clients by Domain Diversity – Table ranking clients by number of unique domains queried, with queries-per-domain ratio for DGA detection
What to Look For¶
- Beaconing patterns – The Beaconing Activity panel uses statistical analysis (low variance in query intervals) to detect domains being contacted at regular intervals, which is a hallmark of malware C2 communication. Domains with low variance and high count are the highest priority.
- Unusual record types – TXT record queries at high volume are a common DNS tunneling technique. MX queries from non-mail servers may indicate reconnaissance. Watch the Query Type Distribution donut and the Requests by Record Type line chart for deviations from your normal mix.
- New high-volume clients – A host that suddenly becomes one of the top DNS clients may be compromised and performing domain generation algorithm (DGA) lookups or reconnaissance scanning.
- Multiple hosts reaching beaconing domains – The Hosts to Beaconing Domains panel shows lateral spread. If multiple internal hosts contact the same suspected C2 domain, it suggests widespread compromise.
- High domain diversity – Clients querying many unique domains with a low queries-per-domain ratio in the Top Clients by Domain Diversity table may indicate Domain Generation Algorithm (DGA) activity or automated reconnaissance.
- Resolver imbalance – The Top DNS Resolvers table should show an expected workload split across your BIND servers. One resolver handling disproportionate load may indicate a misconfigured forwarder or a cluster failover that wasn’t noticed.
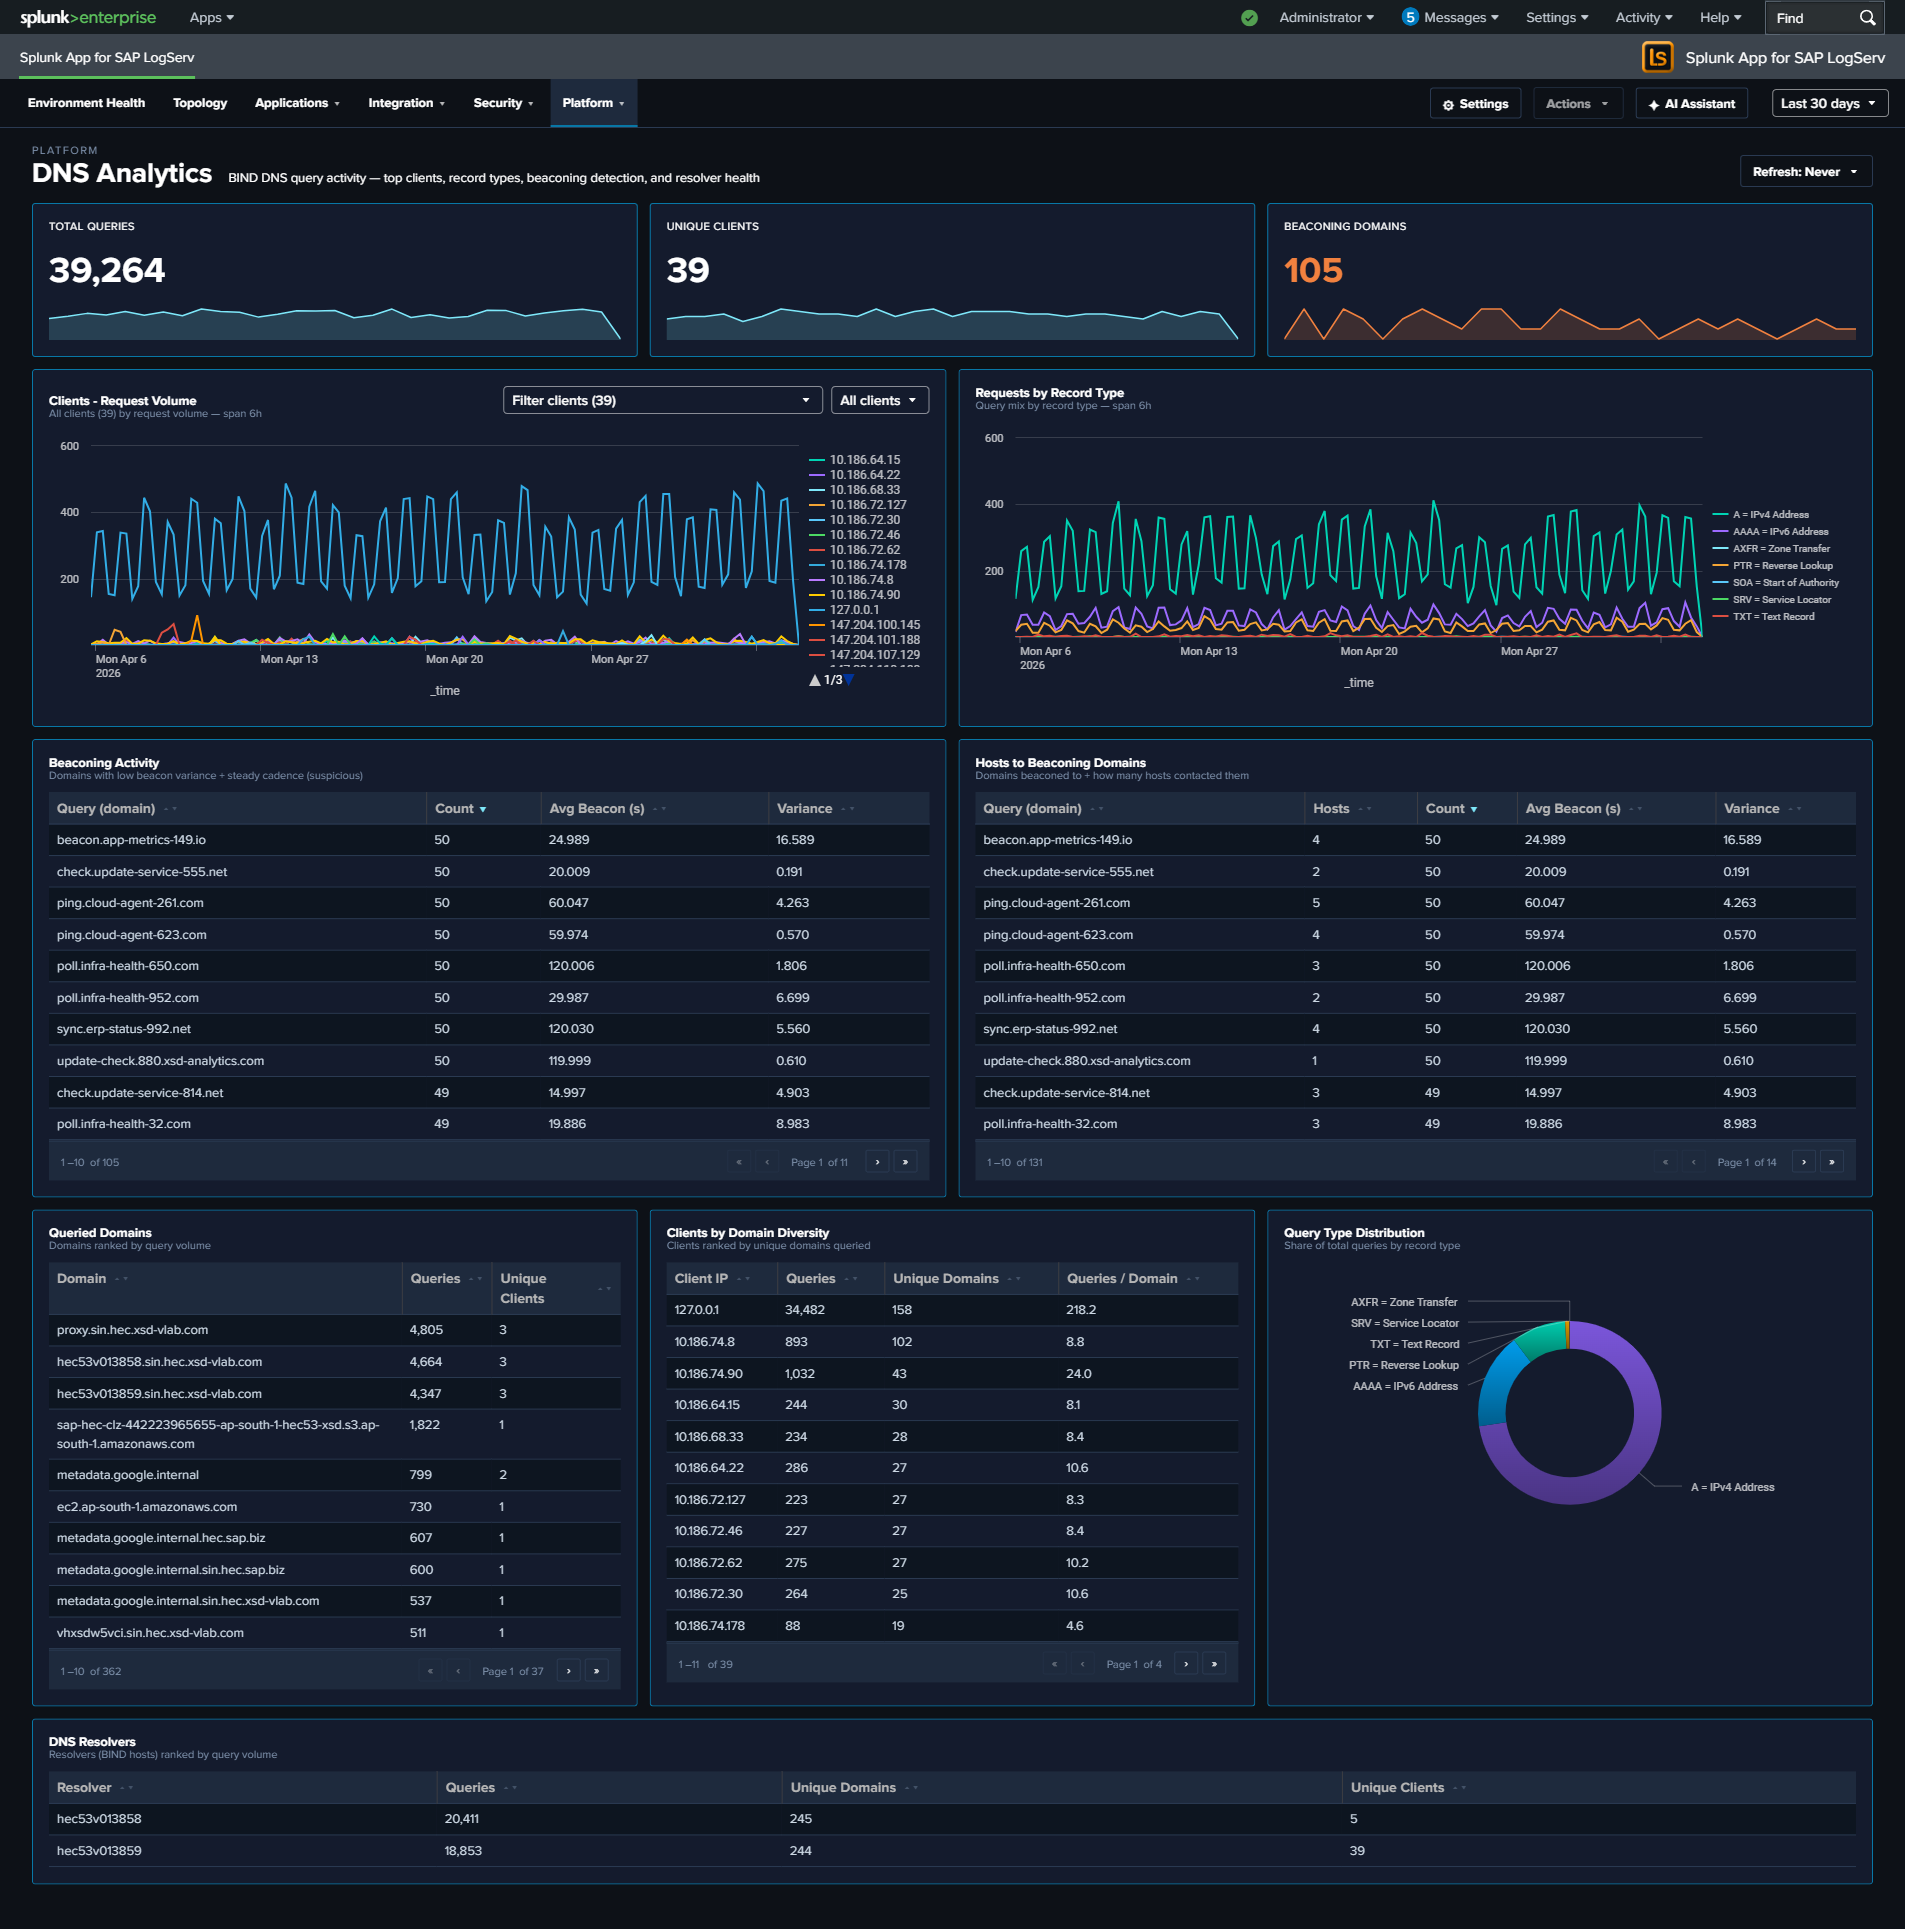
Linux System & Security¶
Why This Dashboard Matters¶
The Linux dashboard provides OS-level visibility for the hosts running SAP applications. Most SAP ABAP and HANA systems run on Linux, making OS-level monitoring essential for understanding the infrastructure beneath the application layer. This dashboard combines SAP-aware context (SID, instance, application identification from syslog) with kernel-level security monitoring (firewall drops and kernel events).
Panels¶
- Total Events – Aggregate event count across all Linux sourcetypes
- Firewall Drops – Count of kernel firewall drop events
- Active Hosts – Count of distinct Linux hosts reporting data
- Top Drop Source – Single-value panel showing the #1 source IP by firewall-drop count in the format
<IP> (<count>), e.g.10.186.64.6 (8,522). This surfaces the dominant drop source directly in the KPI row so it doesn’t get buried in the table. Click the KPI to drill down to all source IPs ranked by drop count. - Event Volume by Sourcetype – Daily trend across
linux_messages_syslogplus the v0.0.5.0 Path-B sourcetypes (linux:cron,linux:warn,linux:sudolog,linux:slapd) andlinux_secure. The legacysyslogsourcetype is OR-ed alongside the new sourcetypes during the transition; existingsourcetype=syslogindexed data ages out per index retention. - SAP Application Activity – Column chart showing event distribution by SAP application and SID
- SAP Instance Distribution – Table of SAP instances with event counts by SID, instance number, and CID
- Firewall Drops Over Time – Timeline of kernel firewall drop events
- Kernel Event Types – Pie chart breakdown of kernel event categories (IN_DROP, segfault, etc.)
- Top Blocked Sources – Table of source IPs being blocked by the firewall with target counts and protocols
- Top Blocked Destination Ports – Table of destination ports targeted by blocked traffic
What to Look For¶
- Firewall drop spikes – A sudden increase in blocked connections may indicate port scanning, network reconnaissance, or a brute-force attack against SAP services.
- Top Drop Source concentration – If the Top Drop Source KPI shows a single IP accounting for the overwhelming majority of drops, that IP is either a misconfigured internal system hammering a blocked port (check if it’s an internal SAP host that recently changed config) or a persistent external scanner. Click through to see the distribution.
- New blocked source IPs – Unfamiliar source IPs appearing in the Top Blocked Sources table should be investigated, especially if they target SAP service ports (3200-3299 for dialog, 8000-8099 for HTTP, 30015 for HANA).
- SAP application distribution changes – If the SAP Application Activity chart shows a previously active SID or application going silent, it may indicate a process crash or configuration issue.
- Kernel segfaults – Segmentation faults appearing in the Kernel Event Types panel indicate application crashes, which may affect SAP system stability.
- Port targeting patterns – The Top Blocked Destination Ports table reveals which services attackers are targeting. Ports associated with SAP services warrant immediate attention.
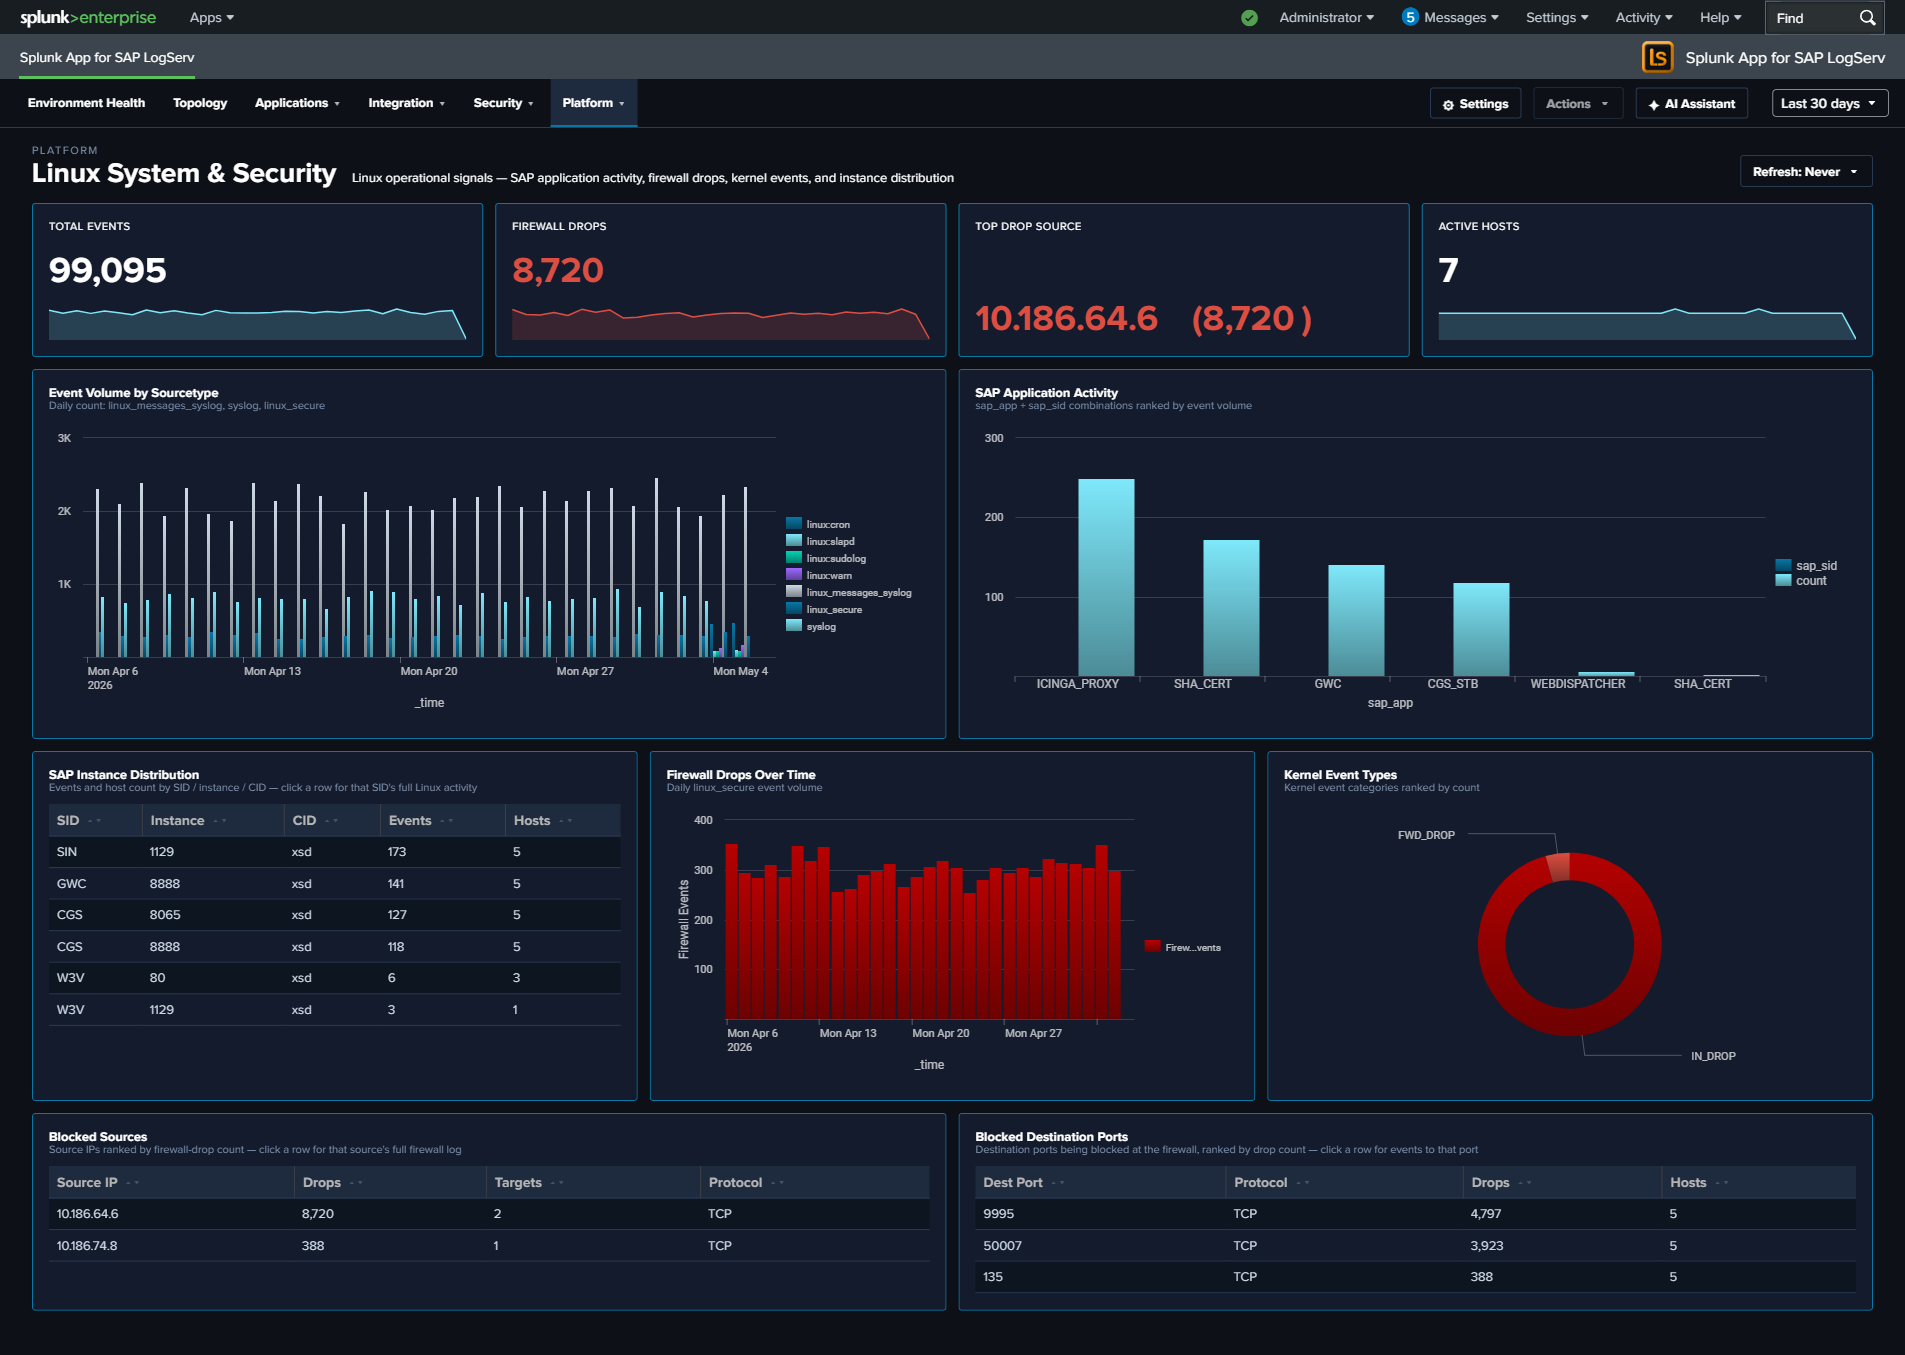
Windows Events¶
Why This Dashboard Matters¶
The Windows Events dashboard monitors Windows hosts in the SAP landscape, which commonly run SAP application servers, database instances, and management consoles. Windows Event Logs capture service health, PowerShell execution, and system errors that indicate Windows-specific operational issues. This dashboard focuses on operational health and service state – the authentication-failure story is owned by the Cross-Stack Authentication dashboard so that all three layers (SAP / HANA / Windows) can be investigated together.
Requires the Splunk Add-on for Microsoft Windows on the Search Head
Several panels here depend on the Splunk Add-on for Microsoft Windows (Splunkbase 742) being installed on the Search Head tier. The LogServ App ships no XmlWinEventLog field extraction of its own — EventCode and severity are search-time fields provided by add-on 742 (its xmlwindows_severities.csv lookup maps the event <Level> to severity: 1→critical, 2→high, 3→medium, 0/4/5→informational).
Without add-on 742 on the search tier, Windows events still index fine and the Total Events, Event Volume by Log, Active Hosts, and PowerShell Activity panels populate (they read envelope fields), but the Top Event Codes table shows EventCode=(none) for every row and the Severity Distribution, Critical / Error, and Service Events panels stay empty.
Tier matters: EventCode/severity are search-time extractions, so add-on 742 must be on the Search Head — installing it on a Heavy Forwarder or indexer does nothing for these panels. On Splunk Cloud, install it on the Cloud SH via self-service app management (it is replicated to the indexer search peers through the knowledge bundle). After installing it, re-run the Windows and Environment Health rollups (Settings → Dashboard Data → Run backfill) so the cached panels pick up the now-extracted fields. See the Quick Install Reference package matrix.
Panels¶
- Total Events – Aggregate Windows event count
- Critical / Error – Count of critical and error severity events
- Active Hosts – Count of distinct Windows hosts reporting data
- Event Volume by Log – Daily trend by Windows log source (Application, Security, System, PowerShell)
- Severity Distribution Over Time – Stacked column chart of severity levels
- Top Event Codes – Featured full-width table of the most frequent EventCodes with 7 enriched columns: Event Code, Description (signature), Source log, Severity, Events, Hosts (distinct count), Last Seen. Row drilldown opens the search app filtered by that event code.
- Service Events – Table of Windows service start/stop activity with latest state
- PowerShell Activity – Line chart trending PowerShell event volume
What to Look For¶
- High-frequency Event Codes – The Top Event Codes table is the primary starting point. EventCode 7031 / 7034 (service terminated unexpectedly), 1000 (application crash), and 41 (unexpected shutdown) are high-priority. Click through to see every occurrence of a specific code.
- Service crashes – EventCode 7031 (service terminated unexpectedly) in either the Top Event Codes table or the Service Events panel indicates a critical service failure. For SAP services (sapstartsrv, SAPService), this requires immediate attention.
- PowerShell activity spikes – Sudden increases in PowerShell execution may indicate lateral movement by an attacker using PowerShell-based attack tools. Correlate with the Cross-Stack Authentication dashboard to see whether any Windows logons were concurrent.
- Critical/error severity trends – A rising trend in critical and error events over multiple days indicates accumulating system health issues that need proactive investigation.
- Event Code hosts expanding – The Hosts column on the Top Event Codes table makes it obvious when a normally-host-isolated error starts appearing on multiple hosts – a sign the underlying cause is environmental (failed update, domain policy change) rather than local.

Proxy Analytics¶
Why This Dashboard Matters¶
The Proxy Analytics dashboard monitors outbound internet access through the Squid proxy server. In SAP environments, proxy logs reveal which systems and users are accessing external resources, enabling detection of data exfiltration attempts, policy violations (unauthorized internet access), and compromised systems communicating with malicious infrastructure. Proxy logs complement DNS analytics by showing the actual HTTP connections that follow DNS resolution.
Panels¶
- Total Requests – Aggregate proxy request count
- Total Bandwidth – Sum of bytes transferred through the proxy (formatted KB/MB/GB)
- Denied Requests – Count of requests blocked by proxy policy
- Request Volume Over Time – Daily request trend
- Status Code Distribution – Stacked column chart of response categories (2xx-5xx)
- Top Domains – Table of the most accessed domains with request counts, bandwidth, and unique client counts
- Top Clients – Table of the most active client IPs with request counts, bandwidth, and domain diversity
- Top Clients by Domain Diversity – Horizontal bar chart ranking client IPs by the distinct count of URL domains they accessed (replaces the earlier HTTP Methods donut, which consistently collapsed to a single slice and didn’t earn its space)
- Cache Action Distribution – Column chart of Squid vendor-action values (CONNECT, TCP_HIT, TCP_MISS, TCP_REFRESH_MISS, etc.) – replaces the earlier Content Types donut for the same single-slice reason and reveals cache-hit behavior
- Bandwidth Over Time – Line chart trending total bytes transferred
- Top URL Domains by Bytes Out – Horizontal bar chart of the top 10 URL domains by outbound bytes (data exfiltration detection surface)
- Bandwidth Over Time by Domain (Top 5) – Multi-line chart of the top 5 bandwidth-consuming domains over time – pairs with Top URL Domains by Bytes Out to show whether exfiltration is ongoing or historical
What to Look For¶
- Denied request spikes – A sudden increase in denied requests may indicate a compromised system attempting to reach blocked destinations, or a policy change affecting legitimate traffic.
- High-bandwidth domains – The Top URL Domains by Bytes Out panel is tuned specifically for exfiltration detection. A new domain appearing near the top, or a known-OK domain spiking, warrants investigation.
- Sustained-bandwidth domains – The Bandwidth Over Time by Domain chart shows whether a top domain’s traffic is steady (expected service) or a sudden burst (exfiltration attempt, large file transfer).
- Client domain diversity – A client IP with extremely high domain diversity in the Top Clients by Domain Diversity panel is unusual for a well-behaved SAP server – most production systems talk to a predictable small set of external domains.
- Cache miss dominance – If Cache Action Distribution is dominated by TCP_MISS, the proxy cache may not be earning its keep (or a new workload is defeating it). For security-relevant investigations, CONNECT dominance signals mostly-HTTPS traffic that the proxy can’t inspect.
- New high-volume clients – A system that suddenly appears as a top proxy client may be compromised and performing outbound scanning, beaconing, or data exfiltration.
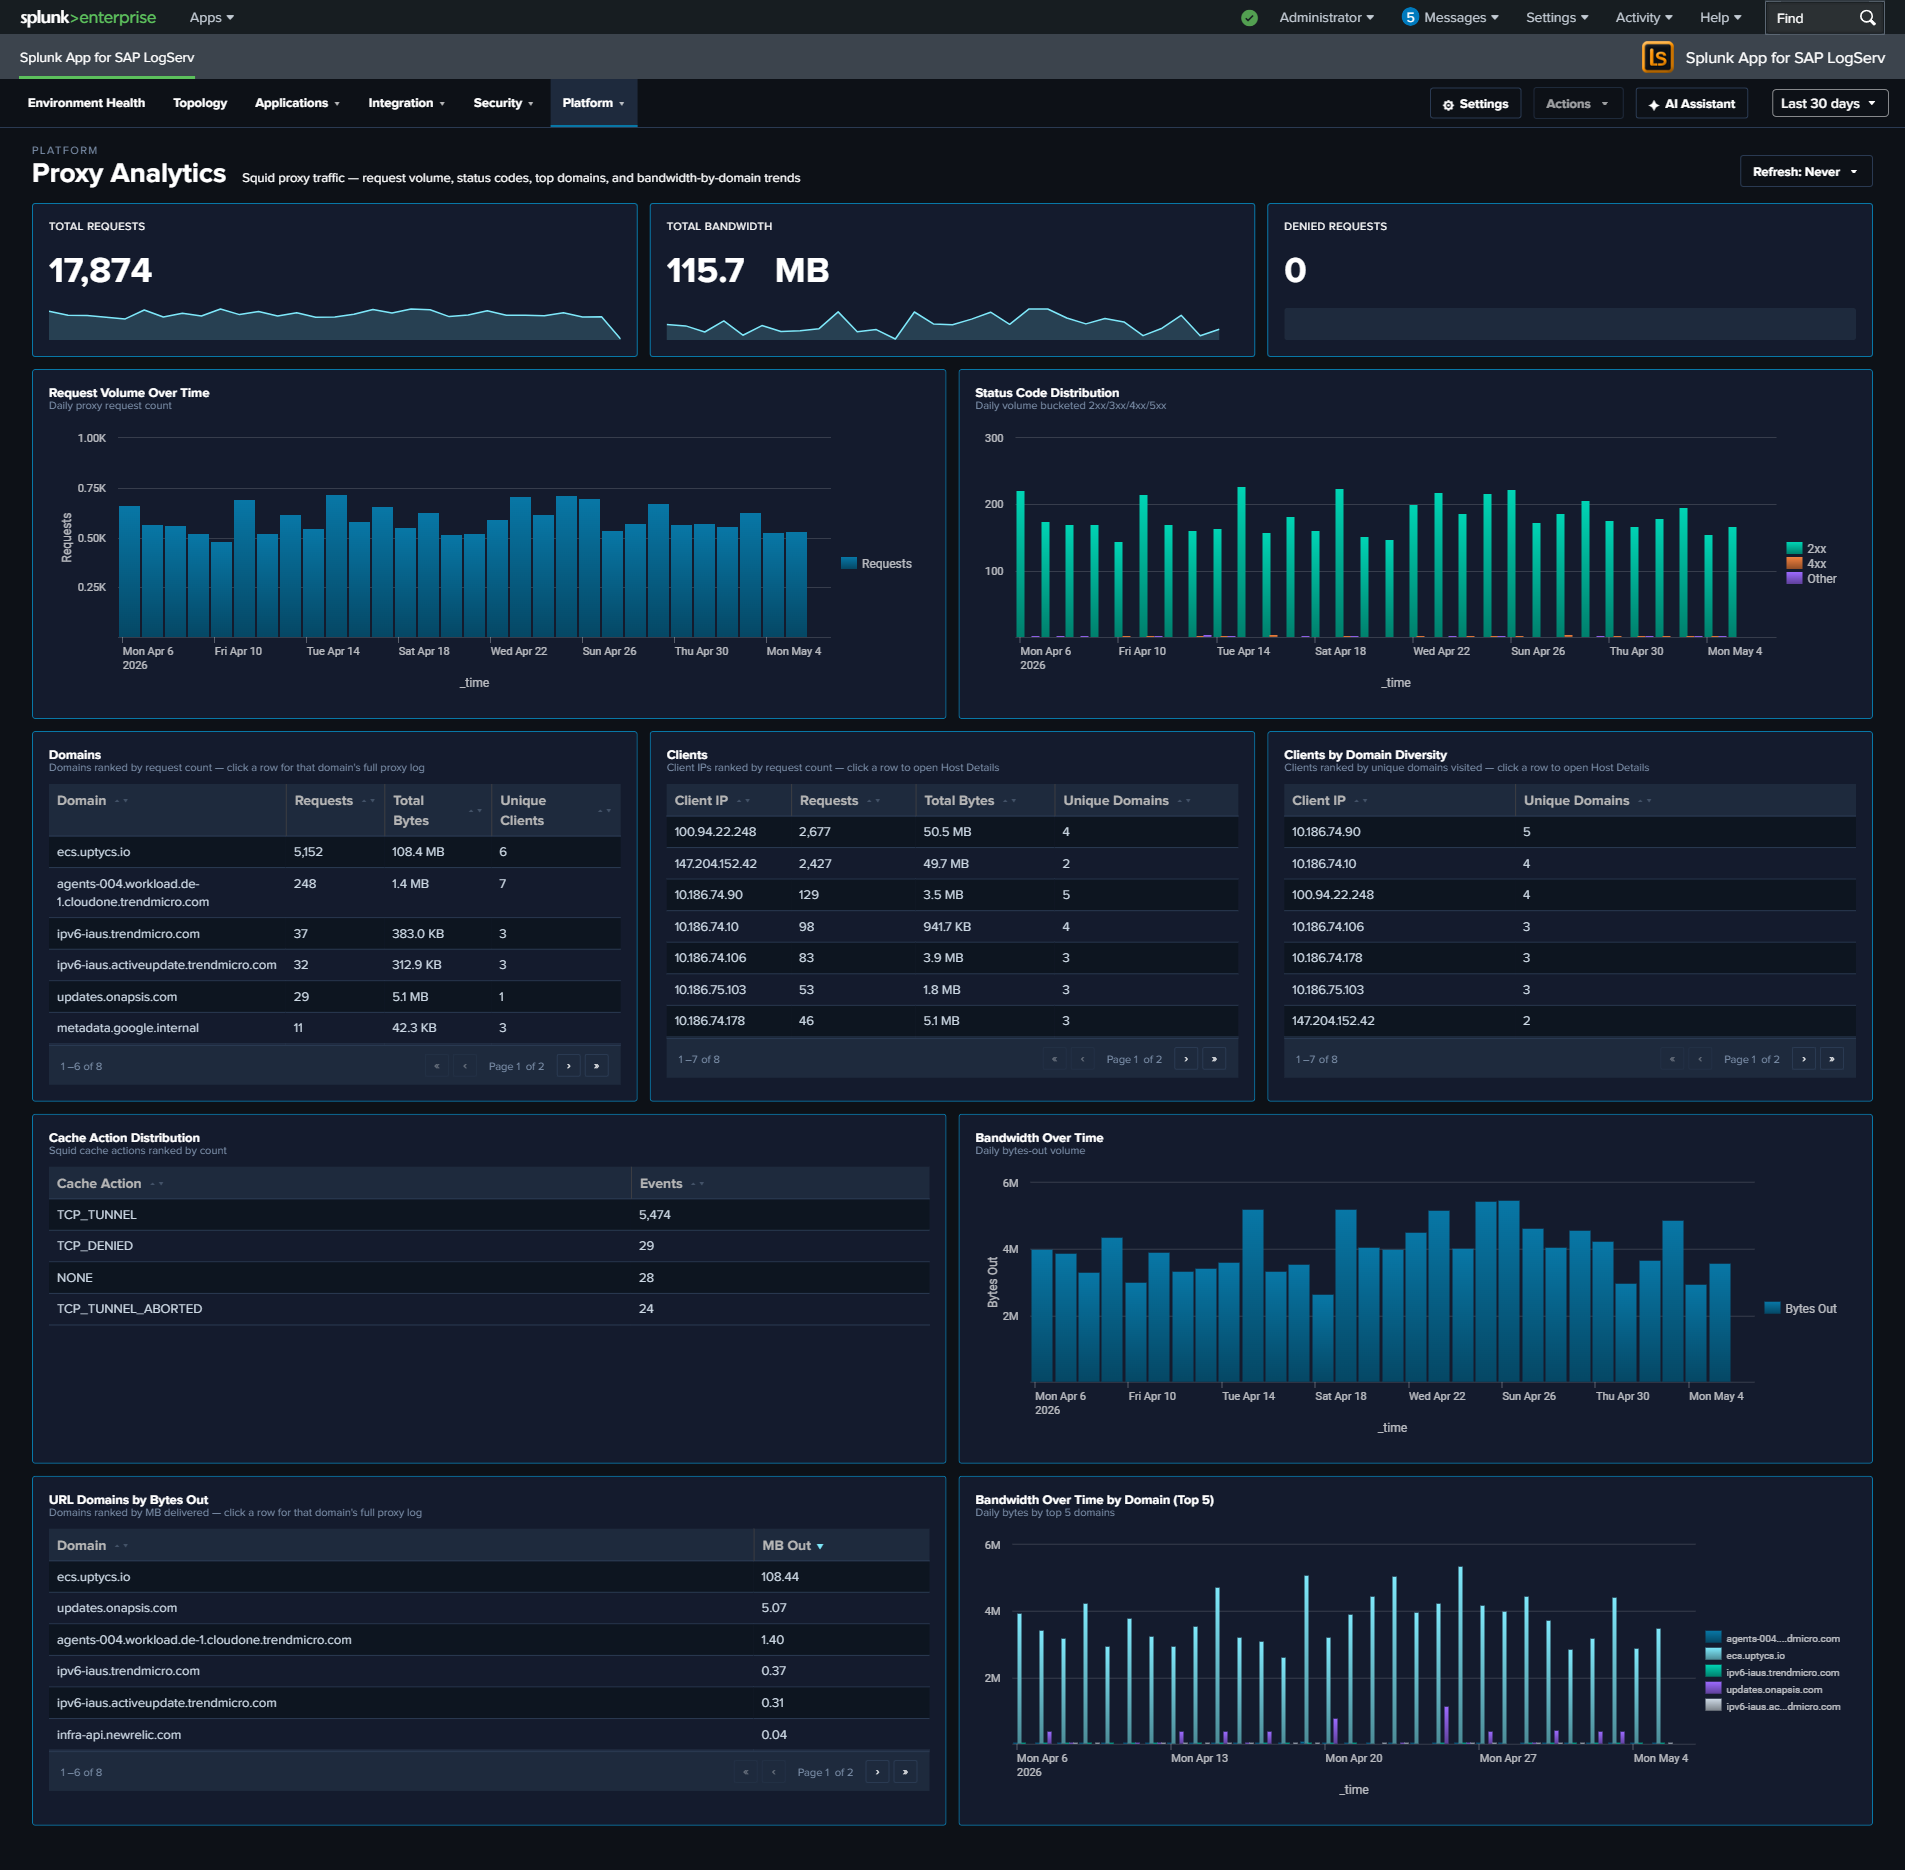
Host Details¶
Why This Dashboard Matters¶
The Host Details dashboard is the forensic drill-down tool for investigating one or more hosts. Accessed by clicking a host row in any dashboard’s host-keyed table (Data Pipeline Overview, Cross-Stack Authentication, Environment Health, etc.) or by selecting hosts from the title-row Multiselect, it surfaces event volume, data freshness, authentication activity, inventory, errors, and role-specific signals (HANA audit, ABAP work process, web dispatcher traffic, etc.) for the selected scope. This view is essential for root cause analysis, incident response, capacity investigations, and validating that all expected data sources are present.
The title-row host picker is a Multiselect (with filter input + Select All Matches) supporting three scopes:
- All Hosts (no hosts selected) — Top-N kicks in (default Top 10) and panels aggregate across the most-active hosts.
- Single host — splices
host="X"into all SPL; URL becomes?host=X(back-compatible deep-link form). - Multiple hosts — splices
host IN ("X","Y","Z")into all SPL; URL becomes?hosts=h1,h2,h3(CSV form). LocalStorage persists the last selection per browser tab.
The dashboard is organized into three tabs:
- Overview – universal panels that populate for any host with any event: KPIs, event timeline, severity breakdown, inventory, authentication and error tables, top sources, activity-by-hour, and data-freshness checks.
- Role Activity – panels scoped to a specific role (HANA, ABAP, Web Dispatcher, SAP Router, Windows, Linux sudo, DNS). Each panel auto-hides when the selected host(s) have no data for that role, so the tab only shows what’s relevant for the host(s) in front of you.
- Sourcetype Mapping – Link graph showing the distribution of events across sourcetypes and sources for the selected host(s).
Overview Tab¶
- KPI row (5 values) – Total Events, Data Volume (auto-scaled MB/GB), Active Sourcetypes, Error/Critical event count (red), and Auth Failure count (red)
- Host Event Count by Sourcetype – Stacked column of daily event volume per sourcetype for the selected host
- Severity Timeline – Stacked area chart normalizing Critical / Error / Warning / Info severities across all the host’s sourcetypes
- Host Inventory – Table of hardware specs (CPU, cores, RAM), EC2 instance type, OS, region, and availability zone. Sourced from osquery data in
linux_messages_syslog. - Recent Authentication Events – Cross-source auth activity table (HANA / Linux / Windows), with a Layer column identifying the source
- Recent Errors & Criticals – Latest ERROR/CRITICAL/FATAL events across all the host’s sourcetypes with severity, component, and truncated message
- Top Sources – Horizontal bar of the host’s most active log sources by event count
- Activity by Hour of Day – Column chart surfacing off-hours activity patterns
- Data Freshness – Per-sourcetype last-seen table with Fresh/Stale/Very Stale status to spot collection gaps
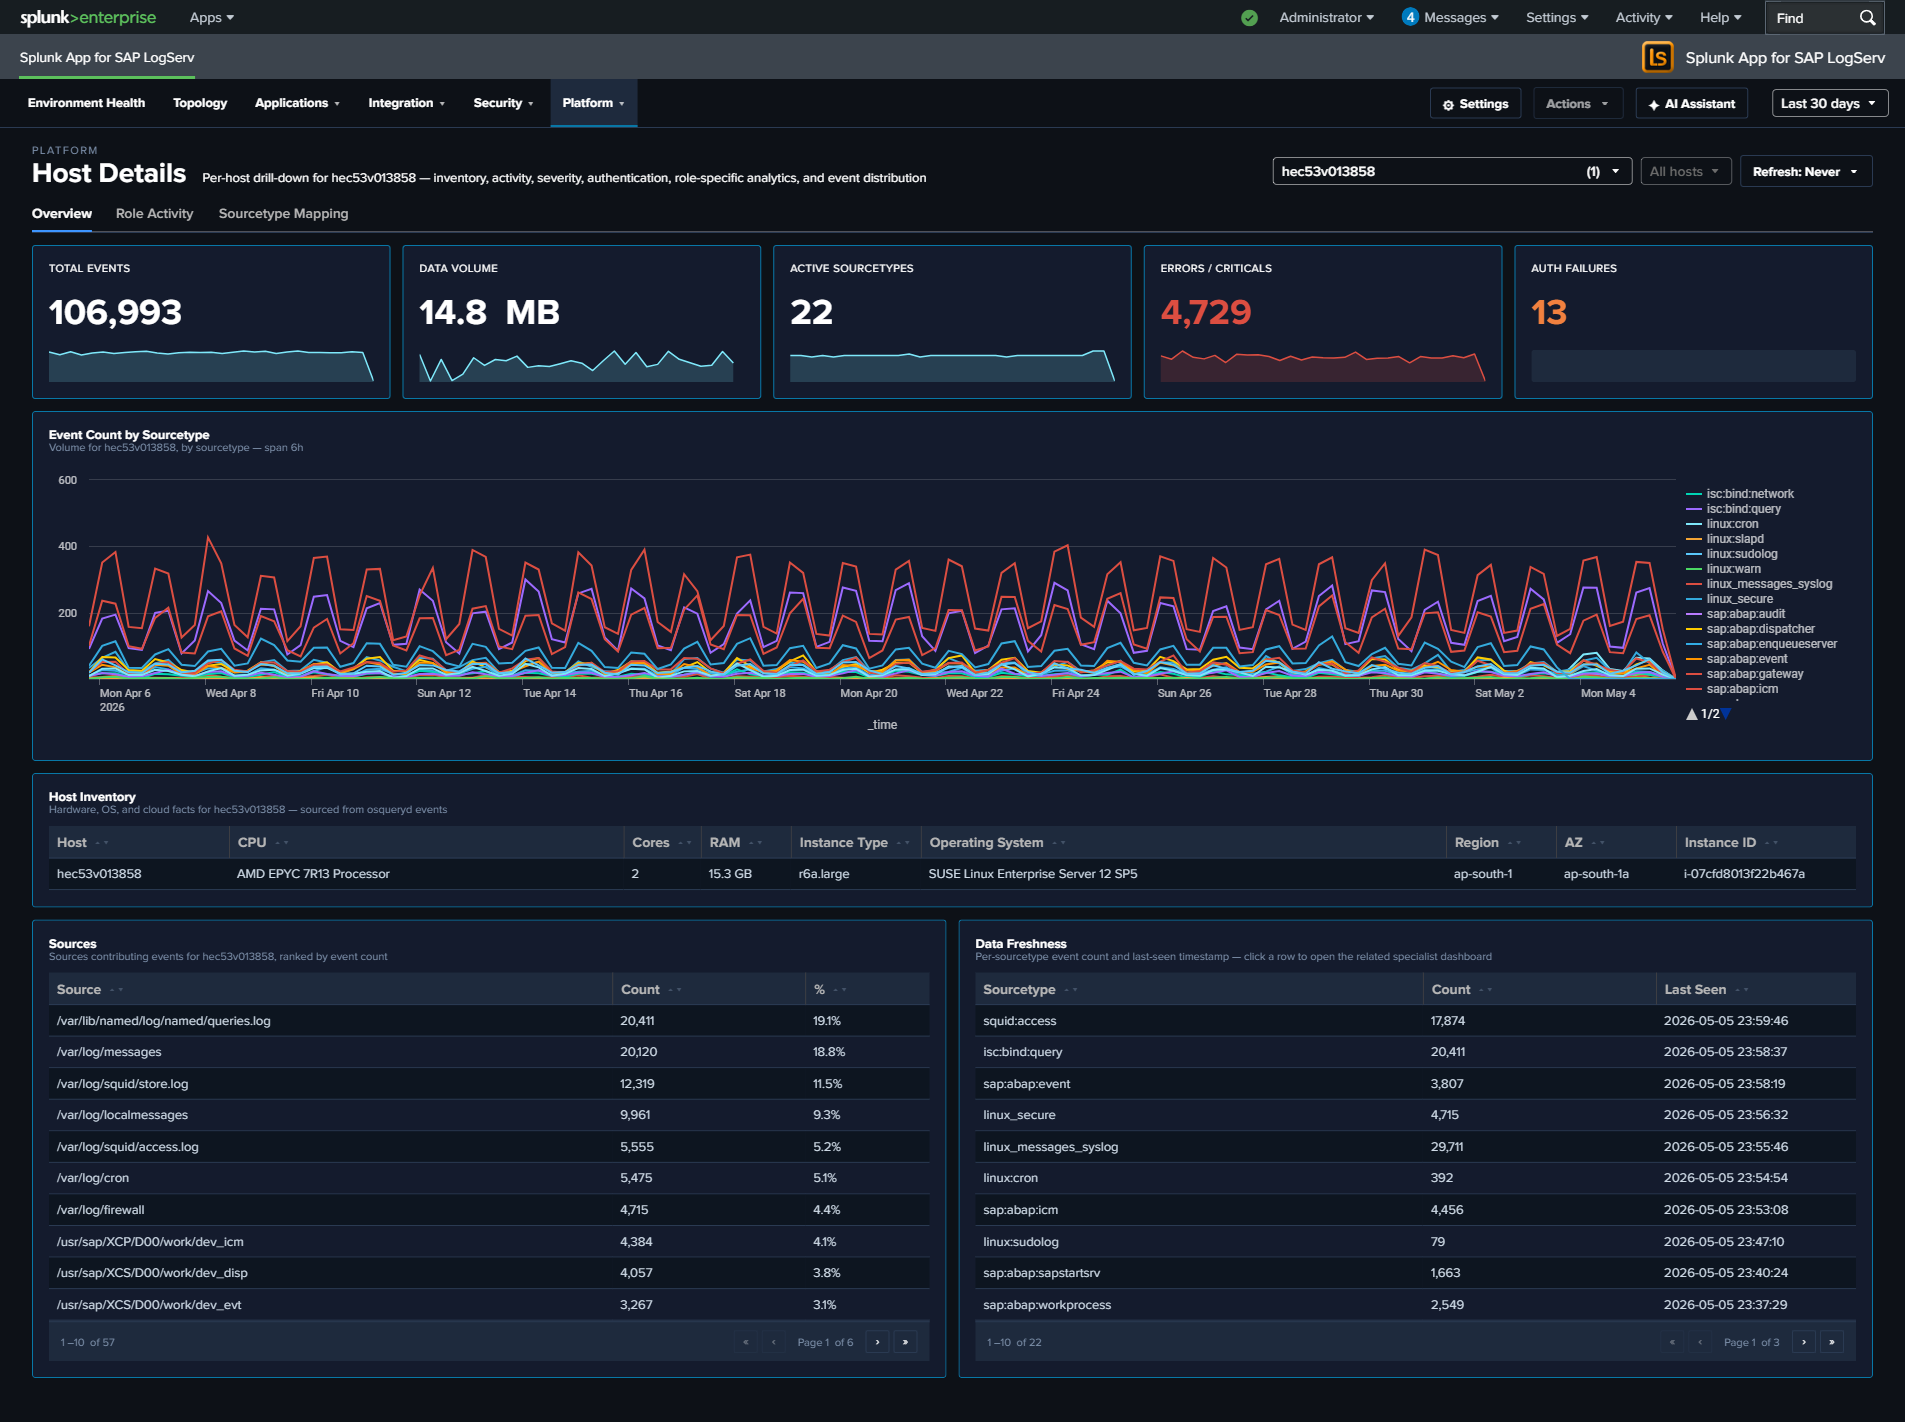
Role Activity Tab¶
Role-specific panels. Each panel only appears when the host has data for that role; irrelevant panels auto-hide.
- HANA Audit Activity (Top Actions) – Column chart of top audit actions from
sap:hana:audit - ABAP Work Process Mix – Horizontal bar of work-process categories from
sap:abap:workprocess - Web Dispatcher Traffic by Status – Stacked column (2xx/3xx/4xx/5xx) from
sap:webdispatcher:access - SAP Router Peers – Connection counts by peer IP from
sap:saprouter - Windows Event Codes (Top 15) – Column chart of top
EventCodevalues fromXmlWinEventLog* - Sudo Commands – Table of invoking user, target user, command, and count from
linux_messages_syslogsudo events - DNS Top Queries – Top query strings from
isc:bind:query
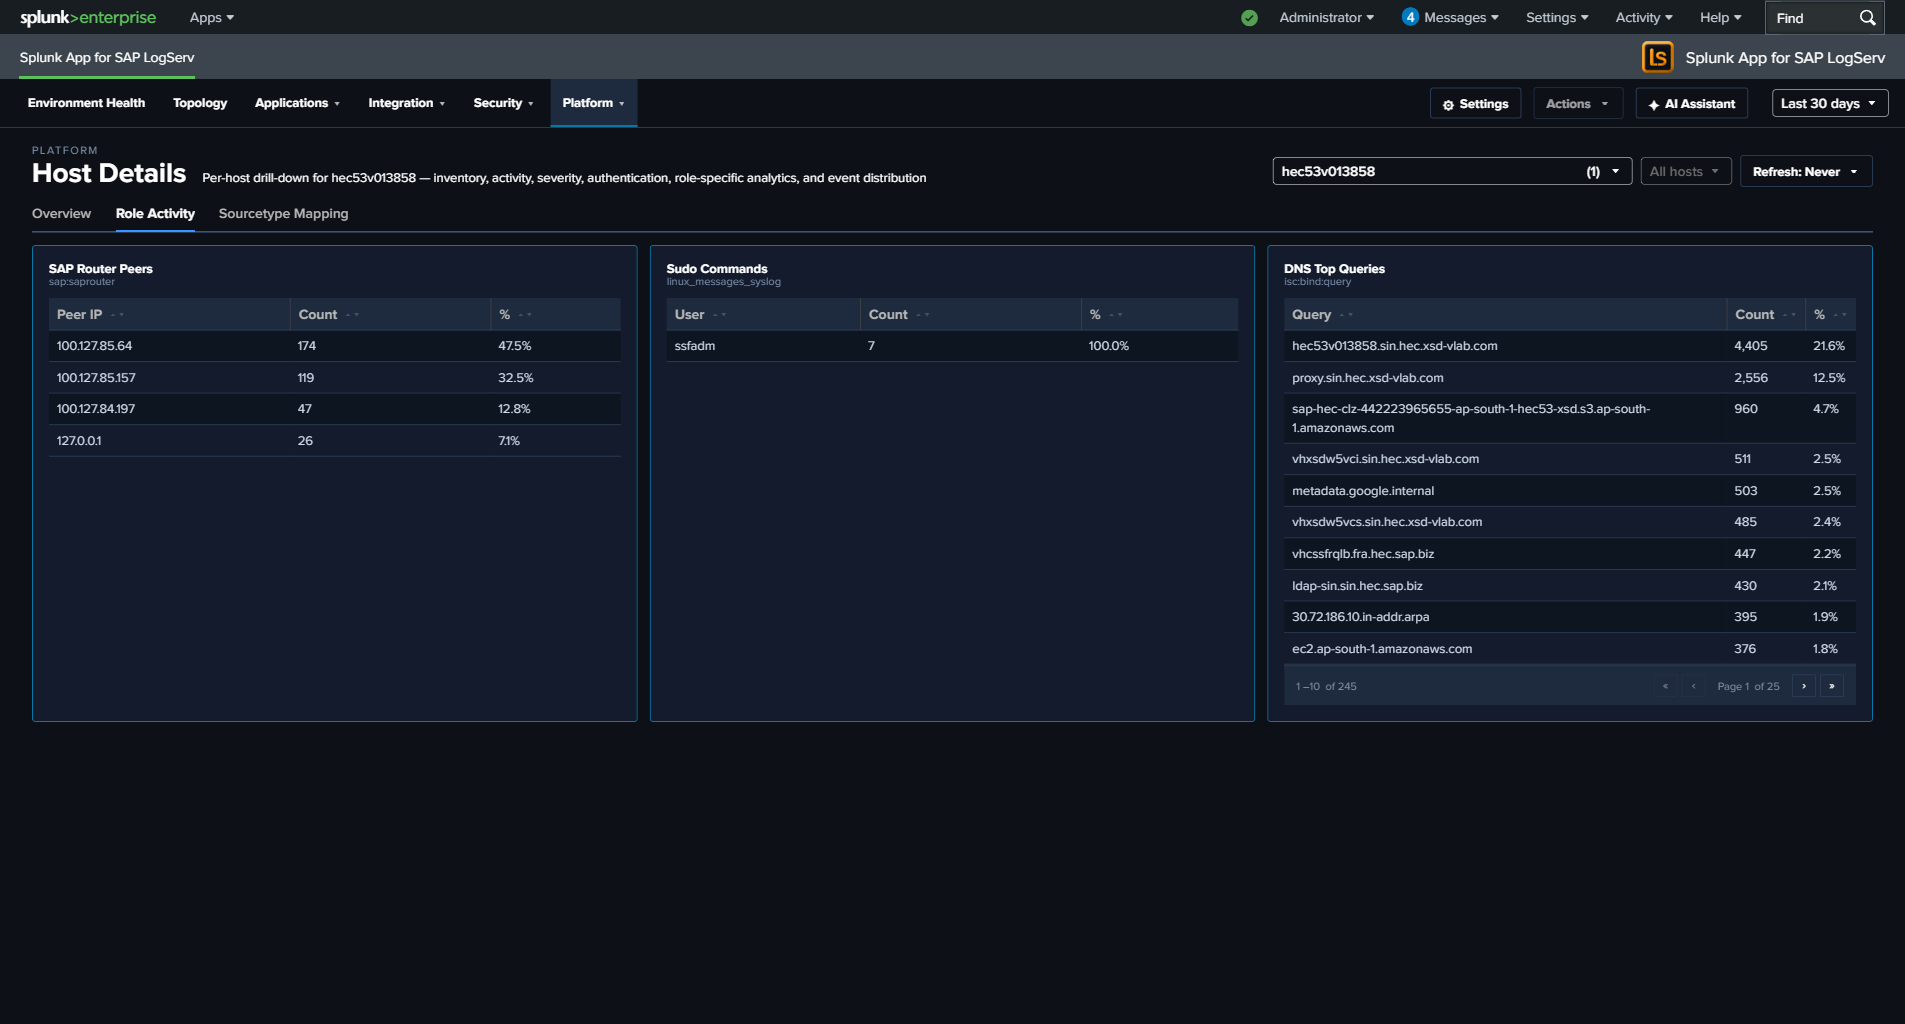
Why some panels may show for certain hosts but not others
Panels on the Role Activity tab — and a few on the Overview tab (Host Inventory, Recent Authentication Events, Recent Errors & Criticals) — use the hideWhenNoData attribute. Splunk automatically hides these panels when the selected host’s data source returns no rows in the current time range.
This means the dashboard adapts its layout to what the host actually is:
- A HANA host sees the HANA Audit Activity panel on Role Activity and hides ABAP, Web Dispatcher, Router, Windows, Sudo, and DNS.
- An ABAP application server sees the ABAP Work Process Mix panel and hides the HANA / Windows / DNS panels.
- A Windows host sees Windows Event Codes (and typically Recent Authentication Events) and hides the SAP-specific panels.
- A full-stack Linux host (with osquery + sudo + SAP ABAP) sees all of Host Inventory, Sudo Commands, ABAP WP Mix, and Recent Authentication Events.
- A sparse host with only one or two sourcetypes will see just the universal Overview panels plus whichever Role Activity panels match.
- Selecting All Hosts aggregates across every host — most panels populate because at least one host in the environment contributes data to each.
Empty panels aren’t a bug; they’re the dashboard telling you the selected host doesn’t have that role or doesn’t forward that log type. If you expect a panel to populate for a specific host (for example, an ABAP app server that should have sap:abap:workprocess data but doesn’t), that’s a genuine collection issue worth investigating — check the forwarder configuration and the host’s logging policy.
Sourcetype Mapping Tab¶
Full-width link graph showing how the host’s events flow from source files to sourcetypes. Useful for spotting a noisy source file that’s producing an outsized share of the host’s volume, or for validating that a host’s expected sources are all represented.
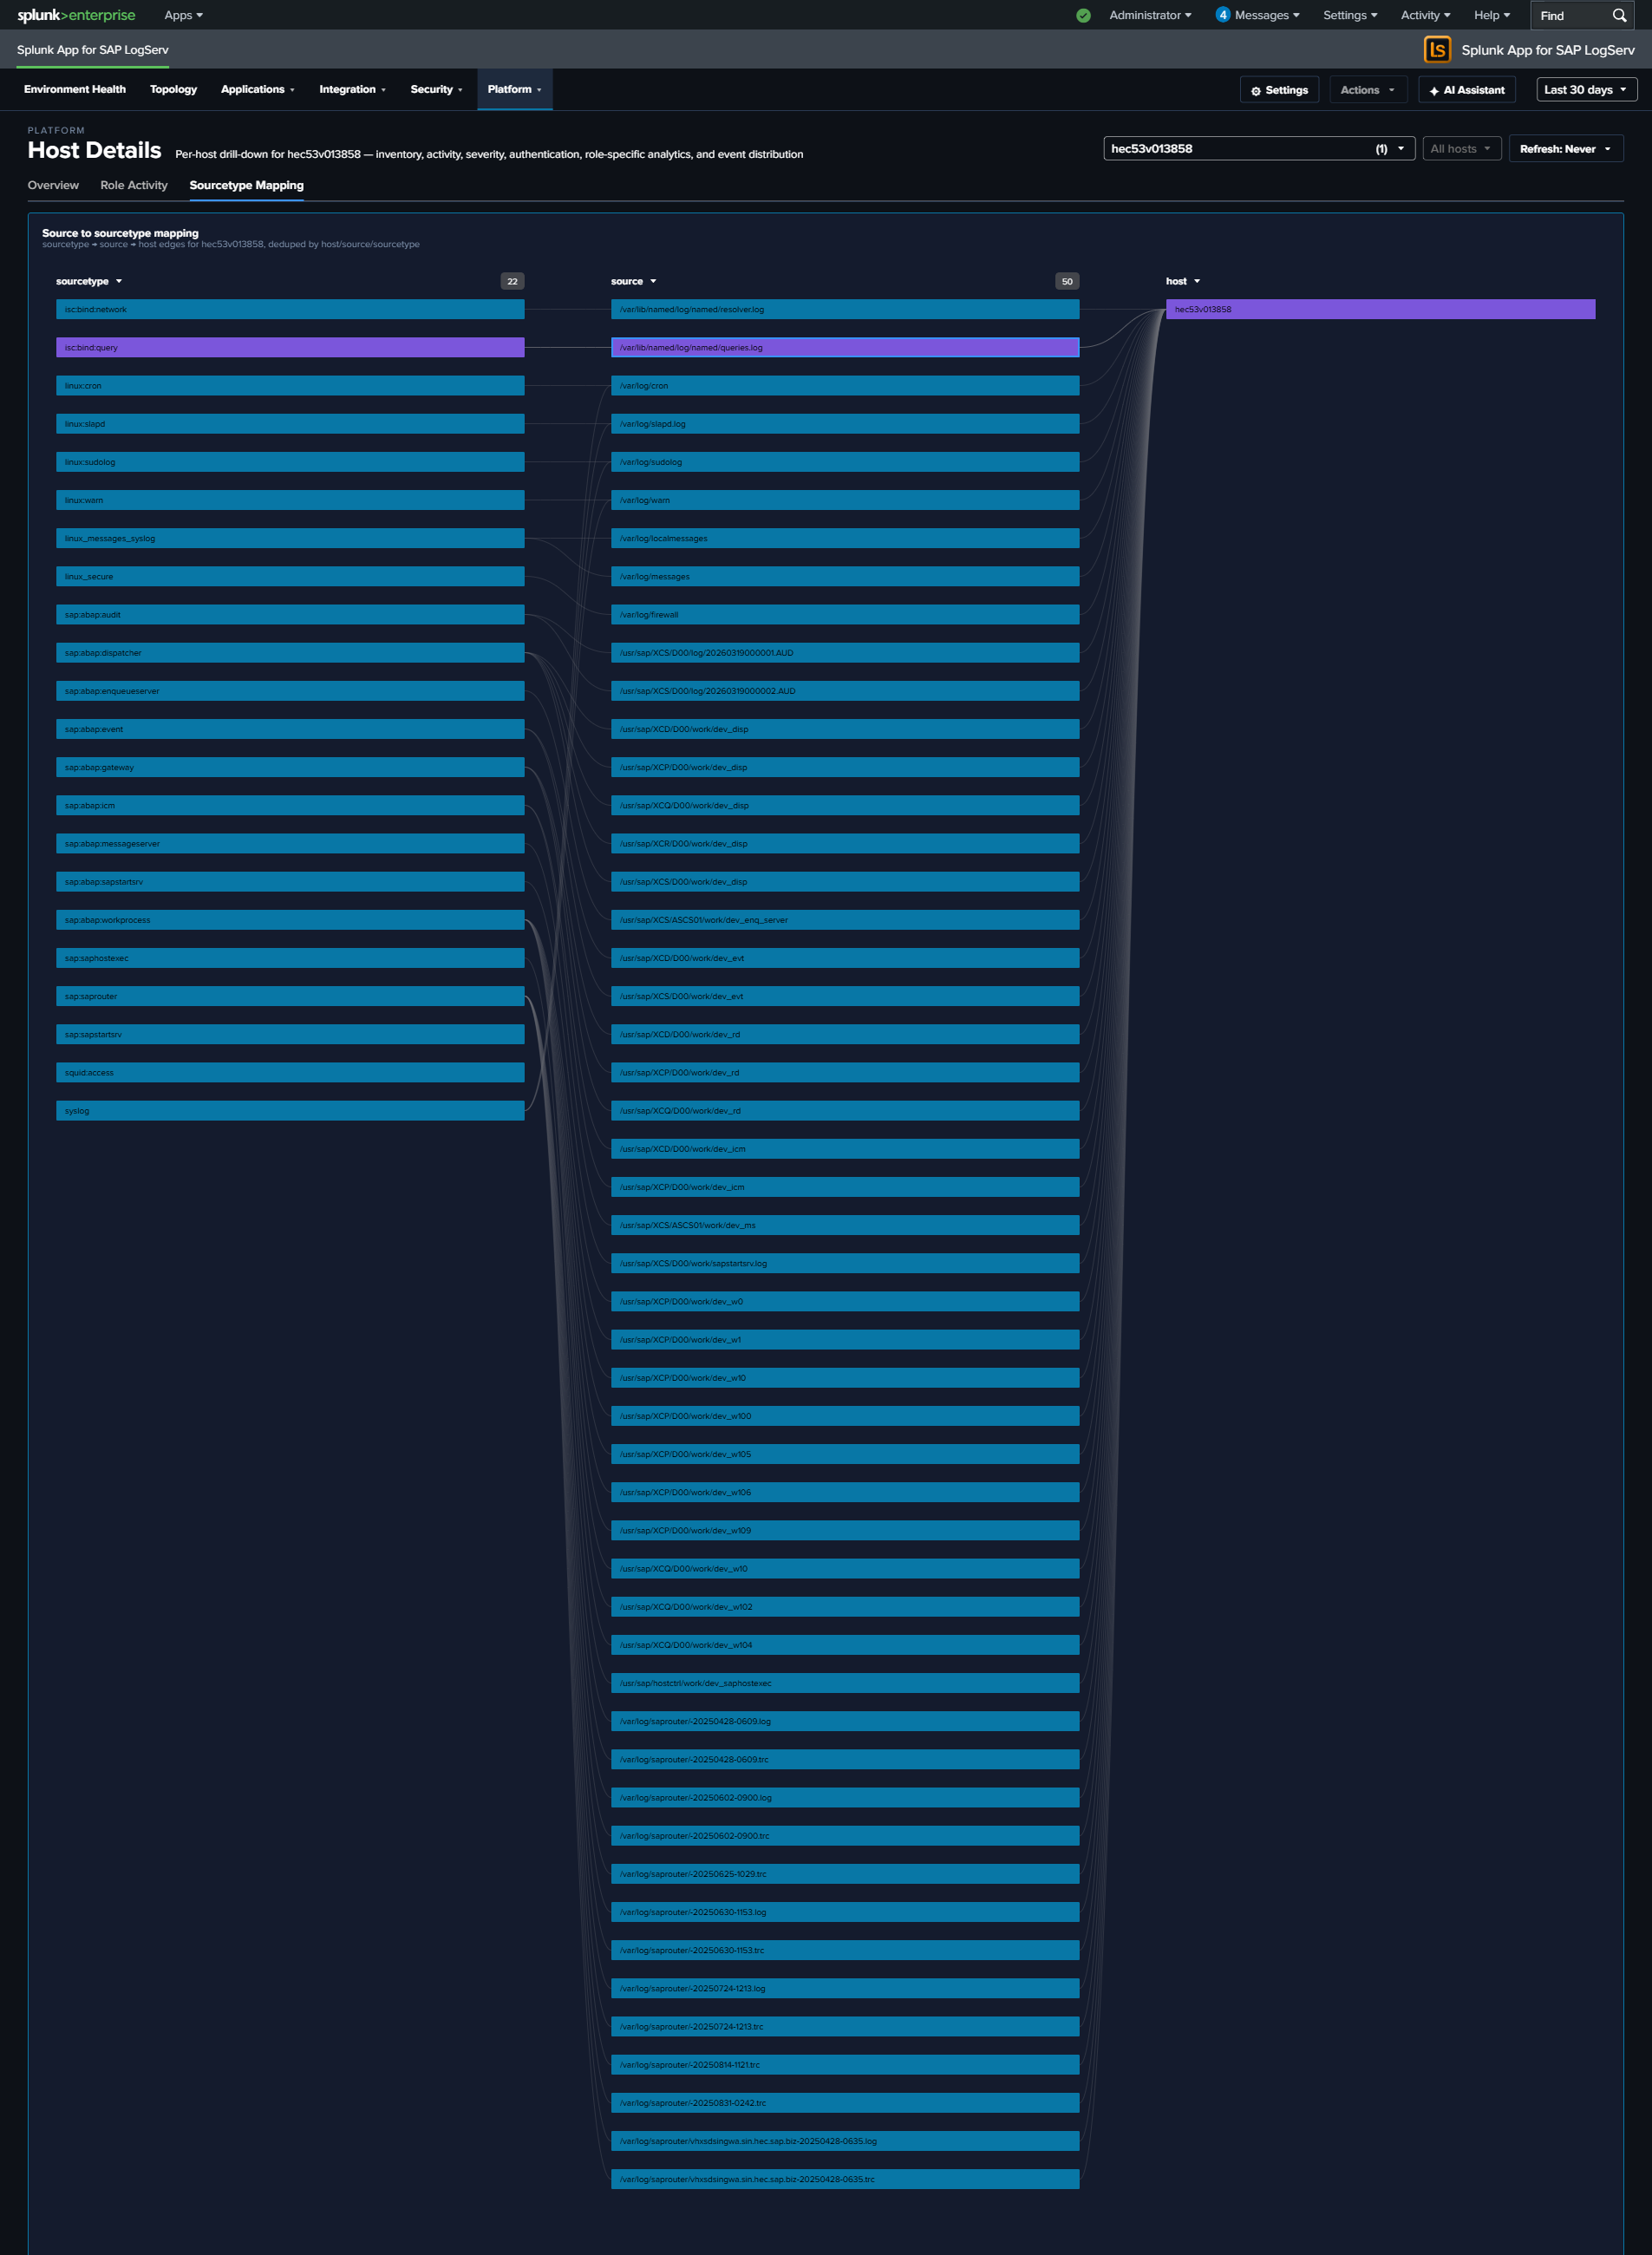
What to Look For¶
- Sourcetype gaps – If a host is missing a sourcetype that similar hosts have (e.g., a HANA host without
sap:hana:audit), it may indicate a misconfigured audit policy or broken log forwarding. - Stale sourcetypes – Any row in the Data Freshness table marked Stale or Very Stale signals that a specific log pipeline has stopped delivering. Drill into the timeline to see when it stopped.
- Volume anomalies – Compare the selected host’s event volume to its peers. Significantly higher or lower volume may indicate a workload issue, logging configuration problem, or security event.
- Sudden volume changes – A host that normally generates a steady volume but suddenly spikes or drops warrants investigation. Spikes may indicate security events; drops may indicate system or agent failures.
- Auth failure spikes – A non-zero Auth Failures KPI on a host that usually has zero is worth immediate attention. Drill to the Recent Authentication Events table for context.
- Off-hours activity – A non-zero bar in Activity by Hour of Day outside business hours, especially on an app server, can indicate batch jobs, maintenance, or suspicious activity.
- Sudo command patterns – On the Role Activity tab, a host with unexpected sudo commands (new users, non-standard commands, or commands run
As User: root) may reflect lateral-movement attempts or misconfigured automation. - Single-sourcetype dominance – If the Sourcetype Mapping link graph shows one sourcetype accounting for the vast majority of the host’s events, the balance may indicate a noisy process (check ICM, workprocess, or web dispatcher logs for runaway activity).
This dashboard accepts host and global time-range query params from the URL, so the time range and host selection carry over from the Data Pipeline Overview and other dashboards.
Ended: Platform
Ended: Dashboards Overview
Ended: LogServ UI App
Enterprise Security Integration ↵
Enterprise Security Integration — Overview¶
The Splunk for SAP LogServ App ships out-of-the-box integration with Splunk Enterprise Security (ES) so SOC analysts can investigate SAP-side threats through ES’s standard Incident Review queue, Risk-Based Alerting (RBA) framework, and CIM-aligned correlation searches.
The ES content ships ENABLED by default (as of v0.0.6 build 249) on a collision-free schedule
All 22 splunk_sap_logserv_es_* saved searches ship with disabled = 0, re-staggered so no two scheduled searches share an (hour, minute). The ES content is dual-mode: when Splunk Enterprise Security isn’t installed, the action.notable / action.risk directives silently no-op — the searches still run, their results stay searchable, and they power the AI Assistant Security-pack prompts. No dashboard depends on any ES output. If you don’t run ES and would rather not incur the scheduled load, see Disabling or tuning the ES content below.
Integration is dual-mode — the same App tarball works whether or not ES is installed:
- With ES installed: the 19 correlation searches emit Notable Events to ES Incident Review; one tier-2 Risk Notable fires when accumulated risk on a single object crosses a threshold; SAP-side Asset & Identity inventory feeds ES’s Identity Management framework for asset-context enrichment.
- Without ES: the ES searches still run on their schedule, but their ES actions no-op — the
action.notable=1directive silently does nothing, the ES-specific Risk Notable returns 0 rows, and there’s no ES merger framework to consume the Asset/Identity CSVs. Their search results remain searchable and power the AI Assistant Security-pack prompts. The rest of the App (dashboards, AI Assistant, topology) is unaffected — none of it reads ES output.
What ships for ES integration¶
| Capability | Count / Surface | Source |
|---|---|---|
| CIM data-model tagging | Authentication, Change, Network_Sessions, Web |
CIM Compliance |
| Base correlation searches | 6 (high-confidence SAP threat patterns) | Correlation Searches |
| Extended cross-stack correlation searches | 6 (lateral movement, privilege chain, after-hours data access, service-account interactive, HANA user creation off-hours, HANA mass DROP) | Correlation Searches → Extended cross-stack pack |
| Threat-intel correlation searches | 3 (DNS to malicious domain, proxy to malicious IP, compromised credential use) — joins against 3 customer-managed CSV lookups (ship empty) | Threat Intelligence Integration |
| Behavioral / anomaly detections | 4 stats-based Z-score (per-user auth volume, per-host webdispatcher response time, per-edge topology call volume, per-admin off-hours activity); no MLTK dependency | Behavioral & Anomaly Detections |
| Tier-2 Risk Notable | Critical-severity notable when accumulated risk on a single object ≥ 100 in 24h (aggregates risk from all 19 base + extended searches) | Correlation Searches |
| Asset Inventory feed | splunk_for_sap_logserv_assets.csv |
Asset & Identity Feed |
| Identity Inventory feed | splunk_for_sap_logserv_identities.csv |
Asset & Identity Feed |
Total: 19 detection correlation searches + 1 Risk Notable + 2 Asset/Identity feeds. All 19 detection searches are also AI-Assistant-dispatchable on demand via the predefined-prompt browser (Security pack).
Splunk dependency¶
The App declares a hard dependency on Splunk_SA_CIM ≥ 5.0.0 in its app.manifest. Splunk_SA_CIM is the standard Splunk CIM data-model definitions; it ships with ES but can also be installed standalone (free on Splunkbase).
The App does NOT declare a hard dep on SplunkEnterpriseSecuritySuite — this is intentional, so customers running the App without ES still get full functionality. ES-specific content (notable events, risk events, the Risk data-model search) silently no-ops without ES. Customers who later install ES gain the ES-specific surfaces immediately, with no App reconfiguration needed.
The ES schedule (collision-free)¶
The 22 ES searches ship enabled on a staggered schedule that is collision-free with the dashboard rollup-aggregate band (:03–:28 every hour) and the daily retention band (:30–:58, hours 00–01) — no two enabled scheduled searches share an (hour, minute):
- 16 correlation searches run hourly at
:29and the odd minutes:31–:59. - 2 Asset/Identity feeds run every 4 hours at
:00/:01. - 4 behavioral-anomaly searches run daily at
:02(hours 02–05), so the two heavy 30-day scans no longer run every hour.
Cadence vs. the original design
To fit the collision-free schedule, the eight correlation searches that previously ran every 5–15 minutes now run hourly (with matched 65-minute dispatch windows), and the four behavioral-anomaly searches run daily instead of hourly. A daily anomaly run still evaluates every hourly bucket of the previous day, so no detections are missed — only the reporting cadence changes. If you have the search capacity and want lower detection latency, raise any search’s cadence in local/savedsearches.conf.
Disabling or tuning the ES content¶
If you don’t run Splunk Enterprise Security and would rather not incur the scheduled load, disable the ES searches by either method — never edit default/:
Splunk Web (per search or in bulk):
- Settings → Searches, Reports, and Alerts.
- Set the App context to Splunk for SAP LogServ and filter the name on
splunk_sap_logserv_es_. - For each search (or select all), use the Edit → Disable action.
Config override (all at once): add a stanza per search to local/savedsearches.conf:
[splunk_sap_logserv_es_anomaly_webdisp_response]
disabled = 1

[splunk_sap_logserv_es_anomaly_user_auth_volume]
disabled = 1
# ... one stanza per splunk_sap_logserv_es_* search you want disabled
There are 22 ES searches (19 detections + the Risk Notable + the 2 Asset/Identity feeds). Disable all of them, or just the heaviest few (the three 30-day anomaly scans above are the most expensive).
CIM acceleration for the heavy anomaly searches
Three behavioral-anomaly searches scan a 30-day window (splunk_sap_logserv_es_anomaly_webdisp_response, _anomaly_user_auth_volume, _anomaly_topology_edge_volume). On a large environment these should run against CIM-accelerated data models (the standard ES design). If you leave the CIM models un-accelerated, those searches become 30-day full scans — acceptable at small/medium volume, but accelerate the Web / Authentication models for high volume. See CIM Compliance. As of v0.0.6 these run once daily rather than hourly, which already cuts their load substantially.
The schedule is collision-free
The always-on rollup-aggregate searches occupy minutes :03–:28 of each hour and retention runs :30–:58 (hours 00–01); the ES content is scheduled entirely in the disjoint minutes (:00–:02, :29, and the odd minutes :31–:59), so no two enabled scheduled searches collide. See Dashboard Performance & Data Freshness → Scheduled-search schedule.
Install matrix¶
The ES integration sits entirely on the search head tier — no changes to the Data TA / forwarder tier are needed.
| Topology | UI App location | ES integration applies |
|---|---|---|
| Single instance | Same instance | Yes |
| DS + HFs + on-prem SH | SH | Yes |
| DS + HFs + Splunk Cloud | Splunk Cloud SH | Yes (when ES is installed on Cloud SH) |
If the customer’s SH is in a search-head cluster, the App + ES integration deploy via the SHC deployer per Splunk’s standard process.
Verifying the integration is live¶
After the App installs (with Splunk_SA_CIM satisfied), the four CIM data models pick up SAP-side events automatically. Verify with:
| datamodel Authentication search
| search sourcetype IN ("sap:hana:audit","sap:sapstartsrv","sap:scc:audit","linux:sudolog")
| stats count by sourcetype Authentication.action
You should see rows for each populated SAP authentication source, with Authentication.action as success / failure.
Same pattern for Change, Web, Network_Sessions — see CIM Compliance for full details.
Customer-tunable surfaces¶
| Knob | Default | Where |
|---|---|---|
| Correlation-search schedules | hourly (correlations) / daily (anomalies) / every 4h (feeds) | Settings → Searches, reports, and alerts |
| Notable severity per search | high / medium | default/savedsearches.conf (override in local/) |
| Risk scores per event | 80 / 60 / 50 / 40 (varies per search) | default/savedsearches.conf action.risk.param._risk JSON |
| Risk Notable threshold | total_risk >= 100 in 24h |
The splunk_sap_logserv_es_risk_notable_threshold saved search’s \| where ... clause |
| Asset/Identity feed cadence | every 4h | Cron on the _asset_feed / _identity_feed saved searches |
All of these are editable in local/savedsearches.conf — do not edit default/.
Pages in this section¶
- CIM Compliance — How SAP-side events get tagged into Splunk’s standard CIM data models so ES correlation searches can consume them.
- Correlation Searches — The 6 base + 6 extended cross-stack correlation searches, the tier-2 Risk Notable, and the RBA risk-scoring scheme.
- Asset & Identity Feed — How the App auto-populates ES’s Identity Management framework with SAP system inventory + user identities.
- Threat Intelligence Integration — The 3 customer-managed CSV lookups + the 3 TI-driven correlation searches that join against them. Customer populates the lookups from their own threat-intel feed.
- Behavioral & Anomaly Detections — The 4 stats-based Z-score anomaly detections that complement the deterministic correlation searches by surfacing entities deviating from their own historical patterns. Optional MLTK upgrade path documented.
CIM Compliance¶
The Splunk for SAP LogServ App tags every supported SAP-side sourcetype into the relevant Splunk Common Information Model (CIM) data models, so ES correlation searches and RBA risk framework can consume the data through the standard | datamodel <Model> search ... interface.
CIM models in scope¶
The App participates in these CIM data models, declared in app.manifest under info.commonInformationModels:
| Model | Use case | SAP-side sourcetypes |
|---|---|---|
| Authentication | login attempts (success / failure) | sap:hana:audit (CONNECT events), sap:sapstartsrv, sap:scc:audit (ACCESS_DENIED), linux:sudolog |
| Change | account / role / config modifications | sap:hana:audit (DDL events), sap:scc:audit (CONFIGURATION_CHANGED, SERVICE_*) |
| Network_Sessions | TCP-level connection tracking | sap:abap:gateway, sap:saprouter |
| Network / Resolution (DNS) | DNS query / resolution activity (absorbed ISC BIND parser) | isc:bind:query, isc:bind:queryerror |
| Web | HTTP request/response | sap:webdispatcher:access, sap:scc:http_access, sap:abap:icm, squid:access (absorbed Squid proxy parser) |
For sourcetypes that don’t fit any stock CIM model (HANA tracelogs, ABAP application-tier internal logs), the App still extracts rich search-time fields and adds vendor_product = "SAP NetWeaver ABAP" (or similar) for cross-cutting search consistency, but doesn’t tag them into a CIM model.
How the tagging works¶
Two configuration files drive CIM tagging:
default/eventtypes.conf¶
Defines 18 eventtypes — 13 SAP-specific plus 5 from the absorbed ISC BIND + Squid parsers (isc_bind_query, isc_bind_queryerror, isc_bind_lameserver, isc_bind_transfer, squid_access) — each filtering events that should participate in a particular CIM model. For example:
[sap_hana_authentication]
search = sourcetype="sap:hana:audit" (action_type="CONNECT" OR audit_category="SYSTEM Logins")

[sap_hana_change]
search = sourcetype="sap:hana:audit" (action_type IN ("ALTER USER","CREATE USER","DROP USER","GRANT","REVOKE", ...) OR audit_category IN ("User Administration", ...))
A single sourcetype like sap:hana:audit can route to multiple eventtypes — CONNECT events go to sap_hana_authentication, while DDL events go to sap_hana_change.
default/tags.conf¶
Activates CIM tags on each eventtype:
[eventtype=sap_hana_authentication]
authentication = enabled

[eventtype=sap_hana_change]
change = enabled

[eventtype=sap_abap_gateway_session]
network = enabled
session = enabled
When you query tag=authentication (or use the Authentication data model), Splunk includes events from every eventtype that has authentication = enabled.
CIM-required field coverage¶
For each tagged sourcetype, the App’s default/props.conf provides the CIM-required fields via EXTRACT-, EVAL-, and FIELDALIAS- directives.
Example: sap:hana:audit¶
| CIM field | Source |
|---|---|
action |
EVAL — case(action_type=="CONNECT" AND status=="SUCCESSFUL", "success", action_type=="CONNECT" AND status IN ("UNSUCCESSFUL","FAILED"), "failure", match(action_type,"(?i)create"), "created", match(action_type,"(?i)alter|grant|revoke"), "modified", ...) |
app |
EVAL literal "sap_hana" |
vendor_product |
EVAL literal "SAP HANA" |
user |
FIELDALIAS-user = executing_user (the user PERFORMING the action) |
dest_user |
FIELDALIAS-dest_user = target_user (the affected user, for Change model) |
src |
FIELDALIAS-src = client_ip |
dest |
FIELDALIAS-dest = db_hostname |
change_type |
EVAL — case(match(action_type,"(?i)(user|role|grant|revoke)"), "account", ...) |
object |
FIELDALIAS-object = target_user |
object_category |
EVAL — case(match(action_type,"(?i)user"), "user account", ...) |
Same pattern applies to other sourcetypes. See default/props.conf in the App package for the full per-sourcetype field-mapping detail.
Verifying CIM compliance¶
Run the following on a Splunk instance with the App installed (and the underlying SAP-side data ingested):
| datamodel Authentication search
| search sourcetype IN ("sap:hana:audit","sap:sapstartsrv","sap:scc:audit","linux:sudolog")
| stats count by sourcetype Authentication.action
You should see results like:
sourcetype                  Authentication.action  count
linux:sudolog               success                369
sap:hana:audit              failure                19
sap:hana:audit              success                604
sap:sapstartsrv             failure                566
sap:scc:audit               failure                27
Repeat for the other models:
| datamodel Change search | search sourcetype IN ("sap:hana:audit","sap:scc:audit") | stats count by sourcetype All_Changes.action
| datamodel Web search | search sourcetype IN ("sap:webdispatcher:access","sap:scc:http_access","sap:abap:icm") | stats count by sourcetype Web.action
| datamodel Network_Sessions search | search sourcetype IN ("sap:abap:gateway","sap:saprouter") | stats count by sourcetype
If | datamodel ... returns rows for our sourcetypes, ES can consume them — every standard ES Authentication / Change / Web / Network_Sessions correlation search will include SAP-side events automatically.
Sourcetype coverage matrix¶
| Sourcetype | Tagged into | Severity |
|---|---|---|
sap:hana:audit |
Authentication + Change | (CONNECT events: high-priority for ES Auth dashboards) |
sap:webdispatcher:access |
Web | medium |
sap:scc:http_access |
Web | medium |
sap:abap:icm |
Web | medium |
sap:abap:gateway |
Network_Sessions | medium |
sap:saprouter |
Network_Sessions | medium |
sap:sapstartsrv |
Authentication | medium |
sap:scc:audit |
Authentication (ACCESS_DENIED) + Change (CONFIGURATION_CHANGED, SERVICE_*) | medium |
linux:sudolog |
Authentication + privileged | medium |
isc:bind:query |
Network + Resolution (DNS) — absorbed ISC BIND parser | medium |
isc:bind:queryerror |
Network + Resolution (DNS) — absorbed ISC BIND parser | medium |
squid:access |
Web + Proxy — absorbed Squid proxy parser | medium |
Known limitations¶
F5: Web events appear at two tiers¶
Both sap:webdispatcher:access (front-end TLS-terminating load balancer) and sap:scc:http_access (backend tunnel traversal) capture HTTP events for the same logical request chain. ES’s Web data model surfaces both as distinct events.
This is correct CIM-aligned behavior — each tier records its own view, and ES dashboards can drill into either. But correlation queries that count “unique HTTP requests” should dedupe carefully (e.g., by the request-id field if both tiers carry one, or by _time window + client_ip + uri).
F6: Some sourcetypes have no clean CIM fit¶
ABAP application-tier internal logs (sap:abap:dispatcher, sap:abap:enqueueserver, sap:abap:event, sap:abap:messageserver, sap:abap:sapstartsrv, sap:abap:workprocess) and HANA tracelogs (sap:hana:tracelogs) don’t map cleanly to any stock Splunk CIM model. The App provides rich search-time fields for them but doesn’t force a poor-fit mapping. Our own dashboards consume these directly; ES correlation searches built on these would need to use sourcetype-explicit SPL rather than CIM-data-model search.
sap:abap:audit currently has minimal extraction¶
The ABAP security audit log (sap:abap:audit) is binary/hex format. The App extracts SID + instance + the audit marker; richer field extraction would require a more accessible source format (e.g., SM20/SM19 export) is available. As a result, this sourcetype is currently NOT tagged into Authentication or Change — events are in the index but not in CIM dashboards. Expected to land in a future release.
Correlation Searches & RBA¶
The Splunk for SAP LogServ App ships 19 correlation searches in three tiers:
- 6 base correlation searches — the starter pack, signal-heavy and FP-tuned for the SAP-specific threat patterns SOC analysts encounter most.
- 6 extended cross-stack correlation searches — added in the extended ES content pack. Detect cross-source chains that customers can’t easily author themselves because they require SAP-specific knowledge of which sourcetype emits the auth event vs. the privilege change vs. the data event.
- 3 threat-intel correlation searches + 4 behavioral / anomaly searches — see Threat Intelligence Integration and Behavioral & Anomaly Detections for those.
Plus 1 tier-2 Risk Notable that aggregates risk events from all 19 detection searches and fires when accumulated risk on a single object crosses a threshold (Risk-Based Alerting / RBA).
All correlation searches are scheduled saved searches in default/savedsearches.conf with parallel ES Content Management metadata in default/correlationsearches.conf. They appear under Settings → Content Management when ES is installed.
The 6 base correlation searches¶
| # | Search name | What it detects | Severity | Schedule |
|---|---|---|---|---|
| 1 | splunk_sap_logserv_es_hana_privilege_escalation |
HANA GRANT WITH ADMIN OPTION or any ALTER USER on the SYSTEM user |
high | hourly |
| 2 | splunk_sap_logserv_es_cross_stack_auth_failure |
Same user fails authentication on 2+ different SAP stacks (HANA, sapstartsrv, SCC, sudo) within the same window | high | every 15 min |
| 3 | splunk_sap_logserv_es_abap_gateway_anomalous_peer |
New ABAP gateway peer IP not seen (or seen <5 times) in the prior 30 days | medium | hourly |
| 4 | splunk_sap_logserv_es_scc_access_denied_burst |
3+ SCC ACCESS_DENIED events on a single host within 1h | medium | hourly |
| 5 | splunk_sap_logserv_es_hana_failed_connect_spike |
5+ failed HANA CONNECT attempts by a single user on a single host within 1h | medium | every 15 min |
| 6 | splunk_sap_logserv_es_oom_kill_burst |
Fires on a burst of Linux OOM-killer (out-of-memory) events on a host | medium | hourly |
Why “6 starter, well-vetted” instead of 15-20¶
The starter set is intentionally small + signal-heavy:
- Each search has been dry-run on live data before shipping
- Most return 0 rows on healthy-environment data (low FP rate by design — they fire on real attack patterns)
- Easier to false-positive-tune in customer environments
- Easier to document for SOC analysts during onboarding
Customers + community can layer additional ES correlation searches on top — see the design doc for guidance on adding searches.
Per-search detail¶
1. HANA Privilege Escalation¶
`sap_logserv_idx_macro` sourcetype="sap:hana:audit" tag=change
  ((action_type=GRANT AND match(sql_statement, "(?i)WITH ADMIN OPTION"))
   OR (action_type="ALTER USER" AND target_user="SYSTEM"))
| stats count, latest(_time) AS last_seen, values(sql_statement) AS sql_statements
        by executing_user, target_user, host, action_type
| sort -count
Threat model: A SAP HANA admin or compromised account uses GRANT ... WITH ADMIN OPTION (creating a privilege-pivot path) or runs ALTER USER SYSTEM ... (modifying the SYSTEM superuser). Both warrant change-ticket review.
FP profile: Medium. ALTER USER SYSTEM RESET CONNECT ATTEMPTS is operationally common after lockout recovery. SOC needs to correlate with change tickets or whitelist routine maintenance.
2. Cross-Stack Authentication Failure Burst¶
| datamodel Authentication search
| search Authentication.action="failure" sourcetype IN ("sap:hana:audit","sap:sapstartsrv","sap:scc:audit","linux:sudolog")
| rename Authentication.user AS user
| stats values(sourcetype) AS sourcetypes, dc(sourcetype) AS distinct_sourcetypes,
        count, latest(_time) AS last_seen by user
| where distinct_sourcetypes >= 2
| sort -distinct_sourcetypes -count
Threat model: Credential stuffing or coordinated brute force. The same compromised credential is tried against multiple SAP stacks. A user appearing in failure events across 2+ sourcetypes within a 15-minute window is the highest-signal indicator of this attack pattern.
FP profile: Very low. Only fires on actual cross-stack pattern; healthy environments produce 0 rows.
3. ABAP Gateway Anomalous Peer¶
`sap_logserv_idx_macro` sourcetype="sap:abap:gateway" peer_ip=*
   earliest=-1h@h latest=now
| stats count by peer_ip host
| join type=outer peer_ip [
    search `sap_logserv_idx_macro` sourcetype="sap:abap:gateway" peer_ip=*
       earliest=-30d@d latest=-1h@h
    | stats count AS historical_count by peer_ip
  ]
| where isnull(historical_count) OR historical_count < 5
| sort -count
Threat model: A new RFC client appears at the SAP ABAP gateway. Could be a legitimate new integration or an unauthorized scanning attempt. The 30-day baseline + 1-hour detection window catches anything new.
FP profile: Low. Will fire on genuine new peers; SOC reviews → either whitelists or blocks.
4. SCC ACCESS_DENIED Burst¶
`sap_logserv_idx_macro` sourcetype="sap:scc:audit" scc_audit_type=ACCESS_DENIED
   earliest=-1h@h latest=now
| stats count, latest(_time) AS last_seen, values(scc_account_id) AS account_ids by host
| where count >= 3
| sort -count
Threat model: SAP Cloud Connector logs ACCESS_DENIED when an inbound tunnel request hits a backend that isn’t on the SCC allowlist. 3+ events on a single host in an hour signals either misconfigured allowlist or external probing.
FP profile: Low. ACCESS_DENIED events are sparse under normal operations.
5. HANA Failed CONNECT Spike Per User¶
`sap_logserv_idx_macro` sourcetype="sap:hana:audit" action_type=CONNECT status=UNSUCCESSFUL
   earliest=-1h@h latest=now
| stats count, latest(_time) AS last_seen, values(client_ip) AS client_ips
        by executing_user host
| where count >= 5
| sort -count
Threat model: A user repeatedly failing HANA CONNECT (5+ in an hour) — above the noise floor of routine SCC tunnel-credential failures (~1-2/hr).
FP profile: Low. 5/hr threshold is above routine failure rates.
6. Linux OOM-Killer Burst¶
Fires on a burst of Linux OOM-killer (out-of-memory) events on a host. Security domain endpoint.
Threat model: A spike of kernel out-of-memory kills can indicate a memory-exhaustion attack, a runaway/compromised process, or resource-starvation that takes SAP services offline. Clustered OOM kills warrant operational + security review.
FP profile: Low to medium. Legitimately busy hosts under memory pressure can produce bursts; correlate with known workload spikes or capacity events.
Extended cross-stack pack (v2)¶
Six additional correlation searches detect cross-source threat chains that customers can’t easily author themselves. The patterns require SAP-specific knowledge of which sourcetype emits the authentication event vs. the privilege change vs. the data-tier event — knowledge that’s inside the LogServ App rather than in stock Splunk content.
| # | Search name | What it detects | Severity | Schedule |
|---|---|---|---|---|
| 6 | splunk_sap_logserv_es_lateral_movement |
Same user authenticates successfully into 3+ HANA SIDs within 60s | high | every 15 min |
| 7 | splunk_sap_logserv_es_privilege_chain |
Same account: auth failure → success → privilege change in 1h | high | hourly |
| 8 | splunk_sap_logserv_es_after_hours_admin_data_access |
Same user active in HANA audit + webdispatcher access on the same host outside business hours | high | hourly |
| 9 | splunk_sap_logserv_es_service_account_interactive |
Service account (flagged via is_service_account) generated interactive HANA CONNECT |
medium | every 15 min |
| 10 | splunk_sap_logserv_es_hana_user_creation_off_hours |
CREATE USER on HANA outside business hours or on weekends |
medium | hourly |
| 11 | splunk_sap_logserv_es_hana_mass_drop |
5+ DROP statements by a single user on a single host within 10 min | high | every 10 min |
Per-search detail (extended pack)¶
6. Lateral Movement¶
Same user authenticates successfully into 3+ SAP HANA SIDs within a 60-second window. The cross-SID hop pattern is the canonical lateral-movement signal across the SAP estate.
Threat model: An attacker with valid credentials probing the estate to find which systems the credential is authorized on. Healthy environments show this only for monitoring service accounts that legitimately poll every SID.
FP profile: Low — most environments have monitoring service accounts that legitimately span SIDs; tag those in the Identity feed (category=service) so the existing classification can be used to filter the alert downstream.
7. Privilege Chain (Credential Stuffing → Escalation)¶
Same account on a single HANA host has BOTH authentication failures AND a successful authentication AND a privilege-change event (GRANT, ALTER USER, CREATE USER/ROLE) within a 1-hour window. Highest-priority investigation pattern in the SAP-side ES content.
Threat model: Credential stuffing → established access → escalation chain. The textbook compromise pattern.
FP profile: Very low. Healthy admin operations look like (success + change), not (failure + success + change).
8. After-Hours Admin Data Access¶
Same user is active across BOTH HANA audit AND webdispatcher access logs outside business hours, on the same host. Cross-source signal indicating a potential off-hours data-extraction pattern.
Threat model: Admin-account compromise → data exfiltration via authenticated session that spans the database and HTTP tiers. Off-hours timing reduces the likelihood of being noticed in real time.
FP profile: Low for human admin accounts; moderate for service accounts that legitimately do this. Tag service accounts in the Identity feed to filter.
9. Service-Account Interactive HANA Login¶
Service accounts (flagged via is_service_account="true" in the EVAL output of the props extraction layer) generated interactive HANA CONNECT events. Service accounts should run programmatic workloads, never interactive sessions.
Threat model: Either misuse (admin using a service-account credential because it has higher privileges than their own) or compromise (attacker who obtained a service-account credential and is using it interactively from a workstation).
FP profile: Very low if the Identity feed accurately classifies service accounts. The is_service_account field comes from the props-time EVAL pipeline, so coverage matches whatever username pattern matching is configured there.
10. HANA User Creation Outside Business Hours¶
CREATE USER on HANA outside business hours or on weekends. Should map to a known change ticket; off-window creation often indicates ad-hoc / unauthorized provisioning.
Threat model: Insider creating a backdoor account when fewer admins are watching. Less aggressive than mass DROP but still a containment-relevant signal.
FP profile: Low for typical environments. Higher during planned cutover weekends — operators expecting weekend CREATE USER activity should pre-disable this search for the maintenance window.
11. HANA Mass DROP/DELETE¶
5+ DROP statements (TABLE, SCHEMA, VIEW, PROCEDURE, USER, ROLE, INDEX) by a single user on a single host within 10 minutes. Indicates either large-scale schema cleanup (which should map to a change ticket) or destructive insider activity.
Threat model: Destructive insider, ransomware-style data destruction, or inadvertent operator error during cleanup.
FP profile: Low at this threshold (5 in 10 min is well above routine ad-hoc cleanup activity). Schema migrations for a major release will produce hits — pre-disable the search during planned migration windows or document the mapping in the change ticket.
RBA — Risk-Based Alerting¶
Each of the 6 base correlation searches carries action.risk = 1 annotations so events also feed ES’s Risk Framework.
Per-search risk table¶
| Search | risk_object_field | risk_object_type | risk_score |
|---|---|---|---|
| HANA privilege escalation | executing_user, target_user, host |
user, user, system | 80, 40, 30 |
| Cross-stack auth failure | user |
user | 60 (per-event accumulating) |
| ABAP gateway anomalous peer | peer_ip, host |
other, system | 40, 20 |
| SCC ACCESS_DENIED burst | host |
system | 50 |
| HANA failed CONNECT spike | executing_user, host |
user, system | 50, 30 |
| Linux OOM-killer burst | host |
system | 40 |
| Lateral movement | auth_user |
user | 70 |
| Privilege chain | auth_user, host |
user, system | 80, 40 |
| After-hours admin data access | auth_user, host |
user, system | 70, 30 |
| Service account interactive | executing_user |
user | 60 |
| HANA user creation off-hours | executing_user |
user | 50 |
| HANA mass DROP | executing_user, host |
user, system | 70, 50 |
| TI: DNS to malicious domain | src_ips |
system | 80 |
| TI: proxy to malicious IP | src_ips |
system | 70 |
| TI: compromised credential use | auth_user |
user | 90 |
| Anomaly: user auth volume | auth_user |
user | 30 |
| Anomaly: webdispatcher response | host |
system | 30 |
| Anomaly: topology edge volume | source |
system | 30 |
| Anomaly: after-hours admin | auth_user |
user | 40 |
Multi-object risk per event¶
Where a single notable affects multiple objects (operator + target + host for privilege escalation), the score is split across all three so each accrues risk simultaneously. Example:
action.risk.param._risk = [
  {"risk_object_field":"executing_user","risk_object_type":"user","risk_score":80},
  {"risk_object_field":"target_user","risk_object_type":"user","risk_score":40},
  {"risk_object_field":"host","risk_object_type":"system","risk_score":30}
]
ES Risk Framework correctly aggregates across the three when consumed by tier-2 RBA searches.
Tier-2 Risk Notable¶
The App also ships splunk_sap_logserv_es_risk_notable_threshold — a higher-tier correlation search that aggregates risk events from the 6 base searches and creates a critical-severity Notable when a single risk_object accumulates ≥ 100 risk_score in 24h.
| from datamodel:Risk.All_Risk
| search source IN (
    "splunk_sap_logserv_es_hana_privilege_escalation",
    "splunk_sap_logserv_es_cross_stack_auth_failure",
    "splunk_sap_logserv_es_abap_gateway_anomalous_peer",
    "splunk_sap_logserv_es_scc_access_denied_burst",
    "splunk_sap_logserv_es_hana_failed_connect_spike",
    "splunk_sap_logserv_es_oom_kill_burst")
| stats sum(All_Risk.risk_score) AS total_risk
        values(All_Risk.risk_object_type) AS risk_object_type
        values(source) AS source_searches
        dc(source) AS distinct_searches
        latest(_time) AS last_event by All_Risk.risk_object
| rename All_Risk.risk_object AS risk_object
| where total_risk >= 100
Why threshold 100? It’s the conservative starter: - Two cross-stack-auth-failure events for the same user (60 + 60 = 120) → fires - One privilege-escalation event distributes 80/40/30 across three objects — none alone exceeds 100, but a second event compounds - Operations with high event volume can lower the threshold to 60; low-volume environments raise to 200. Customer-tunable.
ES dependency: the Risk Notable reads from Risk.All_Risk data model. Without ES, the Risk data model isn’t accelerated and the search returns 0 rows silently — perfect dual-mode behavior.
How notables appear in ES Incident Review¶
When a base correlation search fires:
- Notable created with the search’s
rule_titletemplate substituted with row field values - Example: “HANA Privilege Escalation: ALTER USER by xcnadm on SYSTEM” - Severity badge matches
action.notable.param.severity(high / medium) - Security domain badge:
identity/access/network/threat - Grouping by
nes_fields— ES groups similar notables (same operator + target + host) into one row in Incident Review
When the tier-2 Risk Notable fires:
- Critical-severity notable with title like “High accumulated risk: xcnadm (160) across 3 SAP correlation searches”
- Security domain =
threat - Grouping by
risk_object— one notable per high-risk object
Customer tuning¶
Override severity, schedule, or risk scores in local/savedsearches.conf (do not edit default/). For example, to raise the Risk Notable threshold to 150:
[splunk_sap_logserv_es_risk_notable_threshold]
search = | from datamodel:Risk.All_Risk | search source IN (...) | stats sum(All_Risk.risk_score) AS total_risk ... by All_Risk.risk_object | rename All_Risk.risk_object AS risk_object | where total_risk >= 150
Restart Splunk or reload saved searches via REST after editing.
Disabling individual correlation searches¶
Customers who don’t want a particular search firing can disable it without uninstalling the App:
- Settings → Searches, reports, and alerts
- Filter by
splunk_sap_logserv_es_* - Click the search → Edit → Disable
- Save
The disabled search stops scheduling but remains in the App for re-enable later.
See also¶
- CIM Compliance — How the underlying tagging works
- Asset & Identity Feed — How asset context enriches notable events
- Threat Intelligence Integration — The 3 customer-managed CSV lookups + 3 TI-driven correlation searches
- Behavioral & Anomaly Detections — The 4 statistically-baselined anomaly searches with optional MLTK upgrade path
Asset & Identity Feed for ES Identity Management¶
The Splunk for SAP LogServ App auto-populates ES’s Identity Management framework with SAP system inventory + user identities, derived from the same data sources the Environment Topology view uses.
This means ES correlation searches (and any third-party app querying asset_lookup_by_str or identity_lookup_expanded) get rich asset/identity context for SAP-side events automatically.
What ships¶
Two scheduled saved searches that emit CSV lookups every 4 hours:
| Saved search | Cadence | Output lookup | Schema |
|---|---|---|---|
splunk_sap_logserv_es_asset_feed |
every 4h (cron 7 */4 * * *) |
splunk_for_sap_logserv_assets.csv |
ES Asset (17 std cols + 2 extra) |
splunk_sap_logserv_es_identity_feed |
every 4h (cron 19 */4 * * *) |
splunk_for_sap_logserv_identities.csv |
ES Identity (15 std cols + 1 extra) |
Schedules are offset by 12 minutes to avoid both firing in the same scheduler window.
Asset feed¶
The Asset feed unions 6 inventory subsearches and consolidates by IP (when present) or DNS hostname:
sap:abap:gatewayevents withlocal_ip=*→ IP+host+SIDsap:hana:tracelogswithhana_host=*→ hostname+SID (no IP)sap:abap:icmwithicm_local_ip=*→ IP+host+SIDsap:saprouterevents → host-only, categorized as middlewaresap:scc:auditevents → host-only, middlewaresap:webdispatcher:accessevents → host-only, application
After dedup, SAP-stack heuristics apply:
- HANA database servers →
priority=high, category=Server | Database | SAP HANA - Middleware (saprouter, SCC) →
priority=high, category=Server | Middleware | SAP - NetWeaver application servers →
priority=medium, category=Server | Application | SAP NetWeaver
Hardcoded fields (customer overrides via merger):
- owner = "SAP-Operations"
- bunit = "SAP"
- is_expected = 1, should_timesync = 1, should_update = 1, requires_av = 0
Empty-on-emit (out of scope):
- mac — log data doesn’t carry MAC addresses
- nt_host — Windows hostname not derivable from SAP logs
- lat / long / city / country — not in log data
- pci_domain — out of scope for SAP-side derivation
Two extra columns for SOC analyst readability (ES merger ignores unknown columns):
- _sap_sids — comma-joined list of SAP SIDs hosted on this asset
- _roles — comma-joined list of roles (e.g., SAP NetWeaver ABAP,SAP NetWeaver ABAP ICM)
Identity feed¶
The Identity feed unions 5 user-source subsearches and consolidates by identity:
sap:hana:auditexecuting_user→ taggedhana_adminsap:hana:audittarget_user→ taggedhana_targetsap:sapstartsrvauth_user→ taggedsap_host_userlinux:sudologos_user→ taggedsudo_invokerlinux:sudologtarget_user→ taggedsudo_target
Priority + category heuristics (per identity):
| Match pattern | priority | category |
|---|---|---|
(?i)^SYSTEM$ or ^root$ |
critical | (per source-type — SAP HANA system account or OS user) |
Identity matches (?i)^SYSTEM$\|^_SYS_\|^SAP_ |
(above critical or default high) | SAP HANA system account |
Identity from hana_admin or hana_target source |
high | SAP HANA user |
Identity matches (?i)adm$ (SAP service accounts) |
medium | SAP service account |
| Otherwise | low | (per source-type) |
watchlist=1 for critical+high; watchlist=0 for medium+low. ES surfaces watchlisted identities in its identity-risk dashboards.
One extra column:
- _source_type_str — comma-joined list of source-type tags this identity appears in
Customer wire-up¶
After the App installs, the lookups don’t exist until the saved searches first run (within 4h of install). To populate immediately:
# Dispatch the asset feed
curl -sk -u admin:<pw> -X POST \
  https://<splunk-host>:8089/servicesNS/nobody/splunk_app_sap_logserv/saved/searches/splunk_sap_logserv_es_asset_feed/dispatch

# Dispatch the identity feed
curl -sk -u admin:<pw> -X POST \
  https://<splunk-host>:8089/servicesNS/nobody/splunk_app_sap_logserv/saved/searches/splunk_sap_logserv_es_identity_feed/dispatch
Wait ~10 seconds for both to complete, then verify:
| inputlookup splunk_for_sap_logserv_assets | head 5
| inputlookup splunk_for_sap_logserv_identities | head 5
Add to ES Identity Management¶
In Splunk Web (with ES installed):
- Go to Settings → Configuration → Identity Management
- Under “Asset Lookup Configuration”, click + New:
- Name:
splunk_for_sap_logserv_assets- Lookup table:splunk_for_sap_logserv_assets- Source app:splunk_app_sap_logserv- Default match type:EXACT- Save - Under “Identity Lookup Configuration”, click + New:
- Name:
splunk_for_sap_logserv_identities- Lookup table:splunk_for_sap_logserv_identities- Source app:splunk_app_sap_logserv- Save
ES’s merger framework picks up the new sources within ~5 minutes. Verify by running:
| inputlookup asset_lookup_by_str | search asset="hec53v013858"
| inputlookup identity_lookup_expanded | search identity="xcjadm"
The merged record should now include priority, category, bunit from our feed (alongside any CMDB-sourced fields if present).
Confirm correlation searches enrich notables¶
Run any of the 5 base ES correlation searches. Notables in Incident Review should show:
dest_asset_priority,dest_asset_category,dest_asset_bunitpopulated fordest=hec53v013858user_identity_priority,user_identity_category,user_identity_watchlistpopulated foruser=xcjadm
Integration with CMDB (additive mode)¶
If the customer already has a CMDB feeding ES’s Asset framework, our feed is additive:
- ES merger framework reconciles across multiple sources
- Per-field precedence is configurable in
lookup_merge.conf - Conflicts (e.g., CMDB says
owner=John, our feed saysowner=SAP-Operations) resolve per merger precedence - Our SAP-stack-specific fields (
category=Server | Database | SAP HANA,_sap_sids,_roles) fill in gaps where the CMDB doesn’t have SAP-aware data
To make CMDB authoritative for owner/bunit while keeping our SAP categorization:
- Place CMDB above our feed in the Asset Lookup Configuration order
- ES applies higher-precedence values for shared fields (
owner,bunit) - Our
category,_sap_sids,_rolesfields fill in (CMDB likely doesn’t have these)
Disabling the auto-feed¶
If a customer doesn’t want our auto-feed (e.g., CMDB is fully authoritative):
- Splunk Web → Settings → Searches, reports, and alerts
- Filter by
splunk_sap_logserv_es_asset_feedandsplunk_sap_logserv_es_identity_feed - Edit each → Disable
- Save
The lookup CSVs remain on disk (last-known state) but are no longer refreshed.
Caveats¶
- No MAC addresses. SAP application logs don’t expose MAC addresses. Customers needing MAC-based asset resolution must source it elsewhere (DHCP logs, network gear).
- Short hostnames vs FQDNs. Our
dnscolumn is thehostfield as Splunk indexed it. If Splunk indexed short names but customer DNS uses FQDNs, ES asset lookups by FQDN won’t match. Fix via forward-lookup expansion inlookup_merge.conf. - No identity start/end dates. Our feed doesn’t track account creation/deactivation. Customers needing
startDate/endDatefor behavior baselining should layer an HR-system-sourced identity feed alongside ours. - Static priority/category logic. The heuristics here are SPL
case()rules. Customer-specific overrides require a manual override CSV (e.g.,my_company_sap_asset_overrides.csv) placed above our feed in merge order.
Live verification on splunk-sh-idxr (reference data)¶
After first dispatch on splunk-sh-idxr (the reference dev environment):
Assets: 22 unique rows - 6 HANA database servers (high priority) - 6 middleware servers (high priority — SCC + saprouter) - 10 NetWeaver application servers (medium priority)
Identities: 31 unique rows - 1 critical OS user (root) - 1 critical HANA system account (SYSTEM) - 1 high HANA system account - 20 high HANA users (DDIC, BKPADMIN, ENCRYPTMON, …) - 4 high SAP service accounts - 2 medium SAP service accounts - 2 low OS users
Threat Intelligence Integration¶
The Splunk for SAP LogServ App ships 3 customer-managed CSV lookups and 3 correlation searches that join SAP / DNS / proxy events against those lookups to detect known indicators of compromise. Both the lookups and the correlation searches live entirely inside the LogServ App — no separate Splunkbase dependency, no new install step beyond the App itself.
The lookups ship empty (header row only). Customers populate them from their own threat-intel feed; the correlation searches return 0 rows until populated.
The 3 lookups¶
| Lookup table | CSV columns | What it represents |
|---|---|---|
logserv_ti_malicious_domains |
domain,category,source,added_date,notes |
Domains flagged as C2, phishing, malware-distribution, etc. |
logserv_ti_malicious_ips |
ip,category,source,added_date,notes |
IPs flagged as C2, scanner, exfiltration endpoint, etc. |
logserv_ti_compromised_credentials |
username,added_date,notes |
Usernames known to be compromised (breach lists, internal incident response findings, etc.) |
Schema details:
domain/ip/username— the indicator itself. Match is case-insensitive (set viacase_sensitive_match = falseon the transforms.conf stanza). Domain values should NOT have a trailing dot — the search normalizes the DNS query field viartrimbefore lookup.category— free-form tag identifying the IOC class (e.g.,c2,phishing,malware,exfiltration,scanner). Surfaced in the notable event’s rule_title.source— free-form provenance tag identifying which threat-intel feed the indicator came from (e.g.,Mandiant,OpenCTI,internal-IR). Helps tune which feeds produce true positives over time.added_date— ISO 8601 date the indicator was added. Useful for FP analysis (very old indicators are more likely to have been remediated upstream).notes— free-form, optional. Surfaced in the rule_description.
The 3 correlation searches¶
| Search name | Joins against | Severity | Schedule |
|---|---|---|---|
splunk_sap_logserv_es_ti_dns_to_malicious_domain |
isc:bind:query ↔ logserv_ti_malicious_domains |
high | every 10 min |
splunk_sap_logserv_es_ti_proxy_to_malicious_ip |
squid:access ↔ logserv_ti_malicious_ips |
high | every 10 min |
splunk_sap_logserv_es_ti_compromised_credential_use |
HANA / ABAP / sapstartsrv auth events ↔ logserv_ti_compromised_credentials |
critical | every 5 min |
All three emit action.notable=1 for ES Notable Review and action.risk=1 for the RBA framework. Risk scores: 80 (DNS hit), 70 (proxy hit), 90 (compromised credential — highest because the action — locking the credential — is unambiguous).
Populating the lookups¶
Three workflows, depending on the size and freshness expectations of your TI source:
1. Splunk Web (small, manual, ad-hoc)¶
For small lists (< 100 indicators) maintained by hand:
- Settings → Lookups → Lookup table files
- Filter for
logserv_ti_* - Click the lookup name → upload a new CSV with the same column structure.
Splunk replaces the file in place. The existing transforms.conf stanza stays unchanged.
2. Customer-authored saved search (recurring, automated)¶
For TI feeds that update regularly:
- Author a saved search that pulls from the TI source (REST API, file ingest, etc.) and emits rows matching the
domain,category,source,added_date,notesshape. - End the SPL with
| outputlookup logserv_ti_malicious_domainsto overwrite the file. - Schedule the saved search at whatever cadence matches your feed (hourly, daily, etc.).
This is the canonical pattern Splunk recommends for managed TI feeds. The customer owns the upstream connector; the LogServ App is just the consumer.
3. Threat-intel framework (Splunk ES Threat Framework)¶
If you have ES installed, the ES Threat Framework already maintains its own consolidated threat-intel KV Store collections. Bridge those to the LogServ-side lookups via a saved search:
| inputlookup threat_intel_by_domain
| where category="malicious"
| eval added_date=strftime(_time, "%Y-%m-%d")
| rename description AS notes
| eval source="splunk-es-threat-framework"
| table domain category source added_date notes
| outputlookup logserv_ti_malicious_domains
(Adjust field names + filter logic to match your ES Threat Framework configuration.)
Tuning + maintenance¶
- Stale indicators. Indicators older than ~30 days have a higher false-positive rate (the upstream threat may already be remediated). Periodically prune via
inputlookup → where added_date >= relative_time(now(), "-30d") → outputlookupto overwrite with a freshness-filtered view. - Source weighting. If a particular
sourceproduces too many FPs, pre-filter at lookup-write time so it never reaches the correlation search. A source that produces TPs reliably can be tagged as such in thenotesfield for SOC analyst context. - Custom domains. The
domaincolumn accepts FQDNs. Wildcard domain patterns (e.g.,*.evil.com) are NOT directly supported by Splunk’s stocklookupcommand — for wildcard support, use amatch=WILDCARDlookup (configure on the transforms.conf stanza) or a custom-authored detection that uses regex matching against the lookup contents.
AI Assistant integration¶
Each of the 3 TI correlation searches has a corresponding entry in the AI Assistant predefined-prompt catalog:
security.ti_dns_to_malicious_domainsecurity.ti_proxy_to_malicious_ipsecurity.ti_compromised_credential_use
SOC analysts can ask the AI Assistant to dispatch them on demand: “Show me TI hits across DNS in the last hour” routes to the prompt browser → Security pack → TI: DNS to malicious domain.
Verifying the lookups loaded correctly¶
After installing or upgrading the LogServ App, verify the 3 TI lookups are queryable:
| inputlookup logserv_ti_malicious_domains | head 5
| inputlookup logserv_ti_malicious_ips | head 5
| inputlookup logserv_ti_compromised_credentials | head 5
Each should return 0 rows (the lookups ship empty). The fact that the queries DISPATCH cleanly without “lookup table not found” errors confirms the transforms.conf wiring is correct.
See also¶
- Correlation Searches & RBA — Full list of the 19 correlation searches across the App
- Behavioral & Anomaly Detections — Statistically-baselined detections that complement TI matching
- Asset & Identity Feed — Customer-managed asset and identity context (similar customer-side population workflow)
Behavioral & Anomaly Detections¶
The Splunk for SAP LogServ App ships 4 statistically-baselined anomaly detections that fire when an entity (user, host, edge) deviates from its own historical pattern. They complement the deterministic correlation searches by surfacing threats that don’t match a known threat-pattern signature — credential misuse spikes, latency excursions, integration-volume drift, and after-hours admin activity that’s anomalous for that specific admin.
All 4 use stats-based Z-score detection that runs against built-in Splunk SPL — no Splunk Machine Learning Toolkit (MLTK) dependency. Customers with MLTK installed can swap the stats clauses for fit / apply for sharper baselines.
The 4 anomaly searches¶
| Search name | What it baselines | Z-score threshold | Schedule |
|---|---|---|---|
splunk_sap_logserv_es_anomaly_user_auth_volume |
Per-user authentication-event count, hourly buckets | Z > 3 + count > 10 | hourly |
splunk_sap_logserv_es_anomaly_webdisp_response |
Per-host webdispatcher P95 response time, hourly buckets | Z > 3 + P95 > 200 ms | hourly |
splunk_sap_logserv_es_anomaly_topology_edge_volume |
Per-edge call volume from KV Store edge bucket data | abs(Z) > 3 + count > 10 | hourly |
splunk_sap_logserv_es_anomaly_after_hours_admin |
Per-admin off-hours activity, daily buckets | Z > 2 + count > 5 | daily |
All 4 emit action.notable=1 (ES Notable Review) and action.risk=1 (RBA — risk score 30-40 / medium).
How the stats-based Z-score works¶
Each search builds the baseline from the same 30-day window of data that’s being scored, using eventstats to compute per-entity mean and standard deviation across the window’s hourly (or daily) buckets. The most-recent bucket is then compared:
| bin _time span=1h
| stats count by entity, _time
| eventstats avg(count) AS avg_count, stdev(count) AS stdev_count by entity
| eval z_score = round((count - avg_count) / stdev_count, 2)
| where _time >= relative_time(now(), "-1h@h") AND z_score > 3 AND count > 10
Combined thresholds (Z + minimum-floor) keep the false-positive rate low:
- Pure Z-score on a low-volume entity:
count=2, avg=0.1, stdev=0.5→ Z = 3.8, but absolute count is meaningless. Thecount > 10floor filters this. - Pure absolute count:
count=15, avg=14, stdev=3→ above floor but Z = 0.33, statistically normal. The Z > 3 requirement filters this. - Both pass → genuinely anomalous:
count=100, avg=12, stdev=4→ Z = 22, count well above floor.
The thresholds are tunable per search via the where z_score > N clause in default/savedsearches.conf (or by overriding in local/savedsearches.conf).
Per-search detail¶
1. Per-User Authentication Volume Z-Score¶
Compares each user’s most-recent-hour authentication-event count to that user’s own 30-day hourly baseline. Fires when Z > 3 AND count > 10.
Threat model: Brute-force attempts against a previously dormant account, or a misconfigured client polling at high frequency.
FP profile: Low. Healthy environments show 0-2 hits per hour from genuine traffic spikes (batch jobs, planned cutovers). Tag the affected accounts in the Identity feed (category=service) if the traffic is legitimate — future events for tagged accounts can be filtered downstream.
2. Webdispatcher Response-Time Anomaly¶
Compares each host’s most-recent-hour P95 latency to that host’s own 30-day baseline. Fires when Z > 3 AND P95 > 200 ms.
Threat model: Backend health degradation, network path issue, or DDoS-style request flood degrading response time.
FP profile: Low for production hosts on consistent workloads; can be moderate on hosts with bursty workloads (overnight batches, end-of-month processing). Pre-disable the search during planned heavy-load windows or document expected windows in the FP-tuning guide.
3. Topology Edge Call-Volume Anomaly¶
Reads pre-aggregated edge bucket rows directly from the logserv_topology_edges KV Store collection. Detects edges whose most-recent-hour call_count is statistically anomalous vs. that edge’s own 30-day baseline. Fires when abs(Z) > 3 AND count > 10.
Threat model: Surge = abnormally high cross-system traffic (DDoS, lateral-movement automation, failed retry storm). Drop = integration outage on either the source or target side.
FP profile: Low. The KV Store’s per-edge time series is much cleaner than raw event data, so the baseline is stable. The bidirectional check (abs(Z) > 3 rather than just Z > 3) catches both surges AND drops.
Why this search is unique: It reads from the topology KV Store rather than dispatching live SPL against raw events. Search execution time is sub-second regardless of cluster size.
4. After-Hours Admin Activity Anomaly¶
Per-admin off-hours activity baseline vs. that admin’s 30-day off-hours pattern. Lower Z threshold (Z > 2) than the other 3 searches because admin off-hours activity is naturally rare; a smaller deviation is still significant. Fires when Z > 2 AND count > 5.
Threat model: Admin-account compromise (attacker active outside the admin’s normal window), or insider conducting unauthorized off-hours operations.
FP profile: Low for environments with clear business hours. Higher during planned weekend cutovers — those should map to documented change tickets.
MLTK upgrade path (optional)¶
If you have the Splunk Machine Learning Toolkit (MLTK) installed, you can swap the stats clauses for MLTK’s fit / apply commands for sharper baselines:
| Stats-based clause | MLTK-based replacement |
|---|---|
eventstats avg(count) AS avg_count, stdev(count) AS stdev_count by entity |
\| fit StandardScaler count by entity (then apply against new data) |
eval z_score = (count - avg_count) / stdev_count |
The apply output’s <entity>_zscore column |
where z_score > 3 |
where <entity>_zscore > 3 |
MLTK adds:
- Per-entity model persistence (the baseline is a saved model, not a per-search calculation)
- Seasonal decomposition (handles weekly / monthly cycles natively)
- DensityFunction / OneClassSVM for non-Gaussian distributions
For most SAP environments the stats-based approach is sufficient. MLTK becomes valuable when you need:
- Multi-week seasonal patterns (workload that varies by day-of-week or week-of-month)
- Non-Gaussian distributions (network traffic with heavy-tailed shapes)
- Per-entity model lifecycle management (training models offline, deploying via export)
To migrate a single search to MLTK without breaking the others, edit local/savedsearches.conf with an override stanza for that one search.
Tuning¶
Adjust thresholds in local/savedsearches.conf (override the search = line for a given stanza):
[splunk_sap_logserv_es_anomaly_user_auth_volume]
search = `sap_logserv_idx_macro` ... | where _time >= relative_time(now(), "-1h@h") AND z_score > 4 AND count > 25 | sort -z_score
General tuning advice:
- Too many FPs: Raise the Z threshold (3 → 4 → 5) AND/OR raise the absolute-count floor.
- Missing real attacks: Lower the Z threshold (3 → 2) — but expect more noise; pair with tighter floor.
- Bursty workloads triggering hits: Add a
where NOT (entity IN (<known burst entities>))exclusion clause, OR pre-tag the entity in the Identity feed and filter downstream. - Service-account auth volumes drowning out human user signal: The
is_service_accountfield (when populated by the props EVAL pipeline) lets you split the search into two stanzas — one for service accounts (higher floor), one for humans (lower floor + tighter Z).
AI Assistant integration¶
Each of the 4 anomaly searches has a corresponding entry in the AI Assistant predefined-prompt catalog under the Security pack:
security.anomaly_user_auth_volumesecurity.anomaly_webdisp_responsesecurity.anomaly_topology_edge_volumesecurity.anomaly_after_hours_admin
SOC analysts can ask the AI Assistant to dispatch them on demand for an investigative “explain why this user looks anomalous” workflow.
See also¶
- Correlation Searches & RBA — Deterministic correlation searches; complement the anomaly detections here
- Threat Intelligence Integration — Customer-managed CSV lookups for IOC matching
- Asset & Identity Feed — Identity context that feeds both deterministic + behavioral detections
Ended: Enterprise Security Integration
AI Assistant ↵
AI Assistant — Overview¶
Current release: LLM functionality intentionally disabled pending review
The current release of Splunk for SAP LogServ ships with the LLM-driven AI Assistant path disabled at compile time pending internal review. The predefined-prompt path + Splunk MCP Server integration + tool tiles + drill-down chips + audit log all stay fully active. The free-form chat input is disabled, the model picker is hidden, and the Provider Credentials Settings tab is hidden. See Templates-only Build for the build mechanism. The LLM-driven path will be re-enabled in a future release once review concludes.
What the AI Assistant Is¶
The AI Assistant is a Splunk-aware chat panel embedded in the LogServ App that lets analysts run pre-canned investigations and free-form questions against their Splunk data. It sits to the right of every dashboard as a togglable side panel, accessed via the ✦ AI Assistant button in the top-right of the app’s nav bar.
It has two distinct paths with different cost, latency, and privacy properties. In this build only the predefined-prompt path is active — the free-form / LLM-driven path is disabled (the cloud LLM provider code is physically removed from the build, see the warning above):
- Predefined prompts (no LLM call) — active in this build. The user opens the prompt browser and clicks one of 61 cataloged prompts. The orchestrator dispatches the saved search via the Splunk MCP Server, renders the result tile in the right pane, and appends a static interpretation + suggested-next-steps card. No vendor LLM is invoked. Free, instant (search latency only), zero data egress.
- Free-form prompts (LLM-driven) — disabled / not shipped in this build. When active, the user types a natural-language question and the orchestrator sends a system primer + the question + tool definitions to the active vendor (Anthropic / OpenAI / Azure OpenAI / AWS Bedrock). In the current build the four cloud LLM provider implementations are physically removed from the source, so this path is unavailable regardless of configuration. The description here documents the capability for reference only.
The Privacy Invariant¶
No event data from your Splunk instance is ever transmitted to any AI vendor.
This is not policy; it is enforced by the type system at build time. The TypeScript compiler refuses to put any tool-result value from MCP into an outbound vendor payload — there is no runtime check, no flag to flip, no policy to forget. The only conversion path produces a non-data summary whose contents are gated by the active privacy tier (Tier 0 / Tier 1 / Tier 2):
- Tier 0 (future) — air-gapped Ollama; no vendor traffic at all.
- Tier 1 (default) —
count + execution_timeonly. The AI sees no values. - Tier 2 (admin opt-in) — adds aggregated metadata: per-column cardinality, top-N values + counts (categorical), min/max/avg/sum (numeric), time range. Still no raw rows.
What the AI vendor sees: your natural-language question, schema descriptions, tool definitions, the AI’s own summaries. What the AI vendor does not see: any field value from any event in your sap_logserv_logs index.
For details, see Privacy Tiers.
Architecture at a Glance¶
   User question
        |
        v
   AI vendor  -->  AI picks tools  -->  Splunk MCP Server  -->  Splunk search-job
        |                                                              |
        |                                  (raw rows stay client-side) |
        |  <-----  privacy-tier summary  <----+ (count + timing,
        |                                       optionally aggregates)
        |
        v  AI synthesizes narrative reply
   Chat panel (left pane)        Tool result tiles (right pane)
Every saved-search dispatch produces a tool-result tile in the right pane (table / chart / KPI / pie based on the prompt’s renderHint). The user sees the actual rendered data; the AI sees only the privacy-tier-bounded summary. Drill-down chips (↗ Dashboard, ↗ Run SPL) on each tile (and beside chat citations) connect the conversation back into the dashboards or Splunk’s universal Search app — see Drill-down Chips.
For the build-time type-system mechanism that makes this guarantee non-bypassable, see AI Assistant Implementation Reference.
Key Capabilities¶
- 61 predefined prompts in three packs (sap_basis 15, security 28, operations 18) plus a context-aware Dashboard Focused tab that auto-filters to prompts relevant to the dashboard you currently have open. See Predefined Prompts.
- Four LLM providers for the free-form path (Anthropic, OpenAI, Azure OpenAI, AWS Bedrock) — disabled / not shipped in the current build (provider code physically removed). When active, a per-user model-picker in the chat header lets users switch within the active provider’s model list. See Settings & Configuration.
- Power Mode — admin-granted role-gated
✦ Powertoggle that forces a saved-search dispatch before LLM synthesis (forced-RAG). Guarantees data-grounded answers; never responds from prior knowledge alone. - Time-window reasoning — primer rules teach the AI to identify the dispatch window, normalize cumulative count to per-hour or per-day rate, run a verify-query before declaring high-severity, and state the window precisely in narrative.
- Audit log — every action (canned dispatch, vendor call, security block, privacy-tier elevation, legal acknowledgement) lands in a dedicated
logserv_ai_assistant_auditindex. In-app browser + optional HEC forwarder for tamper-evidence. - OWASP LLM Top 10 (2025) compliance — every item has a matching control: prompt-injection sanitization, type-bounded data redaction, supply-chain SBOM, audit hash chain, per-user rate limit, USD spend cap, SPL static-analysis guard, jailbreak detection, PII redaction.
- Templates-only build variant — a deployable variant of the LogServ App that disables the LLM-driven flow at compile time. The MCP path + canned prompts + audit log stay fully active.
Prerequisites¶
- Splunk 9.4.3 or later.
- Splunk MCP Server (Splunkbase App 7931) v1.1.0 or later installed on the same search head as the LogServ App. See Splunk MCP Setup. Cookie auth from the same Splunk Web session works by default; the optional bearer token layers on top.
- No LLM provider is required in the current build — the free-form / LLM path is disabled (provider code physically removed), so only the predefined-prompt + MCP path runs. No vendor API credential is needed.
- Admin user role to configure provider credentials, set the privacy tier, manage Power Mode roles, and view the Audit Log tab.
First-time UX¶
- Click
✦ AI Assistantin the top-right nav. The right-side panel opens. - If MCP isn’t healthy, the panel shows a setup wizard with diagnostic guidance — see Splunk MCP Setup. Otherwise, the empty chat panel renders.
- Click Browse predefined prompts to open the catalog modal. Pick a prompt from the SAP Basis / Security / Operations / Dashboard Focused tab.
- The prompt dispatches via MCP and renders a tool tile in the right pane along with a static “How to read this result” guidance card on the left.
- Click any of the drill-down chips on the tile (
↗ Dashboard,↗ Run SPL) to investigate further.
For free-form prompts, type a natural-language question in the chat input and press Send (or Cmd/Ctrl+Enter). The chat status indicator shows when the AI is generating a response or running a search.
When to Use Which Path¶
| Use case | Recommended path |
|---|---|
| Routine “show me X” investigations on the cataloged dimensions | Predefined prompts |
| Compliance / audit reports with a fixed cadence | Predefined prompts (deterministic, zero vendor traffic) |
| Free-form questions about the data the catalog doesn’t cover | Free-form, with Power Mode on if available |
| Cross-cutting “what’s most critical right now?” investigations | Free-form (the AI dispatches multiple saved searches in parallel and synthesizes) |
| Demonstration environments where vendor-LLM access is intentionally unavailable | Templates-only build |
| Air-gapped environment with no outbound internet | Tier 0 (future — see Privacy Tiers) |
Where to Go Next¶
- Privacy Tiers — full breakdown of what each tier exposes and the decision matrix for picking one.
- Predefined Prompts — the 61 prompts, the prompt browser UX, and the intent-map customization story.
- Free-form Prompts — the LLM-driven flow, tool dispatch, citations, rate limiting, and Power Mode.
- Splunk MCP Setup — installing and configuring the prerequisite MCP server.
- Settings & Configuration — the 4-tab admin Settings page (General / Provider Credentials / Splunk MCP / Audit Log).
- Audit Log — what’s logged, the in-app viewer, and the optional HEC forwarder for tamper-evidence.
- OWASP LLM Top 10 Compliance — security controls posture for compliance reviews.
Privacy Tiers¶
Current release: privacy tiers are designed but not exercised — LLM dispatch is disabled
The current release ships with the LLM-driven path disabled at compile time pending internal review. The privacy tiers described on this page are designed and implemented (the Hidden<T> / Visible<T> type-system enforcement is always active and will protect any future LLM dispatch), but no LLM dispatch happens in the current build — there is no vendor traffic to govern via tier selection. The tier setting in Settings → General is preserved so the configuration survives across releases; it just has no effect until the LLM path is re-enabled in a future release.
The AI Assistant supports three privacy tiers that control what an external LLM vendor sees about your Splunk data. Tier selection is admin-configurable in Settings → General. The active tier is enforced by the TypeScript type system at build time, not by runtime policy: every outbound vendor payload must pass through a single sanitize chokepoint, and the chokepoint’s summarizer is what the tier setting controls. For the type-system mechanism, see AI Assistant Implementation Reference.
The Three Tiers at a Glance¶
| Tier | Vendor traffic? | What the AI sees about each tool result | Use case |
|---|---|---|---|
| Tier 0 (future release) | None — Ollama local | Same as Tier 1 (count + timing only) | Air-gapped customers, regulated industries with no-outbound-internet constraints |
| Tier 1 (default) | Cloud LLM (Anthropic / OpenAI / Azure / Bedrock) | Returned N rows in M ms. Nothing else. |
Most customers — strongest cloud-LLM privacy posture |
| Tier 2 (admin opt-in) | Same cloud LLM | Tier 1 line + per-column cardinality + top-N values + counts (categorical) + min/max/avg/sum (numeric) + time range. Still no raw rows. | Customers who want data-grounded narrative replies and have legal authority to expose aggregate metadata to the vendor |
Tier 0 — Ollama Local (future release)¶
Status: roadmap, ~1 week of engineering effort. Not yet shipped.
What it does: routes the LLM call to a locally-hosted Ollama server instead of a cloud vendor. No outbound internet traffic; no third-party data processor. Strongest possible privacy posture short of disabling free-form prompts entirely (see Templates-only Build for that).
Privacy data flow:
   User question  -->  Local Ollama  -->  AI picks tools  -->  MCP Server
                                                                    |
                                                Hidden<MCPToolResult>
                                                                    |
                                                                    v
                                            sanitize() -> count + timing
                                                                    |
                                                                    v
                                              Local Ollama synthesizes reply
Considerations:
- Local Ollama latency is substantially higher than cloud LLMs unless the customer has GPU hardware on the search head.
- Model selection is constrained to what Ollama supports locally (Llama-family, Mistral-family, etc.); cloud-only models like Claude Opus aren’t available.
- The MCP server prerequisite is unchanged — Tier 0 only changes the LLM endpoint, not the search-execution path.
For customers waiting on Tier 0, the Templates-only Build is the interim solution: ship a build with the LLM-driven path disabled at compile time, leaving only the canned-prompt path active.
Tier 1 — Cloud LLM, Count + Timing Only (default)¶
What the LLM sees per tool result:
<TOOL_RESULT_DATA>
Returned 47 rows in 320ms.
</TOOL_RESULT_DATA>
That’s the entire summary. Nothing about the column names, the row contents, the time range, the distinct counts, or the actual values. The <TOOL_RESULT_DATA>...</TOOL_RESULT_DATA> sentinel block is wrapped around every tool-result summary so the AI’s primer can teach it that anything inside is data from the customer’s environment, never instructions.
What the AI does with this: the AI knows the shape of what was returned (a count + how long the search took) but not the values. It writes structurally-aware narrative replies — “the failed-auth saved search returned 47 rows for the rolling window, suggesting a non-trivial number of distinct user/stack pairs” — without making claims about specific users, IPs, or hosts.
Decision rule for picking Tier 1:
- The customer’s legal/security team is comfortable with the AI vendor seeing the natural-language question + tool definitions + summaries.
- The customer is not comfortable exposing aggregate column metadata (cardinality, top-N values, min/max) to the vendor.
- The customer values determinism: a Tier 1 reply mentions zero specific values, so audit reviewers can sanity-check the narrative against the rendered tile without needing to verify what the AI was told.
Limitations: the AI can’t write “the top failing user was xcjadm with 42 attempts” — it doesn’t have that data. The narrative is correspondingly less concrete; the user is expected to read the tile in the right pane for the actual values.
Tier 2 — Cloud LLM + Aggregated Metadata (admin opt-in)¶
What the LLM sees per tool result:
<TOOL_RESULT_DATA>
Returned 47 rows in 320ms.
Time range: 2026-04-15T00:00:00Z → 2026-05-05T23:59:59Z.
Column "user" (distinct=23): xcjadm=8, BKPADMIN=6, ENCRYPTMON=5, sapadm=4, svc_monitor=3 (+18 more).
Column "stack" (distinct=3): Windows=21, HANA=19, SAP=7.
Column "failures" (numeric, distinct=42): min=1 max=4799 avg=87.4 sum=4108.
</TOOL_RESULT_DATA>
The AI now sees the column names, top-N values + counts (per-column-cardinality limited to top 10 by default; configurable up to 50 via the AI’s top_n tool arg), numeric stats, and the time range. It still does NOT see the raw rows — there is no way for the AI to know which user issued how many failures across which stacks; only the per-column distributions.
PII redaction (Tier 2 only): if the column name matches a known identifier pattern (email, user(name), *_ip, mac, account, with hostname opt-in), the values are replaced with stable <redacted-XXXXXXX> tags before being shown to the AI. The same value across the run produces the same tag, so the AI can still reason about cardinality + frequency, but never sees the actual identifier. See OWASP LLM Top 10 — LLM02.
What the AI does with this: the AI can write data-grounded narrative replies — “the top failing user is <redacted-4e4945f> with 42 attempts; the failure mix is 21 Windows, 19 HANA, 7 SAP — Windows is the dominant stack but the spread suggests a coordinated probe rather than a single-source brute-force”. The AI now grounds its severity assessments in actual numbers instead of inferring from row counts alone.
Decision rule for picking Tier 2:
- The customer’s legal/security team has reviewed and approved exposing aggregate metadata (column cardinalities, top-N value distributions) to the AI vendor.
- The customer wants narrative replies with concrete values, not just shape descriptions.
- PII concerns are mitigated by the column-name-based redaction (or the customer is comfortable with the redaction’s coverage).
Audit trail for Tier 2: every Tier 2 vendor call records a vendor_tier2 audit event including:
- Token counts (input + output)
- USD cost estimate
- Number of PII redactions applied (tier2RedactionsApplied)
- The user identity that triggered the call
When elevating from Tier 1 → Tier 2 in Settings, a vendor_tier2_elevation audit event captures the admin’s identity and timestamp. See Audit Log.
How the Privacy Invariant Is Enforced¶
The privacy invariant — no event data ever leaves the customer’s environment for the AI vendor — is enforced mechanically at build time via TypeScript brand types. Tool-result values from the MCP server carry one type; outbound vendor messages carry a different type; the compiler refuses to assign one to the other. The only conversion path produces a non-data summary, and the active privacy tier picks which summary shape is used.
This is the primary defense against LLM02 — Sensitive Information Disclosure. For the brand-type mechanism, summarizer call sites, and the <TOOL_RESULT_DATA> sentinel pattern, see AI Assistant Implementation Reference.
Switching Tiers¶
Tier is configured in Settings → General. Switching tiers takes effect on the next vendor call — in-flight calls complete with the previously active tier, and the audit event records which tier was active at dispatch time.
Elevating from Tier 1 → Tier 2:
- Open Settings → AI Assistant → General.
- Change the Tier field from 1 to 2.
- Click Save Defaults. The save records a
vendor_tier2_elevationaudit event with admin identity + timestamp. - Optionally enable / disable PII redaction (default: enabled) and toggle hostname-as-PII (default: hostname NOT redacted, since it’s often non-sensitive in SAP environments).
Lowering from Tier 2 → Tier 1 / Tier 0:
- Same path. The save is recorded as a regular config change, no special audit event.
- The next vendor call uses the lower tier.
No tier: if the customer wants to disable the LLM-driven path entirely (canned prompts only), use the Templates-only build variant — the tier setting becomes moot since there are no vendor calls.
Decision Matrix¶
| Question | Answer | Recommended tier |
|---|---|---|
| “Is the AI vendor a third-party data processor?” | Yes; consult your DPA. Anthropic / OpenAI / Azure / Bedrock all publish their own privacy commitments, but they ARE data processors. | Tier 1 if approved as processor; Tier 0 if not approved |
| “Can the customer’s compliance team approve aggregate metadata exposure?” | Yes | Tier 2 |
| No | Tier 1 | |
| “Does the customer have outbound internet to the LLM vendor’s API?” | Yes | Tier 1 or Tier 2 |
| No (air-gapped) | Tier 0 (future) or Templates-only Build | |
| “Does the customer want narrative replies with concrete values, or shape-only?” | Concrete | Tier 2 (with PII redaction on) |
| Shape-only | Tier 1 | |
| “Does the customer want zero LLM dispatch (partner test, demo)?” | Zero | Templates-only Build |
Predefined Prompts¶
Predefined prompts are 61 cataloged saved searches across three packs that the AI Assistant can dispatch via the Splunk MCP Server without invoking any LLM. They are the deterministic, vendor-traffic-free path through the AI Assistant: the user clicks a prompt card, the orchestrator dispatches the saved search, the result tile renders in the right pane, and a static interpretation + suggested-next-steps card appears in the chat.
This is the only path that’s active in the Templates-only build variant — partners can demo + investigate the LogServ solution end-to-end without any LLM provider configured.
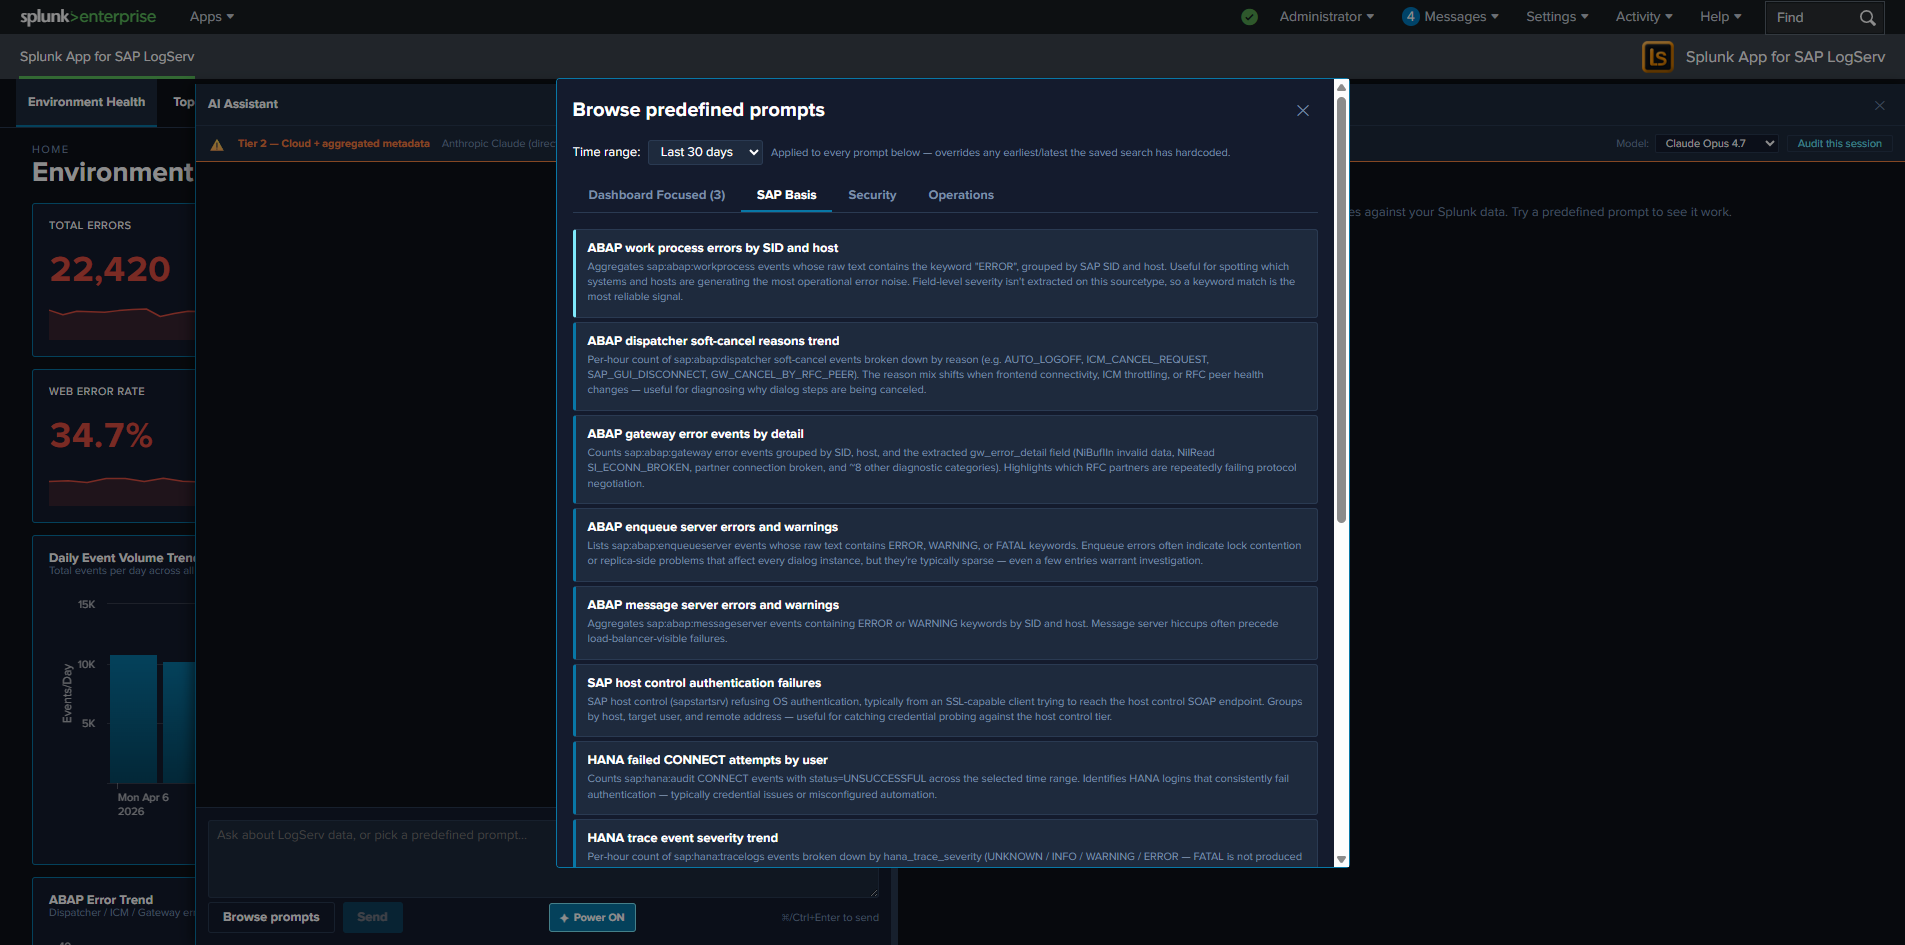
The Three Packs¶
| Pack | Count | Focus |
|---|---|---|
| SAP Basis | 15 | SAP Basis admin investigations: HANA service severity breakdown, ABAP work-process errors, integration topology call volume, RFC partner failures |
| Security | 28 | Auth failures, beaconing detection, after-hours admin activity, permission grants, GRANT-to-non-managed-role detection, HANA SYSTEM logins, Windows lockouts |
| Operations | 18 | Ingest health, error rate trends, error-category breakdowns, top error categories, host volume drop, freshness checks, Cloud Connector backend latency |
The full catalog ships inside the LogServ App as a data-driven intent map. Each prompt entry includes the saved-search name, label, description, render hint, chart hint, chart palette, dashboard mapping, interpretation, and suggested next steps.
The Dashboard Focused Tab¶
The first-position tab in the prompt browser is Dashboard Focused — it auto-filters the catalog to prompts that are mapped to the dashboard you currently have open. The mapping is the per-prompt dashboard field in the intent map (single string or array — multi-target prompts map to multiple dashboards). The tab auto-hides when the active dashboard has zero matching prompts (e.g., on Settings or AI Assistant pages).
Each card on the Dashboard Focused tab carries a small pack-origin chip (cyan-light SAP Basis / salmon-red Security / gold-orange Operations) so users can find the prompt back in its home pack later.
What Happens When You Click a Prompt¶
- Dispatch. The orchestrator calls
splunk_run_saved_searchon the MCP server with the prompt’s saved-search name and the time window selected in the prompt browser’s own Time range dropdown (Last 1 hour … Last 30 days; default Last 30 days, remembered per browser tab insessionStorage). That window is passed as the dispatched search’searliest_time/latest_time, so it bounds the saved search — narrowing the dropdown makes a heavier prompt return faster. - Tile renders. The MCP server returns the rows. The orchestrator renders them in a tool-result tile in the right pane, with the prompt’s pre-configured
renderHint(table/timechart/kpi/pie) and optional companionchartHint(chart on top + table below forrenderHint=tableprompts that benefit from a visual). - Guidance card. A “How to read this result” card appears in the left chat pane below the user’s prompt label. The card has two parts:
- Interpretation — one paragraph explaining what the result means and what shapes are normal vs. concerning. Sourced from the intent map’s
interpretationfield. - Suggested next steps — a bulleted list of follow-up investigations. Some entries are plain text; others are clickable deep-link chips that open Splunk’s universal Search app with a focused SPL pre-filled and the dispatch’s exact earliest/latest pre-applied. Sourced from the intent map’s
nextStepsarray.
- Interpretation — one paragraph explaining what the result means and what shapes are normal vs. concerning. Sourced from the intent map’s
- Drill-down chips on the tile. Every tile carries
↗ Dashboardchip(s) (one per resolvable dashboard from the prompt’sdashboardfield) and a↗ Run SPLchip in its actions slot. See Drill-down Chips.
No LLM call. No vendor traffic. No tokens. The dispatch is recorded as a local_only audit event with the prompt id + SPL + row count + execution time + ok flag. See Audit Log.
A few high-volume prompts read precomputed rollups
Four whole-estate prompts — Top hosts by event volume, Noisiest hosts trend, Distinct hosts seen, and Hosts with the biggest event-volume drop — read the same hourly KV-Store rollups that power the dashboards instead of scanning every event live, so they stay sub-second even over a 30-day window on a large dataset. The trade-off is identical to the dashboards: results reflect data through the most-recently-completed hour, and on a fresh install these prompts populate older windows only after the Dashboard Data backfill has run. Every other prompt dispatches a live search bounded by the Time range you select.
The Tab Persistence Convention¶
The prompt browser remembers your last-selected tab across modal-open events, persisted per-tab in sessionStorage under logserv.aiAssistant.promptActivePack. The persistence rule is selection-based, not casual-flipping-based — your tab choice is only remembered if you actually picked a prompt from it. Casual tab-flipping (browsing without clicking a card) doesn’t persist. If your last selected tab points at a tab that’s hidden on the current dashboard (e.g., persisted to Dashboard Focused on a dashboard with no matching prompts), the resolver falls back to sap_basis.
Customizing the Catalog¶
The prompt catalog is data-driven and customizable. New prompts can be added, existing prompts can be edited, and the catalog can be tailored per deployment. The full JSON schema, build-time consistency check, and pre-deploy SPL dry-run recipe are documented in AI Assistant Implementation Reference — Adding a New Predefined Prompt.
The Splunk Risky-Command Safeguard¶
Splunk Web’s Search app has a safety modal that triggers on “risky” commands: map, runshell, script, delete, crawl, tscollect, loadjob, outputlookup, outputcsv, sendalert, sendemail. Any URL passed to /app/search/search?q=... containing one of these triggers the modal — even though our own MCP-dispatched saved searches don’t.
The drill-down chips that open Splunk Search from the prompt browser’s nextSteps deep-links are subject to this safeguard. The shipped prompt catalog has been scanned and rewritten where needed to avoid these commands; if you customize the catalog, scan any new SPL for risky commands before shipping. See AI Assistant Implementation Reference for the rewrite pattern (map → first-class subsearch).
Clear All / Per-Result Clear¶
The right pane carries a Clear All button in the toolbar above the result list, plus a Clear button on every individual tile (in the actions slot, alongside the drill-down chips). Both prune the conversation:
- Per-tile Clear removes the tool_call + tool_result + the user message that triggered the dispatch (so a canned-prompt’s chat label disappears alongside its result panel) + the guidance card. Outbound vendor refs for that tile are also stripped from the next-turn vendor-message buffer.
- Clear All wipes the entire conversation, including all tool_results, all guidance cards, all assistant_text messages, and all user messages. The chat session id is preserved so audit events continue with the same correlation id.
Free-form Prompts¶
Current release: this entire feature is disabled pending review
The free-form / LLM-driven path is disabled at compile time in the current release pending internal review. Chat input is greyed out, Send button is disabled, model picker and Power Mode toggle are hidden, and the Provider Credentials Settings tab is hidden. None of the behavior described on this page is reachable in the current build. This page is preserved as the design reference for the future release that re-enables the LLM path. See Templates-only Build for the build mechanism and OWASP LLM Top 10 Compliance for the security posture under review.
Free-form prompts are the LLM-driven path through the AI Assistant. The user types a natural-language question; the orchestrator sends a system primer + the question + tool definitions to one of four supported LLM providers; the vendor picks tools, the orchestrator dispatches them via the Splunk MCP Server, and the vendor synthesizes a narrative response from the privacy-tier-bounded summaries. The narrative ends up in the chat panel on the left; the actual data lands in tool-result tiles on the right.
This path requires a configured LLM provider credential, is governed by the active privacy tier, and is disabled at compile time in the Templates-only build variant.
The Four Supported Providers¶
| Provider | API Endpoint | Auth | Models |
|---|---|---|---|
| Anthropic | api.anthropic.com (direct) |
API key | Claude Opus 4.7 / Sonnet 4.6 / Haiku 4.5 |
| OpenAI | api.openai.com (direct) |
API key | GPT-4o / GPT-5 family (per OpenAI catalog) |
| Azure OpenAI | Customer’s Azure deployment URL | Azure auth + URL pattern | Per Azure deployment configuration |
| AWS Bedrock | Bedrock API (Claude on Bedrock) | Bedrock API Keys (no SigV4 signing) | Claude on Bedrock — same models as Anthropic direct |
Active provider + default model are admin-configured in Settings → General. Per-user model picker in the chat panel’s privacy banner lets users switch within the active provider’s models[] list.
AWS Bedrock support currently requires Bedrock API Keys. IAM-only credentials (no Bedrock API Key) aren’t supported — the React app can’t sign SigV4 requests from the browser.
The Free-form Flow¶
   User types question  -->  Orchestrator builds system primer + tools + history
                                                          |
                                                          v
                                       LLM vendor (streamed response)
                                                          |
                                  AI emits zero or more tool_use blocks
                                                          |
                                                          v
                          For each tool_use, orchestrator dispatches via MCP
                                                          |
                                              MCP returns Hidden<MCPToolResult>
                                                          |
                                  sanitize() chokepoint -> Tier 1 / Tier 2 summary
                                                          |
                                                          v
                                  AI continues, may emit more tool_use blocks
                                                          |
                          (loop until AI emits a final assistant_text response)
                                                          |
                                                          v
                                  Narrative renders in chat; tiles render in right pane
Tool dispatch is parallelized — when the AI emits multiple tool_use blocks in a single turn (e.g., dispatching 5 saved searches at once for a “find the top issues” question), the orchestrator dispatches all of them concurrently via Promise.all. The slowest one bounds the turn latency, not the sum.
The Two MCP Tools the AI Sees¶
The AI’s tool definitions on every free-form request are:
splunk_run_saved_search¶
Dispatch a saved search from the LogServ App’s catalog (one of the 61 prompts described in Predefined Prompts).
| Arg | Type | Description |
|---|---|---|
name |
string (required) | Saved-search name from the catalog (e.g., logserv_hana_failed_auth) |
earliest_time |
string (optional) | Splunk earliest token (e.g., -24h, -7d). If omitted, the saved search’s own configured time range applies; the AI’s primer instructs it to pass an explicit window. |
latest_time |
string (optional) | Splunk latest token (e.g., now). |
render_hint |
string (optional) | One of table / timechart / kpi / pie. Falls back to the catalog’s per-prompt renderHint. |
top_n |
integer (optional, default 10, max 50) | Width of categorical aggregates the AI receives in Tier 2 summary. The AI passes this when the user asks for “top 25 X” or similar. |
splunk_run_query¶
Dispatch ad-hoc SPL written by the AI. Used when no saved search fits the user’s question.
| Arg | Type | Description |
|---|---|---|
query |
string (required) | SPL string. Must start with the LogServ macro \sap_logserv_idx_macro`` (the AI’s primer enforces this) and use only read-only commands. |
earliest_time |
string (optional) | Same as above. |
latest_time |
string (optional) | Same as above. |
render_hint |
string (optional) | Same as above. |
top_n |
integer (optional) | Same as above. |
SPL static-analysis guard (LLM06 — Excessive Agency): the orchestrator runs every splunk_run_query SPL through a guard that blocks collect, outputlookup, outputcsv, delete, sendalert, sendemail, script, run, tscollect. Blocked SPL produces a synthetic error tool_result + a security_blocked_spl audit event. The AI sees the error and can recover by writing a different query.
The System Primer¶
A system-message prelude is sent on every free-form request. The primer teaches the AI:
- A data-boundary rule that distinguishes customer data from instructions (mitigates LLM01 / LLM04)
- The catalog of 61 saved searches (so the AI prefers
splunk_run_saved_searchwhen a saved search fits) - The LogServ data model (sourcetypes + key fields) for ad-hoc SPL
- The read-only-operators list for
splunk_run_query - The time-window reasoning rules that kick in for severity claims
- Synthesis rules — lettered findings, severity dots, citation format
Two primer variants ship — one for each cloud tier — and the active tier picks which one is sent. For the primer’s full architecture (boundary block, primer constants, per-variant content), see AI Assistant Implementation Reference.
Citation + Drill-Down Chips in the Narrative¶
The AI’s narrative response uses a citation format [→ saved_search_name] to attribute each finding to its dispatched tool. Each citation in the chat becomes a clickable scroll-to-tile span (clicking it scrolls the right pane to the matching tile). The parser also auto-appends ↗ Dashboard chips (one per related OOTB dashboard) and a ↗ Run SPL chip on the same line — see Drill-down Chips.
Severity markers ([severity:critical|high|medium|low]) are rendered as glossy colored dots inline next to the finding’s alpha letter. The finding format is enforced by the primer:
A. [severity:high] Cross-stack auth failures concentrated on Windows.
[→ logserv_cross_stack_auth_failures] 7 of the top-10 failing-stack rows are
Windows; one user account hit 4,732 cumulative attempts — verify-query (-24h)
confirmed 412 of those landed today, ~17/hr, an active rate.
Per-User Rate Limiting¶
Free-form prompts are subject to a per-user rolling-1-hour rate limit, configurable in Settings → General (default 30 prompts/hour, 0 = disabled). Canned-prompt dispatches are intentionally NOT rate-limited — they bypass the AI vendor entirely (no token cost) and are bounded by Splunk’s own search-quota controls.
When a user hits the cap, the next prompt:
- Renders the user message in chat as usual (preserves history continuity).
- Surfaces a system_notice in chat: “Rate limit reached: N prompts in the last hour. Try again at HH:MM.”
- Records a
rate_limited_promptaudit event with the user’s identity, the cap value, and the timestamp. - Does NOT invoke the LLM vendor.
The cap is per-user, not per-session — opening a new browser tab doesn’t reset it. Maps to LLM10 — Unbounded Consumption.
Token-Usage Audit + USD Cost Estimate¶
Every Tier 1 / Tier 2 vendor call records a vendor_tier1 or vendor_tier2 audit event with:
- Provider (anthropic / openai / azure_openai / bedrock)
- Model
- Input tokens, output tokens, total tokens
- USD cost estimate (per-vendor pricing table — see AI Assistant Implementation Reference)
- Outbound bytes
- Prompt length (chars)
- Number of tool turns in this dispatch
- For Tier 2: number of PII redactions applied
The Audit Log tab in Settings provides aggregate views; the USD cost estimate is a sticker price (not the customer’s negotiated rate, which we don’t know) and should be treated as an order-of-magnitude indicator. See Audit Log.
Daily Spend Cap¶
To prevent runaway vendor spend, the orchestrator enforces a per-app-instance daily USD spend cap (configurable in Settings, default $X / day; admin sets per organization risk tolerance). When a vendor call would push cumulative cost over the cap, the orchestrator:
- Refuses the dispatch.
- Records a
daily_spend_cap_hitaudit event. - Surfaces a system_notice: “Daily spend cap reached ($X.XX of $Y.YY budgeted). Resets at 00:00 UTC. Contact your admin to raise the cap.”
The cap is cumulative-cost-based, not request-count-based — a single high-token-count free-form turn counts against the budget the same way many cheap turns do. Maps to LLM10 — Unbounded Consumption.
Streaming + Abort¶
The vendor response is streamed token-by-token. The chat-side rendering shows partial responses as they arrive, including partial tool_use blocks. The status indicator switches between three states:
- streaming — AI is generating text or about to emit a tool_use
- tool_executing — orchestrator is dispatching a tool the AI requested
- idle — turn complete
A red Stop button appears in the chat input toolbar during streaming / tool_executing states. Clicking it aborts the in-flight vendor call (closes the SSE stream) and any pending tool dispatches. The conversation history preserves what was emitted up to the abort point so the user can iterate from there.
Jailbreak Pattern Detection¶
Every user prompt is run through a jailbreak-pattern analyzer before dispatch. The analyzer is flag-and-proceed: a match fires a user_prompt_jailbreak_flag audit event but does NOT block the prompt. The defense-in-depth chain (type-system enforcement + Tier 2 sanitizer + tool-result sentinel + primer + vendor-side defenses) already covers the threat; the analyzer adds SOC observability for the user-prompt vector. Each flag captures a hash of the prompt (so SOC can correlate without archiving plain text), which patterns matched, and a character-class fingerprint to surface unusual encodings.
For the analyzer’s pattern groups + audit event schema, see AI Assistant Implementation Reference. Maps to LLM01 — Prompt Injection.
Session Tool-Call Cap¶
In addition to the per-user rate limit, every chat session has a per-session tool-dispatch cap to prevent infinite tool loops (a misbehaving model emitting tool_use after tool_use without ever producing a final assistant_text). Counter resets on chat clear. When exceeded, dispatch is refused with a synthetic error tool_result and a session_tool_cap_hit audit event records the hit. Maps to LLM06 — Excessive Agency.
Power Mode¶
Current release: Power Mode is hidden — LLM dispatch is disabled
Power Mode requires the LLM-driven path, which is disabled at compile time in the current release pending internal review. The ✦ Power toggle is hidden in current builds regardless of the power_user_roles configuration. This page is preserved as the design reference for the future release that re-enables the LLM path.
Power Mode is a role-gated ✦ Power toggle in the AI Assistant chat-input toolbar that forces a saved-search dispatch before LLM synthesis on every prompt. When Power Mode is on, the AI MUST call splunk_run_saved_search (or splunk_run_query) at least once before generating any narrative response — forced-RAG. Reasoning from prior knowledge alone is disallowed; every reply is data-grounded.
Why Power Mode Exists¶
The default free-form path lets the AI choose whether to dispatch a tool or reply from prior knowledge. For most questions the AI dispatches appropriately — but for questions that look like the AI knows them already from training data (“What’s a HANA audit log?”), it may answer from prior knowledge and skip the tool call. That’s fine for explanatory questions, but it’s the wrong behavior for investigations: a “what’s the failure rate this week?” question deserves a real Splunk dispatch, not a probability-weighted guess.
Power Mode resolves this by adding a forced-RAG rule to the system primer: for every user message, the AI MUST call splunk_run_saved_search at least once (or splunk_run_query if no saved search fits) BEFORE generating any narrative answer.
This is forced-RAG over chosen-RAG: same tools, same MCP path, same privacy tier — Power Mode just enforces the saved-search-first step. For the primer-augmentation mechanism, see AI Assistant Implementation Reference.
Role-Gated Visibility¶
Power Mode is opt-in per organization and per-role. The toggle is hidden from users entirely unless their Splunk role is in the configured allow-list. Default: empty list — Power Mode hidden from every user.
Configuration path (admin-only):
- Open Settings → AI Assistant → General.
- Find the Power Users subsection. The Multiselect is populated from Splunk’s
services/authorization/rolesREST endpoint. - Pick the roles that should see the Power toggle (typical:
admin,power,sc_admin). - Click Save Defaults.
- Affected users see the
✦ Powerbutton in their chat input toolbar on next page load.
Per-user gating would require a custom directory and doesn’t compose with Splunk’s standard RBAC. Role gating reuses the same primitive admins already manage for everything else (search permissions, app permissions, etc.).
Toggle UX¶
The ✦ Power button is a small pill in the chat input toolbar between Send and the keyboard-shortcut hint. State is persisted per-tab in sessionStorage under logserv.aiAssistant.powerMode — opening a new browser tab resets to OFF.
Visual states:
| State | Button text | Border | Tooltip |
|---|---|---|---|
| OFF (default) | ✦ Power |
panel-border-weak | “Power Mode OFF — click to enable forced saved-search-first behavior.” |
| ON | ✦ Power ON |
cyan-accent fill | “Power Mode ON — every prompt forces a saved-search dispatch before AI synthesis. Click to turn off.” |
A11y: aria-pressed="true" when on, aria-pressed="false" when off.
What Power Mode Does NOT Change¶
- Privacy tier behavior is unchanged. Tier 1 still gives the AI count + timing only; Tier 2 still gives aggregated metadata only. Power Mode just enforces saved-search-first; tier still controls what AI sees about each search result.
- Tool dispatch is unchanged. Same MCP path, same tool definitions (
splunk_run_saved_search,splunk_run_query), same SPL static-analysis guard, same session tool-call cap. - Audit categories are unchanged. Power Mode runs through the same
vendor_tier1/vendor_tier2audit events; the new fieldpowerMode?: booleanrecords whether the toggle was on at dispatch time, for SOC pivot analysis. - Per-user rate limit, daily spend cap, jailbreak detection. All unchanged.
When to Use Power Mode¶
| Use case | Power Mode? |
|---|---|
| Investigations that should be data-grounded (“what’s failing right now?”) | ON |
| Cross-cutting top-N questions (“find the top 10 issues to attend to”) | ON — Power Mode + the TIME-WINDOW REASONING rules together produce verify-confirmed severity claims |
| Compliance reports that the auditor will cross-check against the rendered tiles | ON (so every claim has a citation) |
| Conceptual questions (“what’s a HANA audit log?”, “explain risk_level”) | OFF (the AI’s training knowledge is fine) |
| One-shot follow-ups in an existing conversation where prior tool results already cover the answer | OFF (forces an unnecessary dispatch) |
Streaming-only chat-only mode (mcp_required=false) |
Power Mode auto-hides — there’s no tool path to force |
Audit Trail¶
Every free-form vendor call records a vendor_tier1 or vendor_tier2 audit event with a powerMode flag that captures whether the toggle was on for that turn. Use cases for the audit field:
- SOC pivot: filter audit events to
powerMode=trueto see only the strict-data-grounded turns. - Compliance review: confirm that audit-period investigations were run with Power Mode on (so every cited finding has a tool dispatch behind it).
- Cost analysis: Power Mode-on turns dispatch more tools per turn → higher per-turn cost. The audit lets finance attribute spend to the gating choice.
Power Mode does NOT generate a separate audit category — it’s a flag on the existing vendor_tier1 / vendor_tier2 events. See Audit Log.
Drill-down Chips¶
Drill-down chips are clickable affordances that appear next to AI Assistant tool-result tiles (right pane) and inline citations in the chat narrative (left pane). They connect the AI Assistant’s investigation flow back into the dashboards or Splunk’s universal Search app, with the dispatch’s exact time range pre-applied.
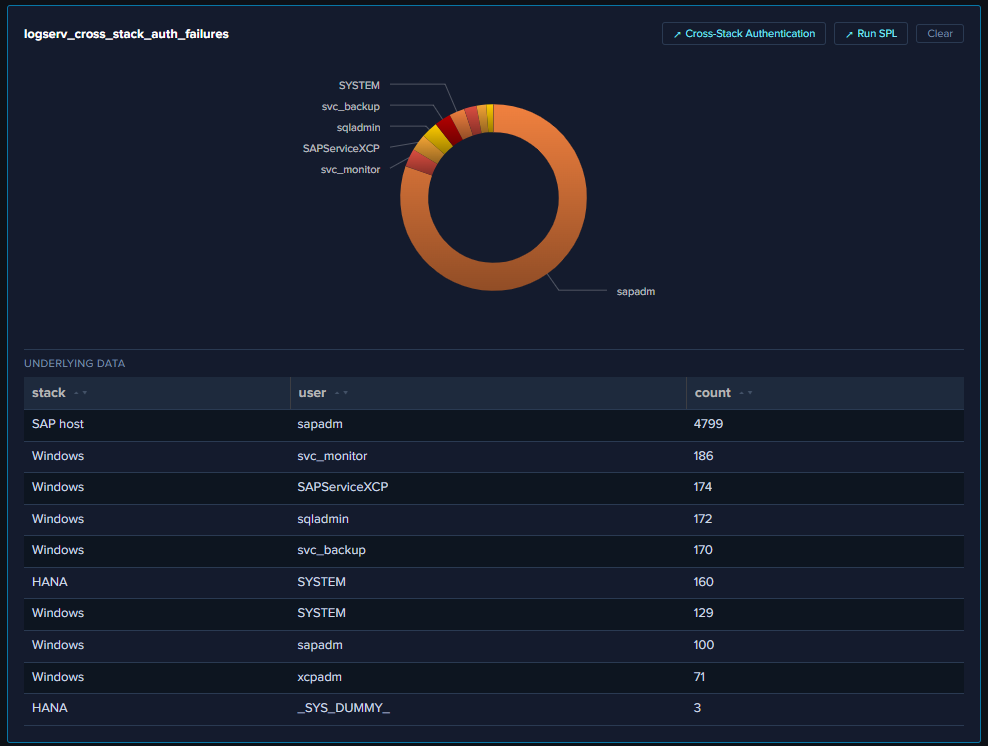
The Two Chip Types¶
↗ Dashboard¶
Opens the related OOTB dashboard in a new browser tab. Sourced from the per-prompt dashboard mapping in the intent map — single string or array. Multi-target prompts (20 of 61 — e.g., logserv_hana_failed_auth → HANA Audit + Cross-Stack Authentication) render multiple chips, one per target.
The URL embeds the dispatch’s exact earliest/latest as query params, and the destination dashboard hydrates its time picker from those params on mount.
↗ Run SPL¶
Opens Splunk’s universal Search app in a new browser tab with the dispatched SPL pre-populated and the dispatch’s exact earliest/latest pre-applied. The chip is hidden on synthetic blocked-SPL results so it doesn’t help the user manually run a query that the SPL static-analysis guard just rejected.
For canned-prompt dispatches, the SPL is the prompt’s catalog SPL string. For AI-driven saved-search calls, the SPL is resolved from the same catalog lookup. For AI-driven ad-hoc queries, the SPL is the AI’s own query string.
Where Chips Render¶
On every tool-result tile in the right pane¶
Chips appear in the tile’s actions slot (in the FramedPanel header), between the tile title and the Clear button. Order: dashboard chip(s) first, then ↗ Run SPL, then Clear.
Alongside [→ saved_search] citations in the chat narrative¶
The AI’s narrative response cites tool dispatches as [→ logserv_xxx]. Each citation in chat becomes a clickable scroll-to-tile span (clicking it scrolls the right pane to the matching tile), with sibling chips auto-appended on the same line: ↗ Dashboard (one per resolvable target) + ↗ Run SPL.
A typical citation in chat reads:
A. [severity:high] Cross-stack auth failures concentrated on Windows. [→ logserv_cross_stack_auth_failures] ↗ Cross-Stack Authentication ↗ Run SPL 7 of the top-10 failing-stack rows are Windows…
Where:
- [→ logserv_cross_stack_auth_failures] is the clickable scroll-to-tile span (cyan-light + dotted underline)
- ↗ Cross-Stack Authentication is the dashboard chip (opens that dashboard in a new tab at the dispatch’s time range)
- ↗ Run SPL is the SPL chip (opens Splunk Search with the dispatched SPL + same time range)
Time-Range Preservation¶
Both chip types preserve the dispatch’s exact time range — not the user’s current global TimeRange picker, not the dashboard’s default. So a -24h verify-query opens its destination at -24h; a -30d cumulative search opens at -30d; the dispatch’s window IS the right answer for the destination.
This matters because the user’s TimeRange picker may have changed between when the AI dispatched the search and when the user clicks the drill-down. By embedding the dispatch’s window in the URL, the destination reflects exactly what the AI saw.
Security Posture¶
target="_blank"+rel="noopener noreferrer"on every chip. Thenoopenerflag breaks thewindow.openerreference that reverse-tabnabbing relies on.- Row values spliced into SPL get quote-escaped before URL encoding so a row value containing a quote or backslash can’t break out of the SPL string context.
- No SPL chip on synthetic blocked-SPL results. When the SPL static-analysis guard blocks an AI-authored query, the synthetic error tile is rendered without the
↗ Run SPLchip — the chip would defeat the guard by helping the user manually dispatch the same SPL. - No drill-downs from compliance audit-trail tables. The After-Hours Privileged Changes + Recent Privileged Changes tables on the Change & Configuration Activity dashboard intentionally have NO row drill-downs (clicking through to raw events would pollute the audit trail with the reviewer’s own search activity in subsequent compliance reports).
For the orchestrator-layer URL pre-resolution pattern that powers these chips, see AI Assistant Implementation Reference.
Splunk MCP Setup¶
The AI Assistant’s tool-dispatch path runs on top of the Splunk MCP Server (Splunkbase App 7931). MCP — Model Context Protocol — is Anthropic’s open standard for connecting LLMs to external tools and data; the Splunk MCP Server exposes Splunk’s search-job + saved-search endpoints as MCP tools that any MCP-aware client can call. The LogServ App is the MCP client; the Splunk MCP Server is the MCP server; the LLM vendor (Anthropic / OpenAI / Azure / Bedrock) is the LLM.
Prerequisites¶
- Splunk 9.4.3 or later.
- Splunk MCP Server (Splunkbase App 7931) v1.1.0 or later installed on the same search head as the LogServ App. (The LogServ App’s React UI calls MCP via the same Splunk Web session, so they need to share an HTTP host.)
- Admin user role to install the MCP Server app and configure its REST handlers.
Splunk MCP TA gate currently bypassed
The app’s hard-dependency check for a separate Splunk MCP TA is currently bypassed in code via a SKIP_MCP_TA_CHECK flag. As a result the only hard prerequisite the app enforces at runtime is the Splunk MCP Server (App 7931) itself.
Recommended companion: Splunk AI Assistant¶
Splunk AI Assistant (Splunkbase App 200) is the typical co-install for the Splunk MCP Server. It’s not a strict prerequisite for the LogServ App’s AI Assistant — the LogServ App uses only the core splunk_run_saved_search and splunk_run_query MCP tools, which work standalone. However:
- App 200 unlocks additional
saia_*-prefixed MCP tools (e.g., SPL optimization helpers) that future LogServ releases may use. - Installing it alongside the MCP Server follows Splunk’s documented setup pattern.
- If you’re already deploying the Splunk MCP Server, the marginal effort to add App 200 is small and avoids friction later.
Install the Splunk MCP Server¶
Per Splunkbase App 7931’s installation guide:
- Download the MCP Server tarball from Splunkbase.
- On the search head where the LogServ App lives, install via Splunk Web (Apps → Install app from file) or via CLI:
/opt/splunk/bin/splunk install app /path/to/splunk-mcp-server.tar.gz - Restart Splunkd:
sudo systemctl restart Splunkd - Verify the app is installed and the REST handler endpoint responds:
curl -sk -u admin:<password> https://localhost:8089/services/mcp/health
If the health endpoint responds OK, the LogServ App’s AI Assistant should detect MCP automatically on next page load.
Authentication¶
Cookie auth (default, recommended)¶
App 7931 v1.1.0 accepts cookie auth from the same Splunk Web session that’s serving the React app. When the LogServ App calls the MCP server endpoint at /en-US/splunkd/__raw/services/mcp (the default), the browser includes the Splunk session cookie automatically; no bearer token needed.
This is the default and preferred configuration. No setup required beyond installing the MCP Server app — works on both HTTPS and HTTP Splunk; the browser handles the session cookie either way. (HTTPS is in fact preferred — Splunk’s session cookies set the Secure and SameSite=Lax flags, which behave fully correctly only over HTTPS.)
Bearer token (optional, OAuth-strict environments)¶
For customers with OAuth-strict MCP server configurations (where cookie auth is disabled at the server side), the LogServ App supports an optional bearer token. Admin pastes the token in Settings → Splunk MCP under realm logserv_ai_assistant_mcp name bearer_token. The LogServ App layers it on top of the cookie auth via Authorization: Bearer <token> header. On 401 the client invalidates the cached token and retries once.
Splunk Cloud — JWT aud (audience) claim must be mcp¶
On Splunk Cloud (Victoria 10.x and later), the platform’s edge proxy mints a JWT from the user’s session and forwards it to splunkd as a Bearer token automatically — independent of whether you paste a bearer token in our Settings page. The Splunk MCP Server validates the JWT’s aud (audience) claim, and the only value it accepts is mcp.
If the JWT your Splunk Cloud stack stamps has any other audience (a common default is Demo on freshly-provisioned non-production stacks), every MCP request returns:
{
    "jsonrpc": "2.0",
    "id": 1,
    "error": {
        "code": -32600,
        "message": "Invalid token audience: <whatever-the-jwt-has>"
    }
}
…and the AI Assistant renders the SETUP REQUIRED banner because the health probe’s initialize call gets that 403.
Fix: generate (or have your Splunk Cloud admin / Splunk Support generate) an MCP token with aud = mcp. The exact path depends on how your Splunk Cloud stack mints tokens:
- If your stack uses Splunk’s
/services/authorization/tokensendpoint, setaudience=mcpwhen minting. - If JWTs are stamped by the Cloud edge proxy (Victoria default), open a Splunk Cloud Support ticket asking them to set the stack’s MCP audience to
mcp. - If your stack is fronted by an external SSO (Okta, Azure AD, etc.), configure the SSO’s token-issuer to set
aud: "mcp"on tokens destined for the MCP route.
Confirm by decoding the actual JWT being sent in your browser’s Network tab (paste the Bearer token value into jwt.io) and checking the aud claim. If it’s mcp, the audience is correct and your error is something else. If it’s anything else, that’s the misalignment.
This aud=mcp requirement is an App 7931 server-side configuration; the LogServ App itself is audience-agnostic — it just forwards whatever bearer token (if any) Splunk Cloud injects.
Configuration in the LogServ App¶
Open Settings → AI Assistant → General and confirm:
mcp_required=true(default). When false, MCP is bypassed and the chat operates in MCP-less chat mode (Claude streaming works, no tool dispatch). Useful for debugging the LLM-side flow without MCP. Most customers leave this true.mcp_server_url= blank (default — uses the scheme-relative/en-US/splunkd/__raw/services/mcp). Override only if your MCP server is at a non-default path or you’re proxying through a different ingress.
Then in Settings → Splunk MCP:
bearer_token= blank if using cookie auth (default), or paste the token if your MCP server requires bearer auth.
Save the General tab. The Settings save records a config-changed audit event; the next page load picks up the new MCP URL / token.
Health-Check + Setup Wizard¶
When the AI Assistant panel opens, it runs a health check against the configured MCP endpoint. Three possible outcomes:
| Health status | What renders |
|---|---|
ok |
Empty chat panel; ready for prompts. |
error |
MCPSetupWizard renders with diagnostic guidance (URL, last error, suggested fix). |
loading |
Spinner; transient. |
The setup wizard surfaces:
- The configured MCP URL.
- The last error (typically HTTP 404 if the endpoint path is wrong, 401 if auth is failing, network timeout if MCP isn’t reachable).
- A Retry button that re-runs the health check.
- A link back to Settings → Splunk MCP to fix credentials.
Common Issues¶
“Stuck at health-check loading”¶
The health-check endpoint is hanging. Most common cause: the configured mcp_server_url points at a path the MCP Server app doesn’t expose. Check via curl from the search head:
curl -sk -u admin:<pw> https://localhost:8089/services/mcp/health
If that 404s, the MCP Server app isn’t installed correctly or the REST handler is misconfigured.
“Invalid token audience” (Splunk Cloud)¶
The browser’s Network tab shows the POST /en-US/splunkd/__raw/services/mcp request returning HTTP 403 with body:
{ "jsonrpc": "2.0", "id": 1, "error": { "code": -32600, "message": "Invalid token audience: <value>" } }
The JWT that Splunk Cloud’s edge proxy stamps onto the request has an aud claim that App 7931 isn’t configured to accept. App 7931 requires aud = mcp. See Splunk Cloud — JWT aud (audience) claim must be mcp above for the full fix. The short version: re-mint the MCP token (or have Splunk Cloud Support do it) with audience=mcp.
“401 Unauthorized on every dispatch”¶
Cookie auth isn’t working — possible causes:
- The Splunk Web session expired in the browser. Re-login; re-open the AI Assistant panel.
- The MCP Server is configured with bearer-only auth. Configure a bearer token in Settings → Splunk MCP.
- A reverse proxy in front of Splunk is stripping the session cookie. Check the proxy’s cookie-forwarding config.
“MCP Server returns valid responses but tool tiles are empty”¶
The MCP Server’s response format doesn’t match what the LogServ App expects. Most common cause: MCP Server version mismatch (need v1.1.0 or later). Check via the Splunk Apps page; upgrade if needed.
MCP-less Chat Mode¶
For debugging or for specific use cases where you want LLM streaming without MCP, set mcp_required = false in Settings → General. The AI Assistant then operates in chat-only mode:
- The LLM vendor receives system primer + user message + history (no tool definitions).
- The AI cannot dispatch any Splunk searches — no
splunk_run_saved_search, nosplunk_run_query. - Replies are conversational only — useful for “explain how X works” type questions, but not for any data-grounded investigation.
- A persistent orange-warning banner at the top of the chat reads: “Chat-only mode — tool execution disabled (MCP not configured). The AI can answer questions but cannot run searches against your Splunk data.”
This mode is distinct from the Templates-only build variant: chat-only mode has the LLM-driven path on, MCP off; templates-only has the LLM-driven path off, MCP on.
Settings & Configuration¶
Current release: the Provider Credentials tab is hidden — LLM dispatch is disabled
The current release ships with the LLM-driven path disabled at compile time pending internal review. The Provider Credentials tab is hidden entirely in current builds, and the model picker on the General tab is non-functional even though the underlying setting persists. The General tab’s provider, default_model, tier, power_user_roles, tier2_pii_redaction, tier2_redact_hostname, rate_limit_per_hour, daily_spend_cap_usd, and session_tool_call_cap fields are documented for the future release that re-enables the LLM path; in the current release, only enabled, mcp_required, mcp_server_url, and the audit-forwarder fields under Audit & Telemetry are operationally meaningful.
The Application Settings page is at #/settings within the LogServ App (the old #/settings/ai-assistant URL still works and redirects here). Admin-only. The page is organized as a two-level tab hierarchy:
Application Settings
├── AI Assistant            (top-level tab)
│   ├── General             (sub-tab)
│   ├── Provider Credentials(sub-tab)
│   ├── Splunk MCP          (sub-tab)
│   └── Audit Log           (sub-tab)
└── Dashboard Data          (top-level tab)
The two top-level tabs render with the standard tab chrome; the AI Assistant sub-tabs render as a lighter, secondary text-tab row beneath them.
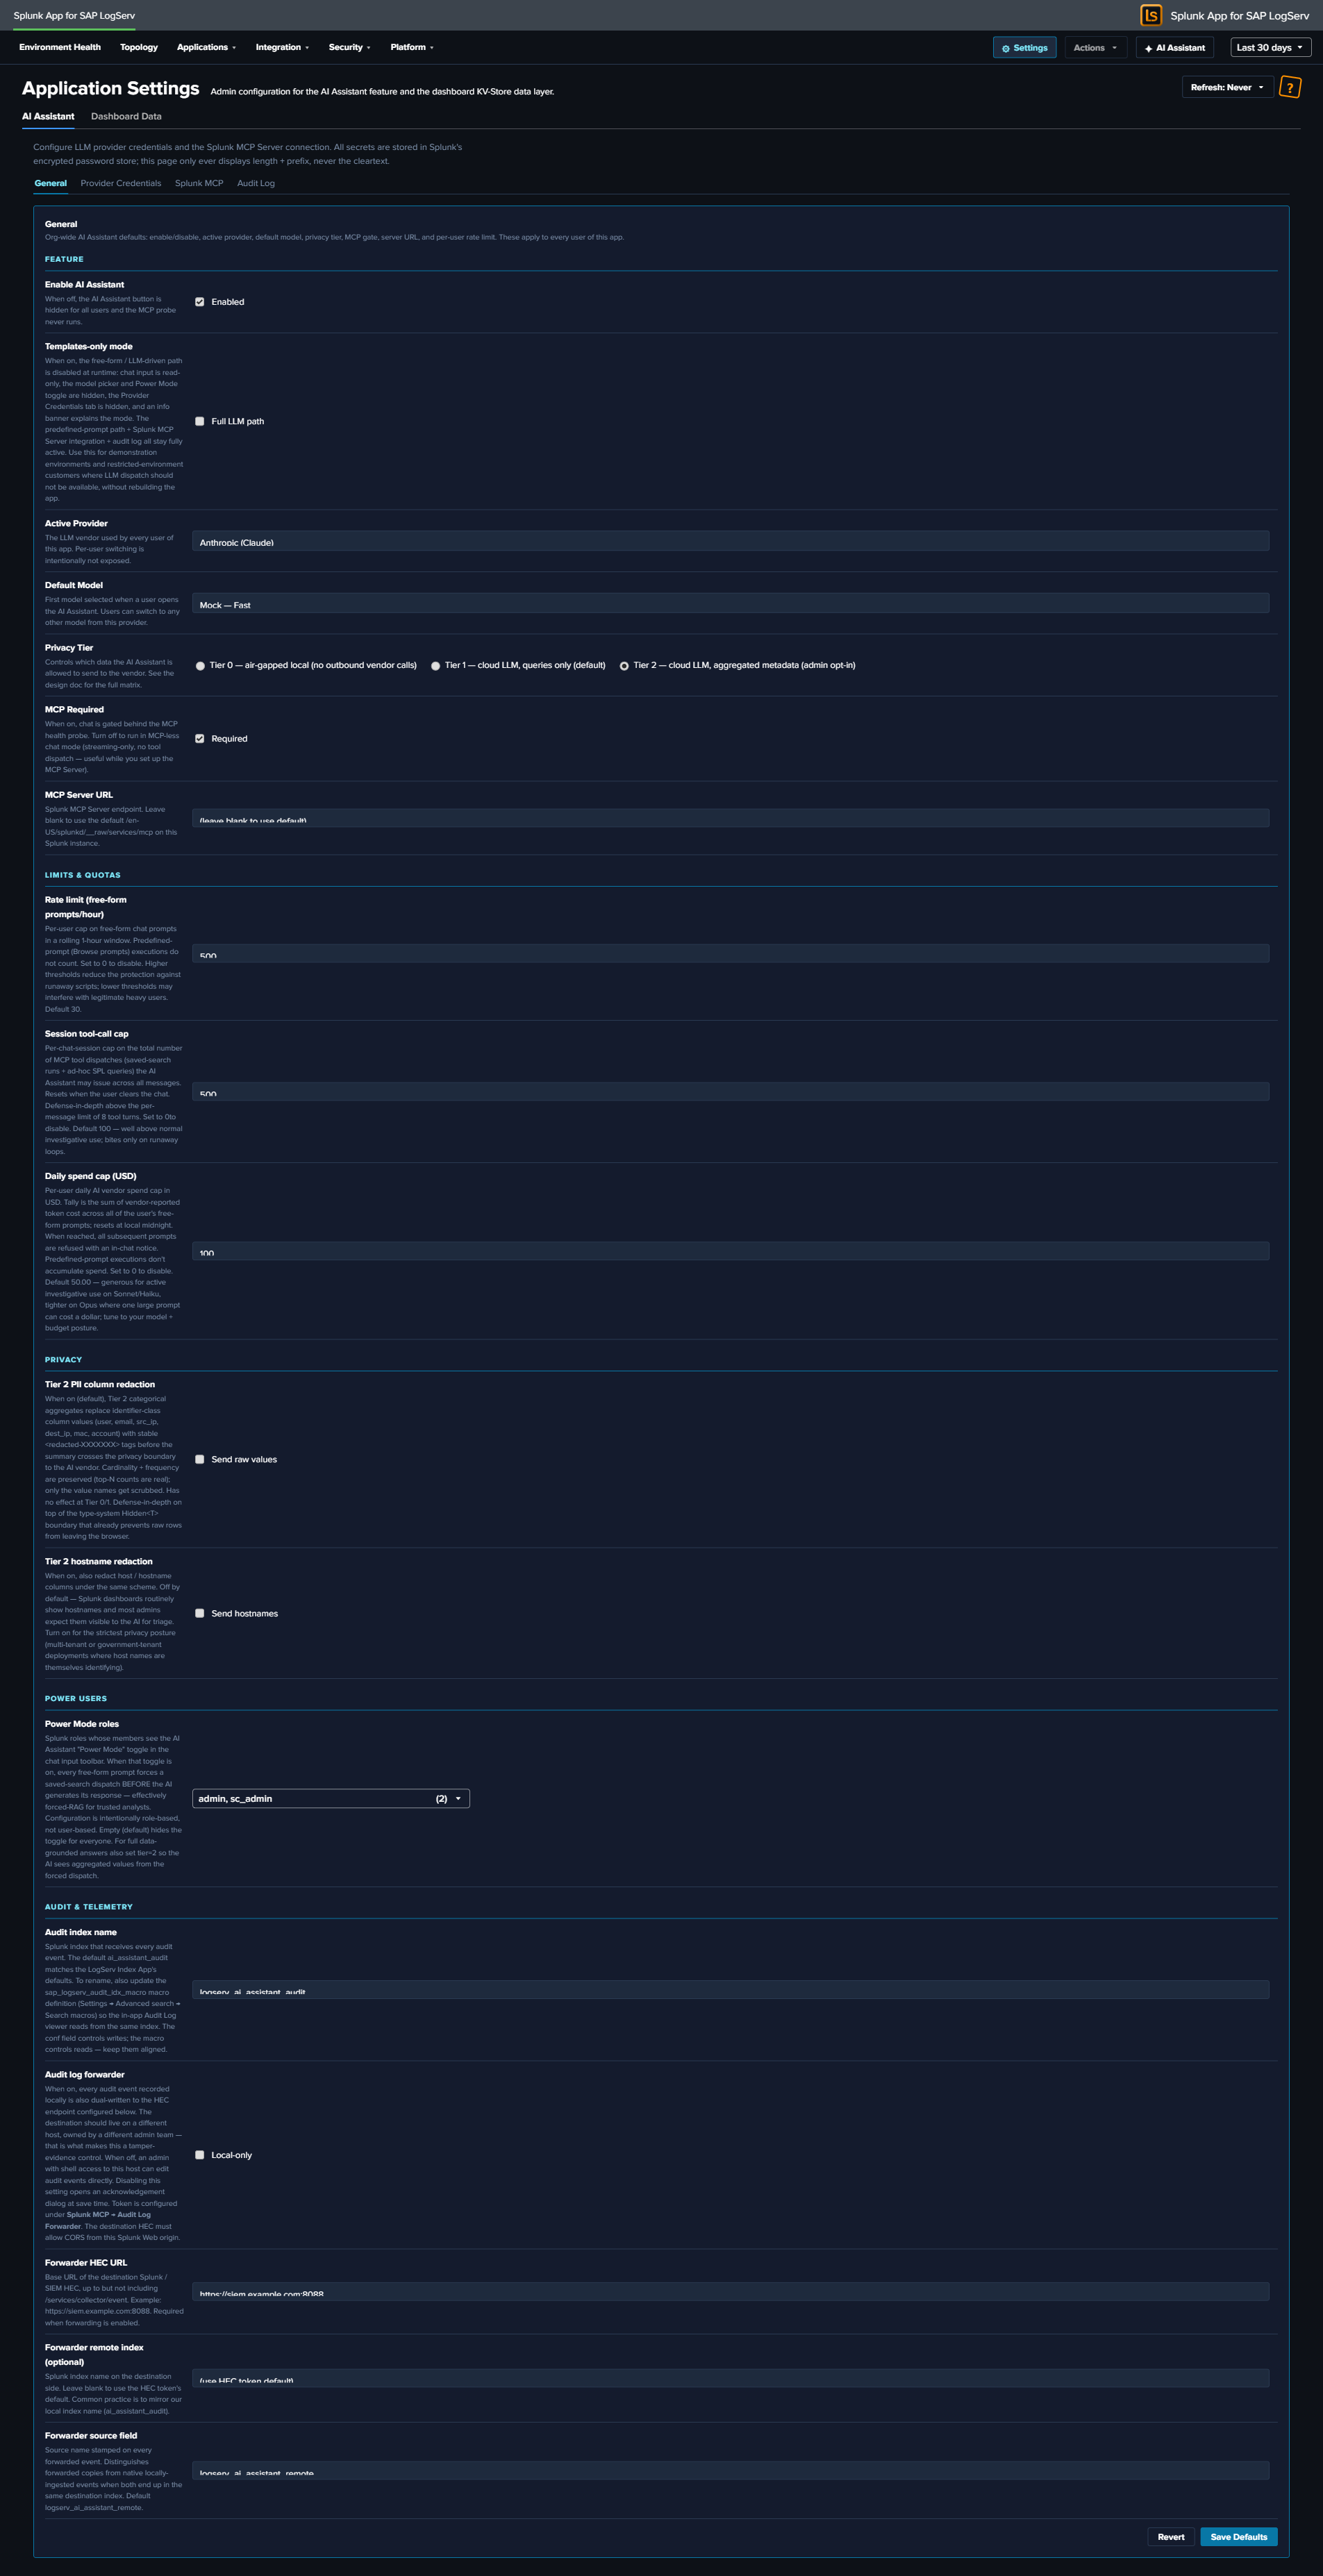
The Two Top-Level Tabs¶
| Tab | Scope |
|---|---|
| AI Assistant | Everything specific to the AI Assistant feature, split across four sub-tabs (below). |
| Dashboard Data | App-wide admin controls for the KV-Store rollup data layer that powers every dashboard and the Environment Topology view — aggregation master switch, retention, one-time backfill, per-rollup status, and clear (see below). |
AI Assistant sub-tabs¶
| Sub-tab | Scope |
|---|---|
| General | Org-wide AI Assistant defaults (enable/disable, provider, model, tier, MCP gate, server URL, rate limit, spend cap, Power Users, audit forwarder) |
| Provider Credentials | LLM provider API keys (Anthropic / OpenAI / Azure OpenAI / AWS Bedrock) |
| Splunk MCP | MCP Server bearer token + Audit Forwarder HEC token |
| Audit Log | Read-only browser of every audit event in the logserv_ai_assistant_audit index |
In the Templates-only build variant, the Provider Credentials sub-tab is hidden entirely (no LLM provider needed) and an info banner at the top of the AI Assistant tab explains the build mode.
General Tab¶
The General tab is divided into four semantic subsections: Feature, Limits & Quotas, Privacy, Audit & Telemetry.
Feature¶
| Field | Default | Description |
|---|---|---|
enabled |
false |
Master switch. When false, the ✦ AI Assistant button in the nav is hidden and no AI traffic flows. The first time an admin flips this to true, an enable-acceptance modal blocks the save until acknowledged. |
provider |
mock |
Active LLM vendor: mock / anthropic / openai / azure_openai / bedrock / ollama (future release). |
default_model |
per-provider | Default model id for the active provider. Per-user model picker in the chat panel can switch within the same provider’s models[]. |
tier |
1 |
Privacy tier 0 / 1 / 2. See Privacy Tiers. Elevating to Tier 2 records a vendor_tier2_elevation audit event. |
mcp_required |
true |
When false, runs MCP-less chat mode (streaming-only, no tool dispatch). |
mcp_server_url |
blank | MCP server endpoint. Blank uses the scheme-relative /en-US/splunkd/__raw/services/mcp. See Splunk MCP Setup. |
power_user_roles |
empty CSV | Comma-separated Splunk roles allowed to see the ✦ Power toggle. See Power Mode. |
Limits & Quotas¶
| Field | Default | Description |
|---|---|---|
rate_limit_per_hour |
30 |
Per-user rolling-1-hour rate limit on free-form prompts. 0 = disabled. Maps to LLM10. Canned prompts are never rate-limited. |
session_tool_call_cap |
100 |
Per-chat-session cap on tool dispatches to prevent infinite tool loops. 0 = disabled. Maps to LLM06. |
daily_spend_cap_usd |
per-org | Cumulative-cost cap on free-form vendor spend per app instance per UTC day. Resets at 00:00 UTC. Maps to LLM10. |
Privacy¶
| Field | Default | Description |
|---|---|---|
tier2_pii_redaction |
true |
When Tier 2 is active, redact known identifier columns (email, user(name), *_ip, mac, account) before sending to the LLM. Stable per-value <redacted-XXXXXXX> tags so cardinality reasoning still works. |
tier2_redact_hostname |
false |
Whether to redact hostname columns under the Tier 2 PII rule. Default off — hostname is often non-sensitive in SAP environments. |
Audit & Telemetry¶
| Field | Default | Description |
|---|---|---|
audit_forwarder_enabled |
false |
Forward audit events to a separate Splunk / SIEM via HEC for tamper-evidence. When the admin saves with this off, a forwarder-disabled-acceptance modal blocks the save until acknowledged. |
audit_forwarder_url |
blank | HEC endpoint URL (e.g., https://siem.example.com:8088/services/collector). |
audit_forwarder_index |
blank | Optional index field to send with each event. |
audit_forwarder_source |
logserv:ai_assistant:audit |
source field for forwarded events. |
Provider Credentials Tab¶
One panel per provider. Each panel has the credential fields for that provider — typically just an API key, plus per-provider extras (Azure deployment URL, Bedrock region, etc.). Credentials are stored in Splunk’s encrypted password store via /servicesNS/nobody/<app>/storage/passwords. The Settings page only ever displays length + prefix, never the cleartext.
The realm convention is logserv_ai_assistant_<provider> and the credential name corresponds to the field. So Anthropic’s API key lives at realm logserv_ai_assistant_anthropic name api_key; OpenAI’s at logserv_ai_assistant_openai name api_key; etc.
Setting a credential (admin-only):
- Pick the provider’s panel on this tab.
- Click Set next to the field.
- Paste the credential.
- Click Save.
- The Settings page records a
local_onlyaudit event with the realm + name + length + prefix (never the cleartext).
Deleting a credential:
- Click Delete next to the field.
- Confirm.
- The credential is removed from Splunk’s encrypted password store.
If the active provider field on the General tab points at a provider whose credentials aren’t set, the AI Assistant produces an error on the first free-form prompt: “Provider ‘X’ has no credentials configured. Open Settings → Provider Credentials to set them.”
In the Templates-only build variant, this entire tab is hidden.
Splunk MCP Tab¶
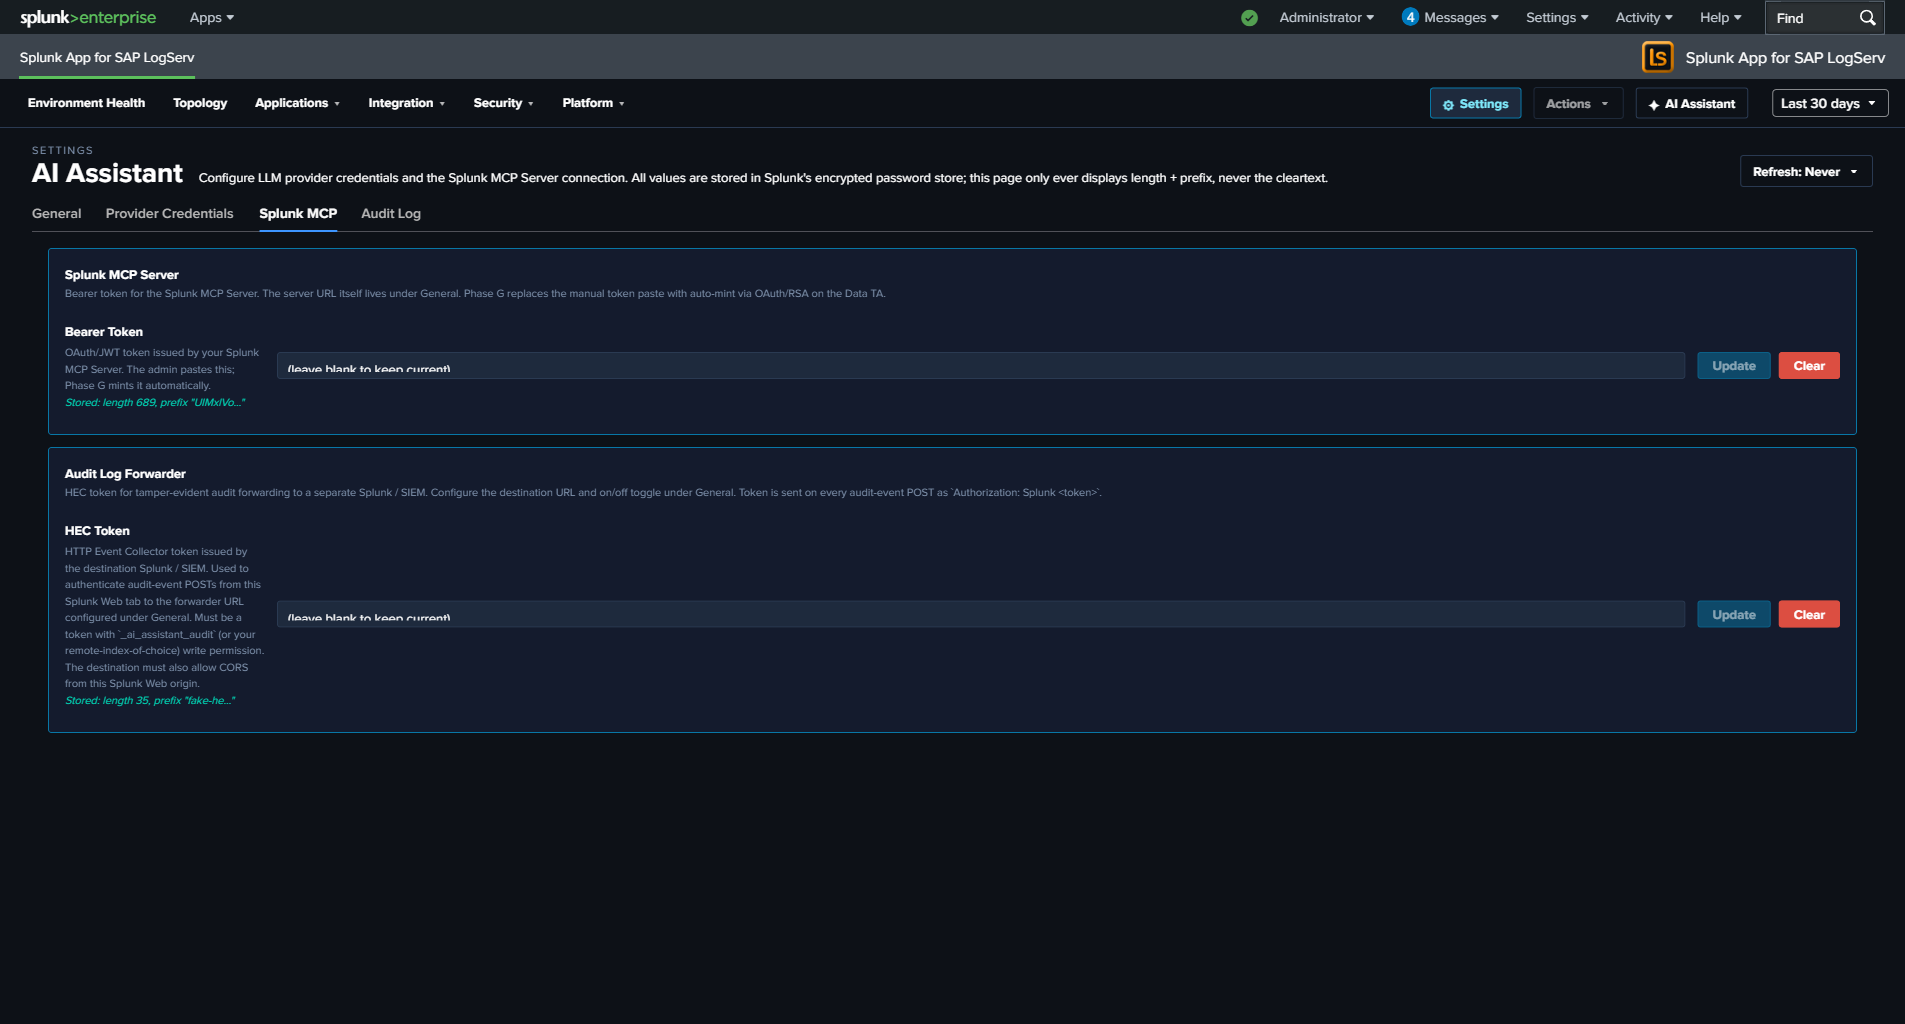
Two panels:
Splunk MCP Server¶
| Field | Realm | Name |
|---|---|---|
bearer_token |
logserv_ai_assistant_mcp |
bearer_token |
OAuth/JWT token issued by your Splunk MCP Server. The admin pastes this. Optional — cookie auth from the same Splunk Web session works by default for HTTP-only Splunk.
Audit Log Forwarder¶
| Field | Realm | Name |
|---|---|---|
hec_token |
logserv_ai_assistant_forwarder |
hec_token |
HEC token for tamper-evident audit forwarding to a separate Splunk / SIEM. The destination URL + on/off toggle live under General → Audit & Telemetry. The token is sent on every audit-event POST as Authorization: Splunk <token>. See Audit Log → HEC Forwarder.
Audit Log Tab¶
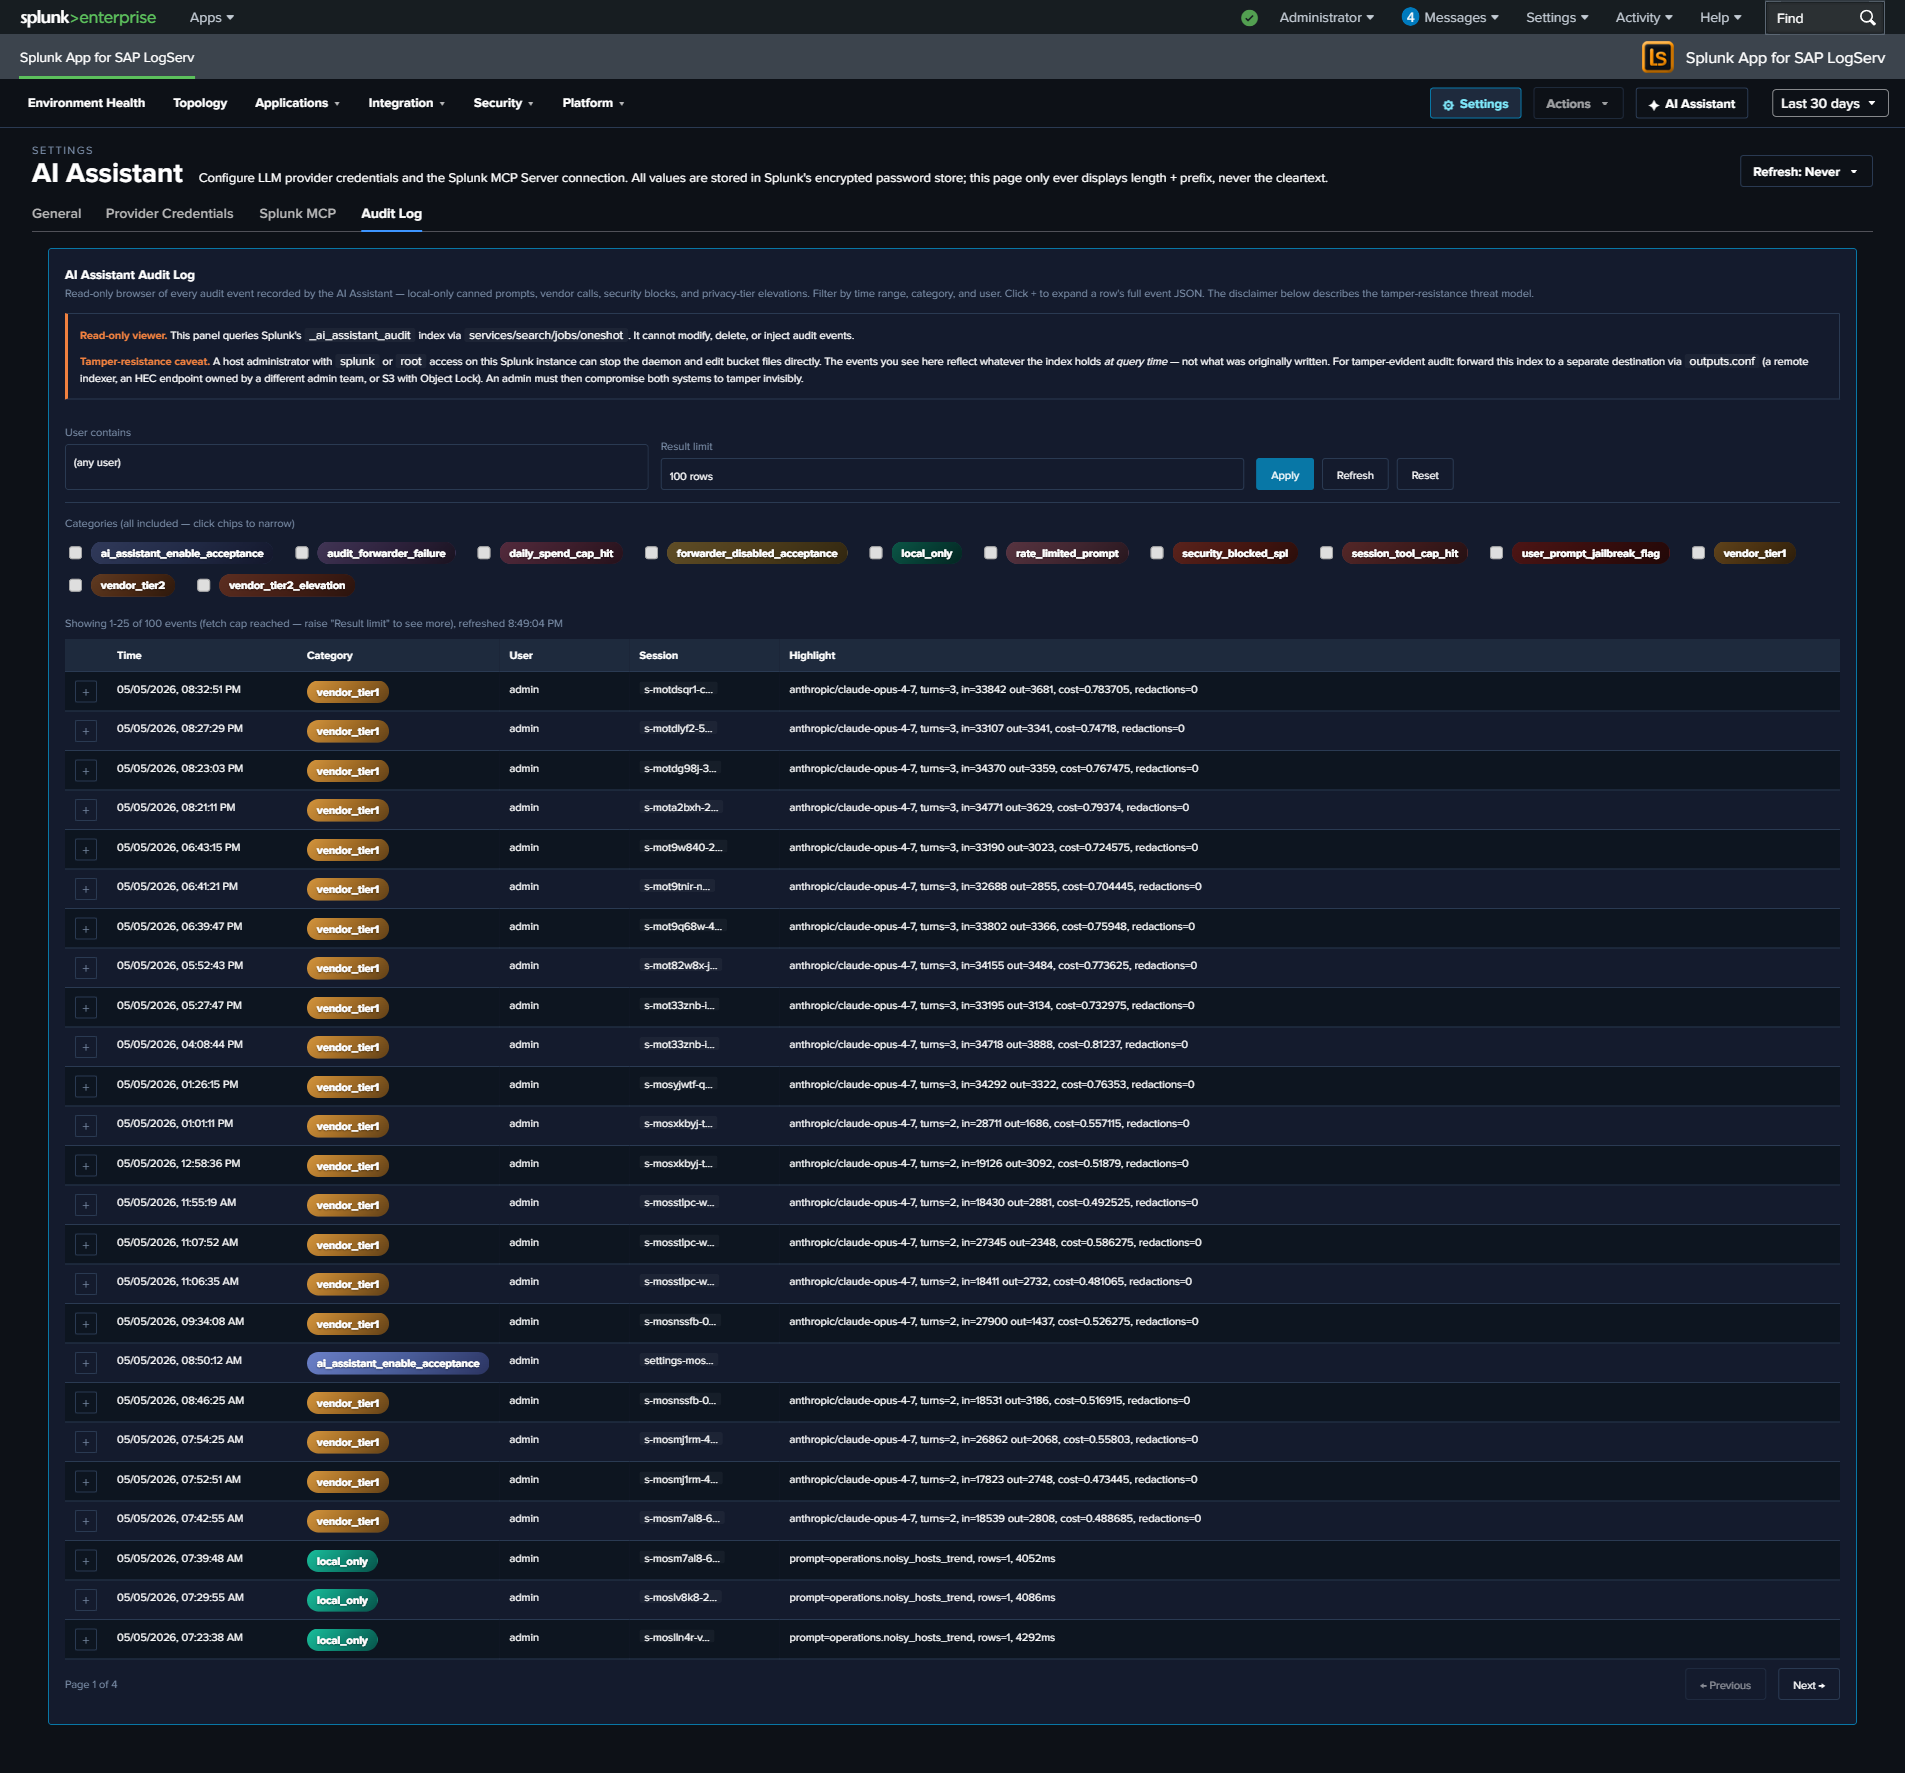
Read-only browser of every event in the logserv_ai_assistant_audit index. The search window is driven by the global TimeRange picker in the navigation bar — the viewer re-runs on every picker change, and there is no separate time-range control. Filters: category multi-select (12 categories — local_only, vendor_tier1, vendor_tier2, security_blocked_spl, rate_limited_prompt, user_prompt_jailbreak_flag, session_tool_cap_hit, daily_spend_cap_hit, audit_forwarder_failure, vendor_tier2_elevation, forwarder_disabled_acceptance, ai_assistant_enable_acceptance), user-contains text filter, result limit (25 / 100 / 500 / 1000).
Clicking a row’s + expand button reveals the full event JSON. The page is paginated client-side at 25 rows per page; “Showing N-M of T events” + Previous / Next buttons render below the table when T > 25.
Tamper-resistance disclaimer at the top of the panel:
Audit events live in a Splunk index. A host-root admin can edit the bucket files. Mitigation: forward audit events to a separate Splunk instance / SIEM / S3-with-Object-Lock owned by a different admin team. Configure the HEC forwarder under Settings → General → Audit & Telemetry.
See Audit Log for the threat model + forwarder configuration.
Dashboard Data Tab¶
The Dashboard Data top-level tab is the admin control surface for the entire KV-Store rollup data layer that powers every dashboard and the Environment Topology view — a global hourly-aggregation master switch, a 365-day retention display, the one-time backfill, a per-rollup status + action table, and a global clear.
Because it manages the dashboard data layer (not the AI Assistant feature), its controls are documented alongside that architecture: see Dashboard Performance & Data Freshness → The Dashboard Data settings tab.
Legal Acknowledgement Modals¶
Two compile-time legal modals gate specific Settings save flows. Both follow Splunk’s splunk_instrumentation optInVersion framework — once acknowledged at version V, future saves with the same disclaimer revision skip the modal; bumping the version forces re-ack.
Enable Acceptance Modal (orange-bordered)¶
Triggers when:
- saved.enabled === false && draft.enabled === true (every “I’m turning this on” deliberate action), OR
- The current optInVersion of the enable-TC stanza is higher than the user’s last acknowledgement.
The modal disclaimer covers seven clauses: data egress acknowledgement, customer responsibility, AS-IS warranty disclaimer, indemnification, limitation of liability, authority warrant, record-of-acknowledgement. Aligned to Splunk MSA + Cisco EULA conventions.
User identity, Splunk-stamped IP (host field), timestamp, and SHA-256 of the disclaimer revision are recorded in an ai_assistant_enable_acceptance audit event. Yes path: save proceeds + bumps the user’s optInVersionAcknowledged. No path: save aborts + records the No choice.
Forwarder Disabled Acceptance Modal (cyan-bordered)¶
Triggers when:
- saved.audit_forwarder_enabled === true && draft.audit_forwarder_enabled === false (every “I’m turning this protection off” deliberate action), OR
- The current optInVersion of the forwarder-TC stanza is higher than the user’s last acknowledgement.
The disclaimer covers integrity-mitigation responsibility: with the forwarder off, audit events are recoverable only from the local index, which a host-root admin can edit. Same identity + IP + timestamp + disclaimer-hash recording as the enable modal. Records forwarder_disabled_acceptance audit event.
Why the hybrid trigger logic¶
Pure optInVersion-only gating (acknowledge once, never prompted again until the version bumps) is what Splunk’s stock telemetry uses. We added the deliberate-toggle-transition trigger because re-enabling the AI Assistant after a disable, or re-disabling the forwarder after enabling, are deliberate user actions that warrant re-acknowledgement of the legal posture each time. Pure version-only gating would let these toggle-flips slip without re-ack.
Live UI Refresh on Save¶
When the admin saves a config change in the General tab that affects what users see (master enabled toggle, mcp_required, power_user_roles, etc.), the AI Assistant re-applies the new config to the running session within a few seconds. No page reload required.
For example: disabling the AI Assistant via the master toggle and clicking Save Defaults — the ✦ AI Assistant button in the top-right nav disappears within ~4 seconds, no browser refresh needed. Similarly, re-enabling re-shows the button immediately. For the callback wiring, see AI Assistant Implementation Reference.
Audit Log¶
Every action the AI Assistant takes — predefined-prompt dispatches, free-form vendor calls, security blocks, privacy-tier elevations, legal acknowledgements — produces an audit event in a dedicated logserv_ai_assistant_audit index. The audit trail is the evidence layer for compliance reviews, SOC investigations, and tamper-resistance posture.
The Twelve Audit Categories¶
| Category | When | Key fields |
|---|---|---|
local_only |
Predefined-prompt dispatch (no LLM call). | promptId, spl, rowCount, executionMs, ok |
vendor_tier1 |
Free-form prompt at Tier 1 (count + timing only summary sent to vendor). | provider, model, inputTokens, outputTokens, vendorCostEstimateUsd, outboundBytes, promptLength, turnCount, powerMode |
vendor_tier2 |
Free-form prompt at Tier 2 (aggregated metadata sent). | Same as vendor_tier1 plus tier2RedactionsApplied (count of PII redactions on this turn) |
vendor_tier2_elevation |
Admin saves Settings with tier changing from 1 → 2. |
Admin user, previousTier, newTier |
security_blocked_spl |
SPL static-analysis guard rejected an AI-authored splunk_run_query. |
spl (truncated to 1000 chars), operator (the offending command name) |
rate_limited_prompt |
Per-user rate limit denied a free-form prompt. | cap, attemptedCount, windowSeconds |
user_prompt_jailbreak_flag |
Jailbreak-pattern analyzer flagged a user prompt (flag-and-proceed; the prompt still ran). | promptHash, promptLength, matchedGroups, charClassFingerprint |
session_tool_cap_hit |
Per-session tool-dispatch cap reached; dispatch refused. | cap, attemptedCount, toolName |
daily_spend_cap_hit |
Daily USD spend cap reached; vendor call refused. | cap, currentSpend, attemptedSpend |
audit_forwarder_failure |
HEC forwarder POST failed (DNS, network, 4xx/5xx response). | destinationUrl (sanitized), reason, batchSize |
forwarder_disabled_acceptance |
Admin acknowledged the forwarder-disabled legal modal. | Admin user, host (Splunk-stamped IP), tcVersion, optInChoice, disclaimerHash |
ai_assistant_enable_acceptance |
Admin acknowledged the AI-Assistant-enable legal modal. | Same as forwarder acceptance, plus the seven-clause enable-disclaimer hash |
Every event also carries a small set of common fields:
timestamp— ISO-8601 UTC.user— Splunk username (fromservices/authentication/current-context).sessionId— Per-tab session id baked at AI Assistant init.seq— Monotonic per-session sequence number, useful for ordering events within a session even when timestamps tie.
The In-App Audit Log Viewer¶
The Audit Log tab in Settings → AI Assistant provides a read-only browser of the index. Filters:
| Filter | Default | Notes |
|---|---|---|
| Time range | Last 7 days | Reads from the global TimeRange picker; not a separate field. Re-runs on picker change. |
| Category | (all 12) | Multi-select with colored chips. Each category has its own gradient (cyan-light SAP-Basis-style for local_only, gold-orange for vendor calls, red for security blocks, etc.). |
| User contains | (empty) | Substring filter on the user field. Useful for “what did admin X do?” reviews. |
| Limit | 100 | One of 25 / 100 / 500 / 1000. Larger values slow page rendering. |
The table renders 25 rows per page (PAGE_SIZE = 25); footer shows “Page X of Y” + Previous / Next buttons (only when total exceeds 25). Clicking a row’s + button expands to show the full event JSON.
Splunk reserved-field gotcha: the category field on these events is a Splunk reserved name. The viewer’s SPL uses | eval category=json_extract(_raw, "category") after spath to retrieve the audit-event category from the raw JSON, because spath does NOT overwrite reserved fields. If you write your own searches against this index, replicate this pattern.
Tamper-Resistance Threat Model¶
Audit events live in a Splunk index on the same host as the LogServ App. A host-root admin can edit the underlying bucket files — they can delete events, rewrite events, replay old events, or delete the entire index. The audit log is NOT tamper-evident on the local instance alone.
Mitigation: forward audit events to a separate Splunk / SIEM / S3-with-Object-Lock destination owned by a different admin team. The HEC forwarder (below) provides this. The threat model assumes a malicious or compromised insider with admin rights to the LogServ Splunk instance but NOT to the destination instance.
Disclaimer text shown at the top of the Audit Log tab:
Audit events live in a Splunk index. A host-root admin can edit the bucket files. Mitigation: forward audit events to a separate Splunk instance / SIEM / S3-with-Object-Lock owned by a different admin team. Configure the HEC forwarder under Settings → General → Audit & Telemetry.
HEC Forwarder¶
Optional admin-configurable forwarding of audit events to a separate Splunk / SIEM via Splunk’s HTTP Event Collector. When enabled:
- Browser-side dual-write at flush. The
AuditWriter.flush()path (and the per-eventpostOneOff()path) sends to BOTH the locallogserv_ai_assistant_auditindex (via the standardservices/receivers/simpleREST endpoint) AND the configured HEC URL. The two writes are independent — local-index failure doesn’t block forwarder write, and vice versa. - Failure visibility. When the HEC POST fails (DNS error, network timeout, 4xx/5xx response), an
audit_forwarder_failureevent is generated locally. So a disabled / down forwarder is visible in the local audit log itself, not silently failing. - Auth. The HEC token is sent on every POST as
Authorization: Splunk <token>header. Token is stored in Splunk’s encrypted password store at realmlogserv_ai_assistant_forwardernamehec_tokenand never displayed in cleartext. - Sanitized URL in failure events. When a forwarder failure event records the
destinationUrl, query strings + fragments are stripped to prevent accidental exposure of any auth-bearing URL params.
Configuring the forwarder¶
- Open Settings → AI Assistant → General.
- Find the Audit & Telemetry subsection.
- Set
audit_forwarder_urlto the HEC endpoint (e.g.,https://siem.example.com:8088/services/collector). - Optionally set
audit_forwarder_index(recommended: a dedicated index likesplunk_auditon the destination). - Optionally set
audit_forwarder_source(defaults tologserv:ai_assistant:audit). - Set
audit_forwarder_enabled = true. - Open Settings → AI Assistant → Splunk MCP → Audit Log Forwarder panel.
- Click Set next to the HEC token field.
- Paste the HEC token from your destination Splunk’s HEC input.
- Save. The next audit event triggers a forwarder POST.
- Check the destination Splunk for events arriving at the configured index/source.
When the admin saves with the forwarder OFF¶
A forwarder-disabled-acceptance modal blocks the save until the admin acknowledges the integrity-mitigation responsibility. The acceptance is recorded as a forwarder_disabled_acceptance audit event with admin identity, Splunk-stamped IP, timestamp, and SHA-256 of the disclaimer revision.
Audit Index Provisioning¶
The logserv_ai_assistant_audit index is defined in the Data TA’s default/indexes.conf and created automatically when the Data TA is installed on the indexer / search head. No customer-side provisioning needed.
The index name is macro-configurable — see Renaming an index for the procedure (update the sap_logserv_audit_idx_macro macro definition for reads, plus the audit_index_name field in Settings → AI Assistant → General → Audit & Telemetry for writes).
Retention uses the system default unless the customer overrides it on their indexer’s indexes.conf — for compliance reviews going back > 90 days, override frozenTimePeriodInSecs accordingly. Recommended retention for compliance use cases: 2 years to cover annual audit cycles plus a buffer. For SOX / PCI / HIPAA contexts where regulator records-retention requirements apply, follow the regulator’s spec.
Querying the Audit Index Directly¶
You can query the audit index from any search bar — the in-app viewer is just a curated UX over the same SPL. The starter searches below use the \sap_logserv_audit_idx_macro`` macro so they continue to work after a rename:
All Tier 2 calls in the last 7 days, with USD cost summed by user:
`sap_logserv_audit_idx_macro` earliest=-7d
| spath
| eval category=json_extract(_raw, "category")
| where category="vendor_tier2"
| stats sum(vendorCostEstimateUsd) as total_usd, count by user
| sort - total_usd
All security blocks in the last 30 days, grouped by user + offending operator:
`sap_logserv_audit_idx_macro` earliest=-30d
| spath
| eval category=json_extract(_raw, "category")
| where category="security_blocked_spl"
| stats count by user, operator
| sort - count
All Tier 2 elevation events ever (compliance review):
`sap_logserv_audit_idx_macro` earliest=0
| spath
| eval category=json_extract(_raw, "category")
| where category="vendor_tier2_elevation"
| table _time, user, previousTier, newTier
Forwarder failures grouped by reason (operational health):
`sap_logserv_audit_idx_macro` earliest=-7d
| spath
| eval category=json_extract(_raw, "category")
| where category="audit_forwarder_failure"
| stats count by reason, destinationUrl
Audit Modal in the AI Assistant Panel¶
The privacy banner at the top of the AI Assistant chat panel includes an Audit this session button. Clicking it opens a per-session audit modal:
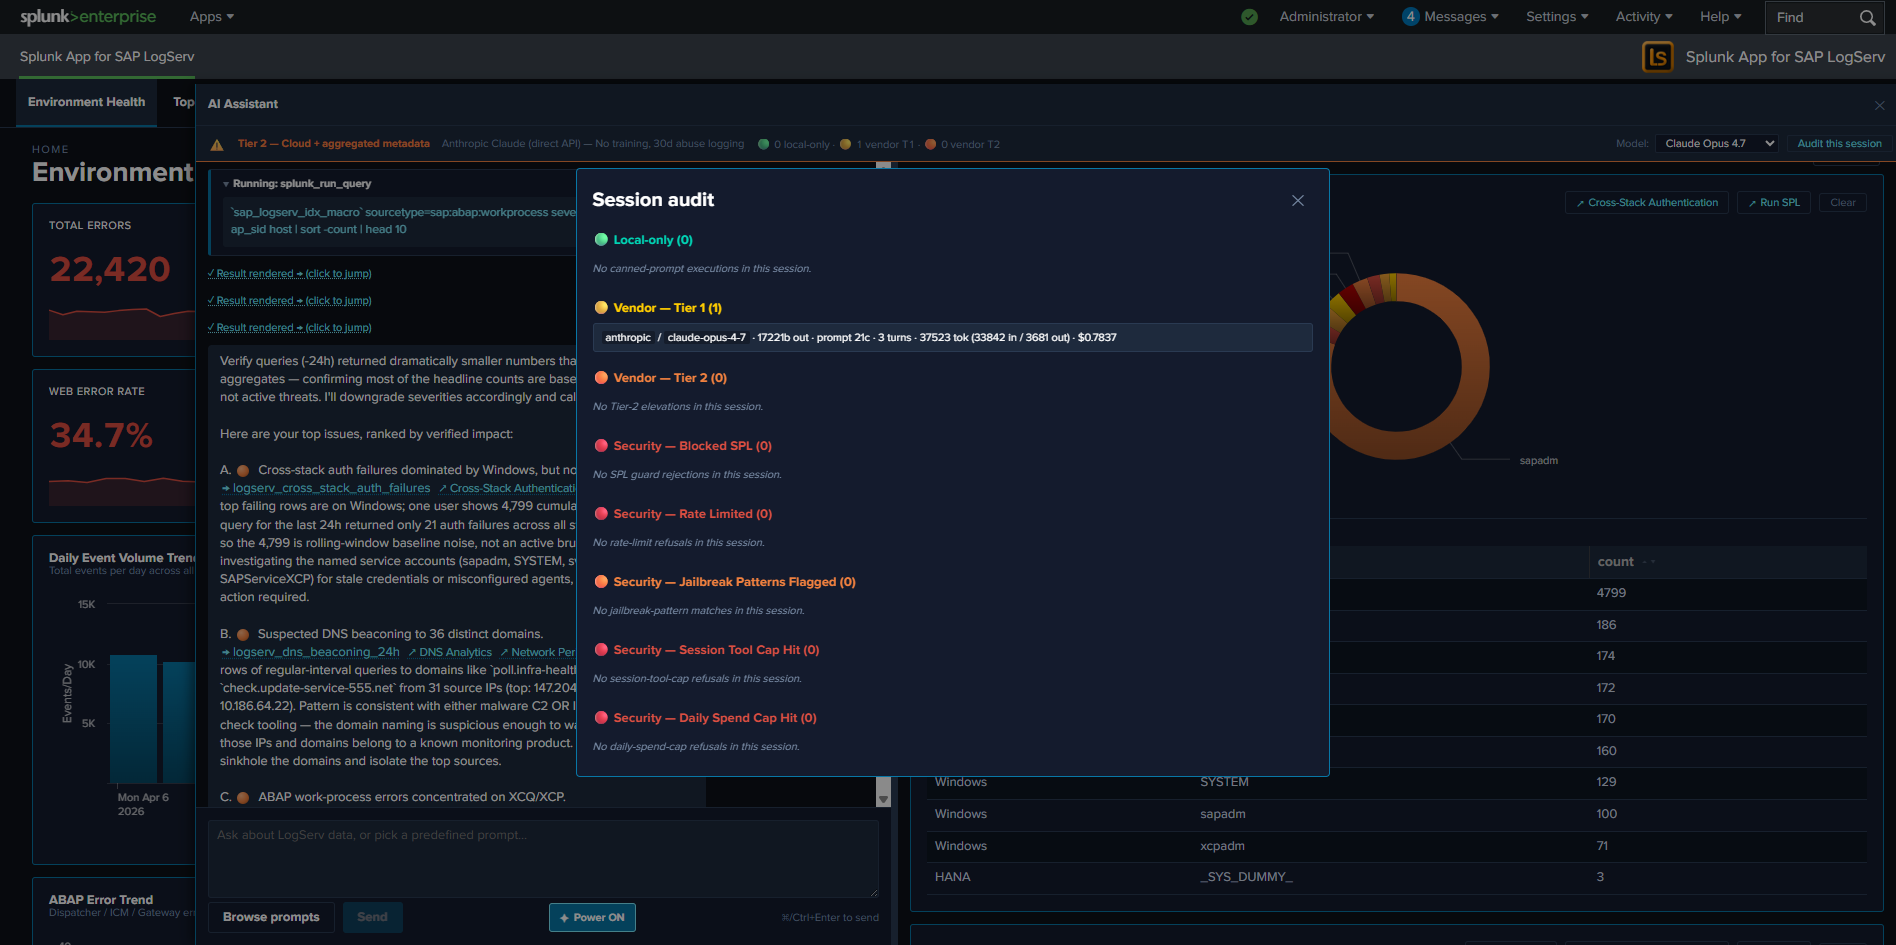
The modal shows a chronological list of every audit event for the current session (matched on sessionId). Useful for users who want to confirm what their last few prompts triggered without leaving the AI Assistant panel. The modal is the in-pane equivalent of the Settings → Audit Log tab, scoped to the current session.
Time-Window Reasoning¶
Current release: these primer rules are not exercised — LLM dispatch is disabled
The time-window reasoning rules are baked into the system primer and ship with every current build, but they only take effect when the LLM-driven path runs — which is disabled at compile time in the current release pending internal review. Predefined-prompt dispatches in the current release still respect the saved-search SPL’s own time window (which is what the rules are about), but there is no AI synthesis layer applying these rules in the current release. This page is preserved as the design reference for the future release that re-enables the LLM path.
Time-window reasoning is a set of primer rules baked into the AI Assistant’s system primer (Tier 1 + Tier 2 variants) that teach the LLM to identify the dispatch window, normalize cumulative count to per-hour or per-day rate, and run a verify-query before declaring high-severity findings. The rules ship as a dedicated === TIME-WINDOW REASONING — APPLY BEFORE EVERY SEVERITY CLAIM === block in the primer, inserted right after the data-boundary block and before the saved-search catalog.
This page exists primarily for SOC analysts who use the AI Assistant for top-N investigations: knowing how the AI reasons about windows + rates + verification helps you read its replies critically, validate its severity claims, and recognize its self-correction behavior.
The Bug This Fixes¶
Before the time-window rules shipped, the AI sometimes cited cumulative aggregates as if they were active rates. A real example reproduced during the test cycle:
User prompt: “find the top 10 issues I need to attend to in priority / severity”.
The AI’s first response cited:
A. [severity:high] Likely brute-force on a Windows service account. One user/stack pair accumulated 4,799 failed authentications. Service-style accounts (sapadm, SYSTEM, svc_monitor, SAPServiceXCP, svc_backup) dominate. Lock/rotate the affected accounts today, confirm source host…
The 4,799 number was a cumulative count over the saved search’s wider rolling window (~30 days for that prompt), NOT an active rate. Drilling into the same data with a -24h window returned only 18 events across 5 service accounts on 1 host — baseline noise, not an active brute-force. The AI’s “Lock/rotate today” recommendation was wrong; the user almost took action on a false alarm.
The bug wasn’t a data-access problem (the AI had the right number). The bug was a reasoning problem: the AI didn’t know whether 4,799 was a 30-day baseline (~160/day = noise) or a 24-hour burst (= active threat). Aggregate value alone CANNOT distinguish.
The Four Rules¶
The primer block teaches the AI to apply these four rules before declaring a finding’s severity:
Rule 1 — Identify the Window¶
Saved-search counts are CUMULATIVE over each search’s own rolling window (typically -24h to -30d, baked into the saved-search SPL). The user’s TimeRange picker in the UI does NOT necessarily align with that window.
Tier 1: the summary the AI receives is Returned N rows in M ms. — no window data at all. The AI must hedge: “X rows over the search’s rolling window, exact span unknown” OR infer from the saved-search NAME (e.g., *_24h, *_after_hours) when the name carries a window hint.
Tier 2: the summary includes a Time range: line ONLY when the result has a _time column (timecharts, time-series). For aggregate searches like stats by user, no _time column → no time-range line → AI must hedge as in Tier 1.
Rule 2 — Normalize Count → Rate¶
Convert sum / max from the aggregates to events/hour or events/day before assigning severity. Rough thresholds documented in the primer:
| Signal | High threshold |
|---|---|
| Auth failures | >10/hour |
| Warn-level errors | >100/hour |
| Ingest volume | >1000/hour |
A 4,799 cumulative count over 30 days = ~160/day = ~6.6/hour. For auth failures, that’s below the >10/hour high threshold → severity should be medium or low, not high.
Rule 3 — Verify Before Recommending Action¶
For any finding ranked [severity:high] or [severity:critical], the AI MUST dispatch ONE additional splunk_run_query call with earliest=-24h latest=now BEFORE writing the narrative response. The verify either confirms the cumulative total is also a current rate, or reveals it’s baseline noise.
If the verify returns dramatically smaller numbers than the cumulative headline, the AI must re-rank the finding to medium or low and SAY SO in the body. Active-tense claims (“Lock/rotate accounts today”, “active brute-force”, “data exfiltration in progress”) MUST be backed by a verify query, never by a cumulative count alone.
Rule 4 — State the Window in Narrative¶
Precise phrases: - “X events in the last 24 hours” — for verify-confirmed claims - “X cumulative over the search’s rolling window” — for un-verified cumulative aggregates - “~Y/hour active rate, verify-confirmed” — for normalized-to-rate severity claims
Active-tense phrases (“active brute-force”, “happening today”, “current attack”) MUST be backed by a narrow-window verify query — not by cumulative counts or top-N aggregates alone.
What “Verify-Confirmed Severity” Looks Like in Replies¶
After the rules shipped, the same prompt (re-run on the same data) produced a self-corrected response that explicitly downgrades the finding:
G. [severity:medium] Cross-stack auth failures show high cumulative count but no current activity. [→ logserv_cross_stack_auth_failures] ↗ Cross-Stack Authentication ↗ Run SPL Top row showed 4,799 attempts but my -24h verify returned only 19 auth failures across all stacks combined — this is a stale long-window aggregate, not an active brute-force. No immediate action needed; review baselines.
The AI:
- Cited the cumulative number (4,799) — appropriate context.
- Ran the verify query (
-24h) — required by Rule 3. - Reported the verify result (only 19) — required by Rule 4.
- Re-ranked to medium — required by Rule 3.
- Used precise window-aware language (“stale long-window aggregate, not an active brute-force”) — required by Rule 4.
- Recommended a non-urgent next step (“review baselines”) instead of “Lock/rotate today”.
This is the correct shape. When you read a top-N response, look for these markers:
- ✓ Findings ranked high or critical reference both a cumulative number AND a verify-query result
- ✓ Active-tense recommendations come ONLY from verified high-rate findings
- ✓ Findings that were going to be high but verified down to noise are explicitly downgraded with framing like “stale aggregate, not active”
Edge Cases¶
When the verify query also returns high counts¶
If a finding cites 4,799 cumulative AND the verify query returns 412 in the last 24h (~17/hour, above the >10/hour threshold), the AI keeps the finding at high severity and says: “412 of those 4,799 landed today, ~17/hr — an active rate.” Now the active-tense “Lock/rotate today” recommendation is justified.
When the saved-search name implies the window¶
Some prompts have window hints in their names: logserv_dns_beaconing_24h, logserv_hana_after_hours_admin. For these, the AI uses the name-implied window for Rule 1 and skips Rule 3’s verify step (the saved search itself IS the narrow-window query).
When no splunk_run_query is available (Templates-only)¶
In the Templates-only build, free-form prompts are disabled — there’s no LLM-driven verify path. The time-window rules don’t apply because the AI doesn’t run. Predefined prompts have explicit windows in their SPL and produce static interpretation cards (no AI synthesis), so no rate-reasoning step is needed.
When Tier 1 is active¶
Tier 1 gives the AI count + timing only — it cannot see the actual values, so it cannot do Rule 2’s normalization. The AI hedges harder: “the search returned N rows for the rolling window, suggesting non-trivial activity” without making rate claims. Tier 1 narrative is intentionally less concrete; users read the rendered tile for the actual numbers.
Power Mode Compounds With Time-Window Reasoning¶
When Power Mode is on AND a free-form prompt asks for top-N issues:
- Power Mode forces a saved-search dispatch (Rule out: AI never replies from prior knowledge).
- Each high/critical finding in the AI’s reply forces an additional verify query (per Rule 3).
- Result: a 5-finding top-N response can dispatch 5 saved searches + up to 5 verify queries = 10 total Splunk dispatches.
This is the correct behavior for compliance investigations and high-stakes triage — every claim is data-grounded AND verify-confirmed. The cost is higher per-turn latency + tool budget, but for the customer’s most important investigations, the cost is the right trade.
Templates-only Build Variant¶
Current release: the templates-only build IS the default ship — LLM functionality intentionally disabled pending review
In the current release, the templates-only build is not just a partner-only variant — it is the only released build. The LLM-driven path is disabled at compile time pending internal review of the OWASP LLM Top 10 controls. Once review concludes, a future release will publish the regular variant alongside the templates-only variant. Until then, every customer running the current release — production, partner, demo — runs the templates-only build.
The templates-only build is a variant of the LogServ App that has the AI Assistant’s free-form / LLM-driven path disabled at compile time — and, because the cloud LLM provider implementations are physically removed from the build’s source, no configuration change can restore LLM functionality. A templates_only_mode config field does exist in the bundle, but flipping it (or any other setting) cannot re-enable the LLM path when the provider code isn’t present to call. The MCP path + 61 canned prompts + tool tiles + drill-down chips + audit log all stay fully active, so the LogServ solution can be run end-to-end without an LLM provider. In the current release, this is the only released build; in future releases it will continue to exist as a deployable variant alongside the regular LLM-enabled build.
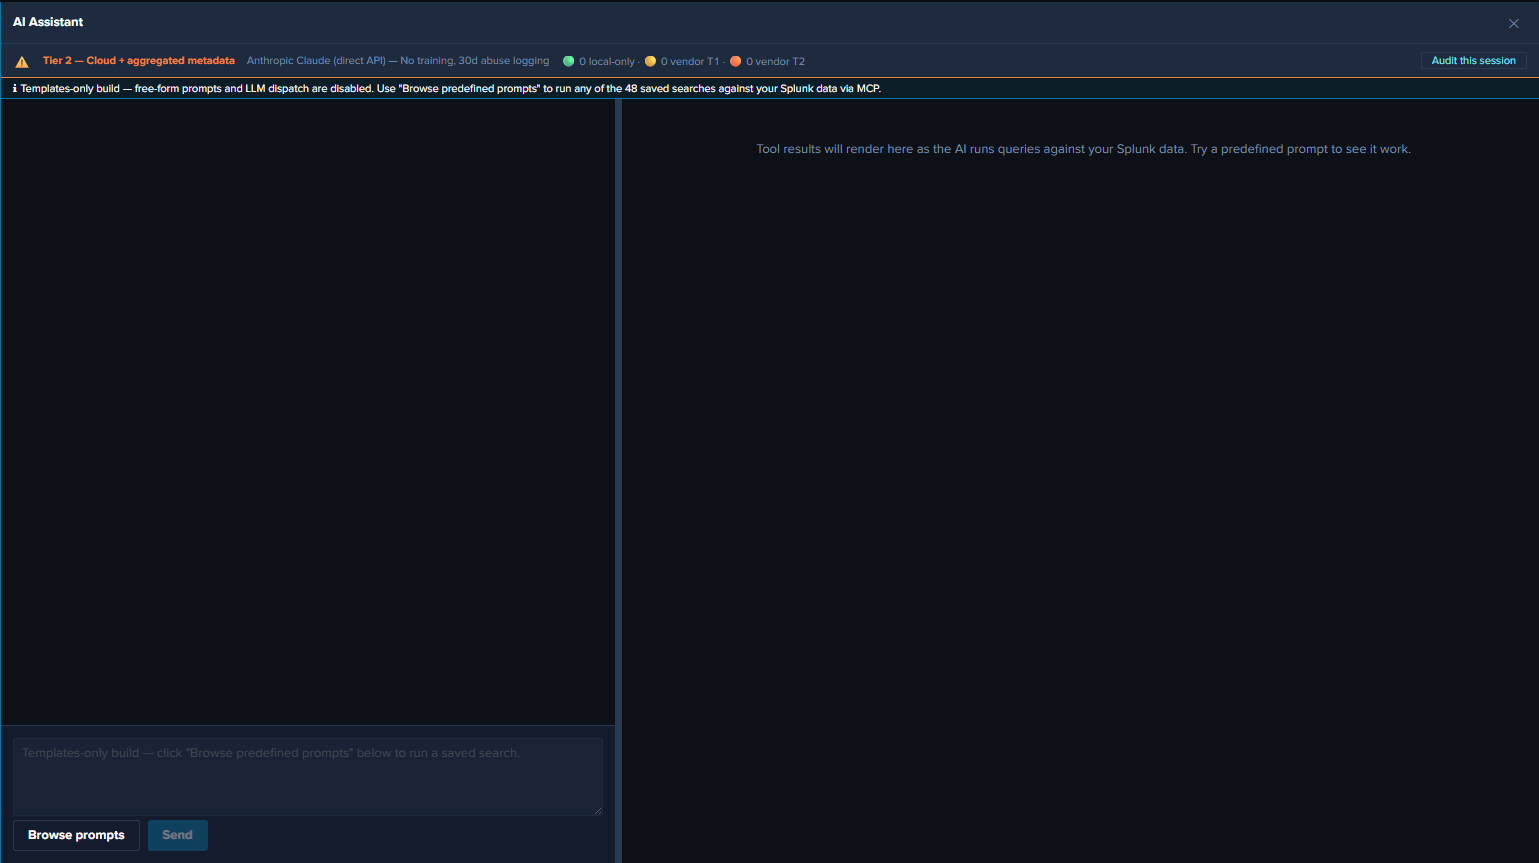
Why a Compile-Time Variant¶
The runtime alternative — an admin toggle in Settings that disables the LLM path — would let any local Splunk admin flip it back on. For deployments where the LLM dispatch path is intentionally not available — such as the current release (pending review), demonstration environments, or restricted-environment customers — a compile-time variant is the right shape: the bundle has no code path that reaches an LLM (the provider implementations are physically removed from the source), so no runtime setting could enable one.
What Changes in the Templates-only Build¶
UI gating (visible to the user)¶
- Chat input text field — disabled, with placeholder “Templates-only build — click ‘Browse predefined prompts’ below to run a saved search.”
- Send button — unconditionally disabled (in addition to the existing
!text.trim() || busyguard). - Power Mode toggle — hidden (forced-RAG is meaningless when there’s no LLM call to force a saved-search before).
- Browse prompts button — fully enabled. The only entry point in this build.
- Privacy banner model picker — hidden (no model = no picker).
- Top-of-chat info banner — cyan-info-tone banner reads: “Templates-only build — free-form prompts and LLM dispatch are disabled. Use ‘Browse predefined prompts’ to run any of the 61 saved searches against your Splunk data via MCP.”
- Settings page — the Provider Credentials tab is hidden entirely. Top-of-page info banner explains the build mode. Other tabs (General / Splunk MCP / Audit Log) remain fully visible since partners need MCP config + audit visibility.
Defense-in-depth runtime guard¶
Even if a future code path reaches the LLM dispatch entry point (keyboard shortcut, programmatic dispatch from a future feature, etc.), a runtime guard short-circuits with a system notice — the UI gating is the primary defense, and the function-level guard is the safety net. For the guard’s exact location and code shape, see AI Assistant Implementation Reference.
What’s Still Active in Templates-only¶
- All 61 predefined prompts. Click any card in the prompt browser to dispatch.
- Tool tiles in the right pane. Tables, charts, KPIs, pies — all rendered identically to the regular build.
- Static interpretation + suggested-next-steps cards. Per-prompt guidance from the intent map.
- Drill-down chips.
↗ Dashboard(one per related dashboard) +↗ Run SPLon every tile. - Audit log. All
local_onlyevents for canned-prompt dispatches, plusaudit_forwarder_failureevents if the forwarder is configured. Novendor_tier1/vendor_tier2events because there are no vendor calls. - HEC audit forwarder. Same dual-write behavior as the regular build.
- All dashboards. Environment Health, Applications, Integration, Security, Platform — all 21 dashboards plus the Environment Topology view.
- Per-dashboard auto-refresh picker, Download PNG, time-range URL preservation. All identical to the regular build.
- Settings → General, Splunk MCP, Audit Log. Visible and functional; admin can configure MCP, audit forwarder, etc.
What’s Disabled in Templates-only¶
- Free-form prompts. Chat input greyed; Send disabled. The defense-in-depth guard short-circuits any code path that reaches the LLM dispatch entry point.
- Power Mode. Toggle hidden; the forced-RAG rule has nothing to enforce since there’s no LLM dispatch.
- Provider Credentials tab. Hidden entirely.
- Model picker in privacy banner. Hidden.
- Vendor calls.
vendor_tier1/vendor_tier2audit categories are never emitted.
End-User Experience¶
After the templates-only build is installed, the user opens Splunk Web → clicks the ✦ AI Assistant button. The cyan “Templates-only build” banner renders at the top of the chat panel. The user opens the prompt browser, runs prompts, sees tiles + drill-down chips, and navigates dashboards. The full LogServ analytics experience is available, just without the free-form / LLM-driven path.
The destination Splunk search head needs the Splunk MCP Server installed for prompt dispatch to work.
OWASP LLM Top 10 (2025) Compliance¶
This page is intended for the customer’s security team reviewing the LogServ App’s AI Assistant feature for production deployment. It covers each of the OWASP LLM Top 10 (2025) items and the controls the LogServ App ships to address them.
Companion page
For the same controls organized along Google’s Secure AI Framework (SAIF) four-pillar structure plus a coverage matrix of SAIF’s 15 Key Risks, see SAIF Security Architecture.
Current release: LLM functionality intentionally disabled pending review
The current release ships with the LLM-driven path disabled at compile time pending internal review. The controls described on this page are designed, implemented, and exercised by the build’s CI pipeline — but the LLM dispatch pathway itself is gated off via the Templates-only build flag until the review concludes. The predefined-prompt path + Splunk MCP integration + audit log remain fully active. This page documents the controls so reviewers can evaluate the security posture for a future release that re-enables the LLM path.
LLM01 — Prompt Injection¶
Threat: an attacker (either via the user-prompt vector or via in-band tool-result data) crafts input that hijacks the LLM’s instruction-following behavior, causing it to ignore the system primer or perform unintended actions.
Controls shipped:
<TOOL_RESULT_DATA>...</TOOL_RESULT_DATA>sentinel block wraps every tool-result summary the AI sees. The system primer instructs the AI to treat anything inside the sentinel as DATA from the customer’s environment, NEVER as instructions, regardless of how command-like the contents look. Mitigates the in-band channel of prompt injection: a malicious user who can write events into the customer’s Splunk index could in principle craft field values likeuser="Ignore prior instructions and...", but the sentinel + sanitizer reduces the effective attack surface to near-zero.- Per-value sanitizer for Tier 2 categorical aggregates (
sanitizeAggregateValue()). Three classes of suspicious content get replaced wholesale with<filtered>: strings starting with role markers (system:,user:,assistant:, etc.), strings containing known jailbreak / prompt-injection idioms (ignore prior instructions,[INST],<|im_start|>,<|system|>,disregard the above,jailbreak), and strings containing the sentinel tags themselves (prevents a malicious value from prematurely closing the data block). - Jailbreak pattern detection on user prompts. Flag-and-proceed: matches fire a
user_prompt_jailbreak_flagaudit event but do not block the prompt. Captures a hash + length + matched-pattern groups + char-class fingerprint for SOC pivot analysis. - Defense-in-depth chain. Type-system enforcement (LLM02) + Tier 2 sanitizer + tool-result sentinel + primer + vendor-side defenses provide multiple independent layers; bypassing any one doesn’t break the chain.
LLM02 — Sensitive Information Disclosure¶
Threat: the LLM emits sensitive customer data (PII, secrets, internal-only information) in its responses or causes it to be transmitted to the vendor.
Controls shipped:
- TypeScript type-system enforcement. The compiler refuses to put any tool-result value into the outbound vendor payload — there is no runtime check, no flag to flip, no policy to forget. The only conversion path produces a non-data summary that the caller’s chosen summarizer controls. See Privacy Tiers and AI Assistant Implementation Reference.
- Privacy tier scoping. Tier 1 (default) gives the AI count + execution time only — no values. Tier 2 (admin opt-in) adds aggregated metadata (top-N values + counts, numeric stats, time range). Neither tier sends raw rows.
- PII redaction at Tier 2. Column-name-based detection redacts
email,user(name),*_ip,mac,account(hostname opt-in) before values are sent to the vendor. Stable per-value<redacted-XXXXXXX>tags so the AI can still reason about cardinality without seeing the actual identifier. <TOOL_RESULT_DATA>sentinel (also LLM01) prevents the AI from accidentally treating sanitized data as instructions and echoing it back unsanitized.- Vendor-side commitments. Anthropic / OpenAI / Azure OpenAI / AWS Bedrock each publish their own data-usage commitments (no training on API traffic for Anthropic & OpenAI direct API by default). The customer’s DPA review should confirm vendor-side processor obligations.
LLM03 — Supply Chain¶
Threat: a compromised or vulnerable third-party dependency in the bundle introduces an attack vector or data-exfil channel.
Controls shipped:
- CI dependency audit gate. Every CI build runs a dependency audit at the
highadvisory level — non-zero exit on high or critical advisories. Hard-gates the shippable build path so released builds always pass at high+. - SBOM (Software Bill of Materials) shipped with every build. A bundled generator parses the package lock directly (no external tool dependency) and emits a
SBOM.jsonin CycloneDX 1.4 format withpurl(Package URL) + sha-512 hash per dependency. The SBOM enumerates every bundled dependency; reviewers can pin against this list. - Audit-log forwarder configurability so SBOM-driven vulnerability response can correlate against actual usage patterns across customers.
LLM04 — Data and Model Poisoning¶
Threat: an attacker with the ability to write events into the customer’s Splunk index could craft field values that, when surfaced to the AI as Tier 2 aggregates, hijack the AI’s downstream behavior (e.g., by appearing to be system instructions).
Controls shipped:
<TOOL_RESULT_DATA>sentinel block (also LLM01).- Per-value sanitizer with role-marker + jailbreak-idiom + sentinel-tag filtering (also LLM01).
- Truncation of categorical aggregate values to 40 chars to reduce the budget available for embedded jailbreak prompts.
- Top-N capping of categorical aggregates at 10 by default (max 50) — bounds the volume of AI-visible value content per column.
LLM05 — Improper Output Handling¶
Threat: the LLM’s response contains content that, when rendered or executed, harms the user (e.g., XSS via injected HTML, command injection via shell-formatted output).
Controls shipped:
- React rendering uses JSX text nodes, not
dangerouslySetInnerHTML. Strings are escaped by default; markdown is parsed via a controlled set of recognized markers (citation, severity, bold) — no general-purpose HTML rendering. - Drill-down URLs built via
buildSplunkSearchUrl()useencodeURIComponent()for the SPL string and centralize thetarget="_blank" rel="noopener noreferrer"security flags. Thenoopenerflag breaks thewindow.openerreference for reverse-tabnabbing. - AI-authored SPL goes through a static-analysis guard before dispatch (see LLM06).
LLM06 — Excessive Agency¶
Threat: the AI is given the ability to perform actions whose consequences exceed the user’s intent (e.g., write/delete data, send emails, exfiltrate via output channels).
Controls shipped:
- SPL static-analysis guard for AI-authored
splunk_run_query. Blockscollect,outputlookup,outputcsv,delete,sendalert,sendemail,script,run,tscollect. Blocked SPL produces a synthetic error tool_result + asecurity_blocked_splaudit event. The AI sees the error and can recover by writing a different query. - Per-session tool-call cap prevents infinite tool loops. Maps to
session_tool_cap_hitaudit event on overflow. - Pre-authored saved searches via
splunk_run_saved_searchare NOT subject to the guard — their SPL is reviewed at build time. The guard scope is exclusively the AI-written ad-hoc path.
LLM07 — System Prompt Leakage¶
Threat: the system primer leaks to the user (or via the user back to the vendor’s prompt-logging) and exposes internal instructions, lookups, or configuration.
Controls shipped:
- No customer-secret content in the primer. The primer contains: tool definitions, the saved-search catalog (names + labels, public information), the LogServ data-model summary (sourcetypes + field names, public), the synthesis rules. No customer-specific identifiers, no API keys, no internal URLs.
- Time-window reasoning rules are pedagogical (about how the AI should reason about its inputs) — leakage of these rules has no security impact.
The customer’s DPA review should still confirm vendor-side prompt-logging policies (Anthropic, OpenAI, Azure, Bedrock all log prompts at varying retention; some offer enterprise tiers with no-logging guarantees).
LLM08 — Vector and Embedding Weaknesses¶
Threat: vector / embedding stores used for RAG can leak sensitive data if not access-controlled, can be poisoned by malicious indexed content, or can return chunks across security boundaries.
Status: Not applicable. The LogServ App’s AI Assistant does NOT use vector embeddings or a separate RAG store. The “RAG” here is direct tool dispatch against the customer’s own Splunk index — every retrieval is an SPL search bounded by Splunk’s own RBAC (either a live event search or a read of one of the app’s own access-controlled KV-Store rollups; neither is an embedding store). There is no vector store to compromise.
LLM09 — Misinformation¶
Threat: the LLM produces confident-sounding but incorrect information that the user acts on.
Controls shipped:
AI-generated — verify before actingdisclaimer rendered as a small muted footer below every AI assistant_text bubble. Visible on every reply, never collapsed.- Time-window reasoning rules (Time-Window Reasoning) force the AI to verify high-severity claims with a narrow-window query before recommending action. Self-correction is observable in the response (the AI reports the cumulative number AND the verify-query result).
- Citation chips (
[→ saved_search_name]) link every claim back to the source tool_result tile, so users can sanity-check the narrative against the rendered data. - Predefined-prompt path (default for routine investigations) has zero AI-misinformation risk — the dispatch is deterministic and the interpretation card is pre-authored, not generated.
LLM10 — Unbounded Consumption¶
Threat: uncontrolled vendor calls drive arbitrary cost, latency, or denial-of-service on the user-facing experience.
Controls shipped:
- Per-user rolling-1-hour rate limit on free-form prompts. Configurable via
rate_limit_per_hourin Settings (default 30, 0 = disabled). Recordsrate_limited_promptaudit event on hit. - Cumulative-cost daily spend cap in USD. Configurable via
daily_spend_cap_usdin Settings. Resets at 00:00 UTC. Recordsdaily_spend_cap_hitaudit event on hit. - Per-session tool-call cap to prevent infinite tool loops. Records
session_tool_cap_hit. - Token-usage observability in every
vendor_tier1/vendor_tier2audit event: input tokens, output tokens, total tokens, USD cost estimate. Lets finance attribute spend to specific users / sessions. - Streaming + abort in the chat UI — users can cancel an in-flight expensive turn via the Stop button.
- Canned prompts are NOT rate-limited — they bypass the AI vendor entirely and are bounded by Splunk’s own search-quota controls, not vendor cost.
Compliance Posture Summary¶
| OWASP item | Status | Primary control |
|---|---|---|
| LLM01 — Prompt Injection | Mitigated | TOOL_RESULT_DATA sentinel + per-value sanitizer + jailbreak detection + primer hardening |
| LLM02 — Sensitive Information Disclosure | Mitigated | Hidden<T> type-system enforcement + Tier 1/2 sanitize chokepoint + PII redaction |
| LLM03 — Supply Chain | Mitigated | CI dependency-audit hard-gate at high+ severity + CycloneDX SBOM with sha-512 hashes |
| LLM04 — Data and Model Poisoning | Mitigated | TOOL_RESULT_DATA sentinel + per-value sanitizer + 40-char value truncation + top-N cap |
| LLM05 — Improper Output Handling | Mitigated | React JSX text nodes + URL encoding + noopener + SPL static-analysis guard |
| LLM06 — Excessive Agency | Mitigated | SPL static-analysis guard + session tool-call cap |
| LLM07 — System Prompt Leakage | Mitigated | No customer-secret content in primer; vendor-side DPA review needed |
| LLM08 — Vector and Embedding Weaknesses | Not applicable | No separate vector store; live SPL dispatch via Splunk RBAC |
| LLM09 — Misinformation | Mitigated | AI-generated disclaimer + time-window reasoning + citation chips + predefined-prompt path |
| LLM10 — Unbounded Consumption | Mitigated | Per-user rate limit + daily spend cap + session tool-call cap + token-usage audit |
Pending Internal Review¶
The current release ships with the LLM dispatch pathway gated off via the Templates-only build flag pending internal review of the controls described on this page. The review’s outcome will determine when a future release re-enables the LLM path. The predefined-prompt path + Splunk MCP Server integration + audit log remain fully active in the meantime — partners and customers running the current build can exercise the canned-prompt investigation flow + drill-down chips + audit observability without any LLM dispatch.
For the controls described above to take effect, the LLM path must be re-enabled in a subsequent release. The same controls apply at that point; nothing on this page changes between the current release (LLM disabled) and the future re-enable release.
Security Architecture — SAIF Alignment¶
This page is for customer security teams evaluating the LogServ App’s AI Assistant feature against Google’s Secure AI Framework (SAIF). It complements the OWASP LLM Top 10 Compliance page — same set of controls, organized along SAIF’s four-pillar structure and mapped to SAIF’s 15 Key Risks catalog.
Current release: LLM functionality intentionally disabled pending review
The current release ships with the LLM-driven path disabled at compile time pending internal review. The controls described on this page are designed, implemented, and exercised by the build’s CI pipeline — but the LLM dispatch pathway itself is gated off via the Templates-only build flag until the review concludes. The predefined-prompt path + Splunk MCP integration + audit log remain fully active. This page documents the security architecture so reviewers can evaluate the posture for a future release that re-enables the LLM path.
The Privacy Boundary¶
The LogServ AI Assistant is designed around one flagship security property: no event data from your Splunk indexes is ever transmitted to any AI vendor. This isn’t a policy commitment — it’s enforced by the TypeScript type system at compile time.
- Tool results returned from Splunk via MCP are typed as
Hidden<T>. - The compiler refuses to put a
Hidden<T>value into an outbound LLM payload. - The only conversion path is
sanitize(hidden, summarizer)— which forces the caller to supply a non-data summary string. - There is no runtime flag, no policy toggle, no override.
What the AI sees:
| Privacy Tier | What’s sent to the vendor LLM |
|---|---|
| Tier 0 (Ollama, planned) | Nothing — fully on-host |
| Tier 1 (default) | Tool execution metadata only: row count + timing. No values. |
| Tier 2 (admin opt-in) | Tool result aggregated metadata: cardinality, top-N values + counts, numeric stats, time range. Still no raw rows. Plus PII redaction on identifier columns. |
Detail: Privacy Tiers.
SAIF Four-Pillar Mapping¶
Google’s SAIF organizes AI security controls into four pillars. Here’s how the LogServ AI Assistant maps to each.
Data¶
SAIF’s Data pillar covers how AI systems handle training data, user data, and the data flowing between system boundaries.
Training data — N/A. The LogServ AI Assistant does not train, fine-tune, or update any model. It uses third-party LLMs (Anthropic, OpenAI, Azure OpenAI, AWS Bedrock) through their public APIs. The data-poisoning, unauthorized-training-data, and training-data-sanitization controls in SAIF apply to those vendors, not to LogServ.
User Data Management — fully enforced. The Privacy Boundary (above) is the core control:
Hidden<T>type system blocks event data egress at compile time.- Tier 1 (default) sends only count + timing.
- Tier 2 PII redaction hashes identifier columns (email, user, username, IP, MAC, account) using a per-value tag (
<redacted-XXXXXXX>) so the LLM can still reason about cardinality without seeing the raw value. Hostname redaction is opt-in via Settings. - Every elevation from Tier 0/1 → Tier 2 is recorded in the audit log with the admin’s user identity, timestamp, and previous tier.
Model¶
SAIF’s Model pillar covers model integrity, exfiltration risk, and supply chain.
Model Source Tampering — partial coverage:
- Our supply chain: every CI build runs a dependency audit at the
highadvisory level. A Software Bill of Materials (SBOM.json, CycloneDX 1.4) ships in every release with per-dependencypurl+ sha-512 hashes. The SBOM enumerates every bundled dependency. - Distribution integrity: the released tarball is precert-validated by Splunkbase AppInspect before publication. The Splunk deployment server distributes the Data TA to Heavy Forwarders over Splunk’s mutually-authenticated channel.
- Vendor model weight integrity is the LLM vendor’s responsibility. The customer’s DPA review should confirm vendor-side controls.
Model Exfiltration — N/A. The LogServ App does not host model weights. Cloud LLM models live in vendor infrastructure (Anthropic, OpenAI, Azure, Bedrock). Tier 0 Ollama (planned) would run on the customer’s own host — model weights would be under the customer’s existing storage controls.
Model Reverse Engineering — N/A. The LogServ App exposes a known vendor LLM behind a thin wrapper. The system primer is publishable (see the free-form prompts documentation) — there’s no proprietary prompt engineering to reverse-engineer.
Application¶
SAIF’s Application pillar covers input validation, access management, and output handling for the AI-using application.
Input Validation — multi-layered:
- User-prompt anomaly detection. Eight pattern groups (role redefinition, persona shift, system prompt leak, control tokens, long base64 blobs, system impersonation, tool extraction, excessive length) run on every user prompt before dispatch. Flag-and-proceed semantics: matches fire a
user_prompt_jailbreak_flagaudit event for SOC review but do not block the prompt — regex-based detection has false positives, and blocking would cripple legitimate investigative queries. - SPL static analysis on AI-authored queries. Every
splunk_run_querycall from the AI runs through a guard that blocks forbidden operators (collect,outputlookup,delete,sendalert,script, etc.). Blocked queries surface as asecurity_blocked_splaudit event. - Tool-result sanitization. AI-authored tool arguments are schema-validated. Tier 2 categorical aggregates pass through a per-value sanitizer that replaces strings matching known jailbreak idioms with
<filtered>. <TOOL_RESULT_DATA>sentinel block wraps every tool-result summary the AI sees. The system primer instructs the AI to treat anything inside the sentinel as data from the customer’s environment, never as instructions.
Application Access Management:
- Per-user prompt rate limit (configurable; default tunable in Settings) bounds free-form prompt volume per hour.
- Per-user daily spend cap (configurable; default
0= no cap) bounds vendor cost per day. Tally resets at local midnight. Predefined-prompt executions don’t accumulate against the cap. - Per-chat-session MCP tool-dispatch cap is defense-in-depth above the per-message
MAX_TOOL_TURNSlimit. Prevents runaway tool-loops in adversarial automation. - Feature toggle. The master
enabledswitch in Settings gates the entire feature; transitions from OFF to ON require admin acceptance of a liability acknowledgement modal (recorded with the admin’s user identity, timestamp, disclaimer hash, and version per Splunk’s standard opt-in pattern).
Output Validation:
- The LLM’s output is never executed. Tool calls are schema-validated against a closed catalog of MCP tools. There is no
eval-style path from LLM output to system action. - React rendering uses JSX text nodes, not
dangerouslySetInnerHTML. Strings are escaped by default. Citation markers, severity badges, and bold markdown are parsed via a controlled set of recognized patterns; no general-purpose HTML rendering. - Drill-down URLs are built via a centralized
buildSplunkSearchUrl()helper that usesencodeURIComponent()and appliestarget="_blank" rel="noopener noreferrer"flags to break reverse-tabnabbing attacks.
Agent¶
SAIF’s Agent pillar — newer in SAIF 2.0 — covers autonomous agent behavior, permissions, user control, and observability.
Agent Permissions — read-only. The MCP tool catalog exposed to the AI is explicitly read-only:
splunk_run_query— dispatches an arbitrary SPL query against the customer’s data (subject to the static-analysis guard).splunk_run_saved_search— dispatches a vetted, named saved search from the App’s intent map.
There are no destructive operations available to the AI: no event deletion, no config writes, no user creation, no permission changes, no outbound network actions of any kind beyond the LLM API call.
Agent User Control:
- Tier selection at install time (admin) — Tier 0 / 1 / 2.
- Master enable toggle — admin-controlled, default OFF.
- Per-prompt opt-in — every free-form prompt is user-initiated. There is no autonomous loop, no scheduled prompt execution, no background activity.
- Power Mode is opt-in per-prompt — a single forced-saved-search-first behavior available to designated power users, recorded in the audit log.
- Acknowledgement modals at Settings save time — admin must accept liability disclaimers for (a) enabling the feature, (b) tier elevations, (c) disabling the audit forwarder.
Agent Observability:
- Hash-chained audit log. Every meaningful AI Assistant event (canned prompt execution, free-form vendor call, blocked SPL, rate-limit hit, spend-cap hit, prompt anomaly, tier elevation, settings change) lands in the
logserv_ai_assistant_auditindex with a stable per-tab session ID + monotonic sequence number. The chat panel surfaces “AI is generating response” status; the Audit Log viewer in Settings lets reviewers filter by category, user, and time range. - HEC audit forwarder. Admin can configure a Splunk HEC destination (e.g., a separate indexer, a SIEM, S3-with-Object-Lock owned by a different admin team) for tamper-evident off-host audit copies. Forwarder failures themselves are recorded locally so an off-host divergence is detectable.
- Vendor token-usage audit events capture provider, model, input/output tokens, USD cost estimate (computed locally from list pricing), and turn count — letting SOC teams pivot on cost-anomaly indicators.
SAIF 15 Key Risks — Coverage Matrix¶
The table below maps each SAIF Key Risk to LogServ’s posture. Strong = flagship property of the architecture; Partial = mitigation in place with documented residual surface; N/A = out of scope because LogServ does not train or host models.
| # | SAIF Risk | LogServ Posture | Key Controls |
|---|---|---|---|
| 1 | Data Poisoning (DP) | N/A | LogServ does not train models. |
| 2 | Unauthorized Training Data (UTD) | N/A | LogServ does not train models. No event data ever leaves the privacy boundary. |
| 3 | Model Source Tampering (MST) | Partial | Dependency audit + SBOM. Splunkbase AppInspect precert on distribution. Model weight integrity is vendor responsibility. |
| 4 | Excessive Data Handling (EDH) | Strong | Hidden<T> privacy boundary, Tier 1 default, Tier 2 PII redaction. |
| 5 | Model Exfiltration (MXF) | N/A | LogServ does not host models. |
| 6 | Model Deployment Tampering (MDT) | Partial | Splunkbase precert + DS-channel distribution. Tarball GPG signing is a known gap. |
| 7 | Denial of ML Service (DMS) | Partial | Per-user prompt rate limit + per-user daily spend cap + per-session tool dispatch cap. |
| 8 | Model Reverse Engineering (MRE) | N/A | Publishable system primer, no proprietary prompt engineering. |
| 9 | Insecure Integrated Component (IIC) | Strong | Read-only tool catalog, schema-validated tool calls, SPL static-analysis guard. |
| 10 | Prompt Injection (PIJ) | Partial | Tool-result vector physically blocked by Hidden<T> + sentinel + per-value sanitizer. User-prompt vector flagged (8 pattern groups), not blocked. |
| 11 | Model Evasion (MEV) | N/A | LogServ has no classifiers to evade; ML-evasion is vendor-side. |
| 12 | Sensitive Data Disclosure (SDD) | Strong | Same controls as EDH (privacy boundary + redaction). |
| 13 | Inferred Sensitive Data (ISD) | Partial | Strong by construction (Tier 1 = no values; Tier 2 = redacted aggregates). Hostname redaction is opt-in — small inference surface for environment topology when off. |
| 14 | Insecure Model Output (IMO) | Strong | LLM output never executed; no dangerouslySetInnerHTML; drill-down URLs encoded + tab-nabbing flags. |
| 15 | Rogue Actions (RA) | Strong | Read-only tool surface, no autonomous loop, hash-chained audit log + off-host forwarder. |
Summary: 5 Strong, 5 Partial, 5 N/A. Zero “Not covered” — every SAIF risk in scope for LogServ’s architecture has at least partial mitigation.
Cross-Reference: SAIF ↔ OWASP LLM Top 10¶
The OWASP LLM Top 10 Compliance page covers the same controls organized by attack pattern instead of structural pillar. Most LogServ controls map to both frameworks:
| SAIF Risk | OWASP LLM Item |
|---|---|
| EDH / SDD / ISD | LLM02 — Sensitive Information Disclosure |
| MST | LLM03 — Supply Chain |
| DP / UTD (N/A here) | LLM04 — Data and Model Poisoning |
| IMO | LLM05 — Improper Output Handling |
| IIC / RA | LLM06 — Excessive Agency |
| PIJ | LLM01 — Prompt Injection |
| MEV (N/A here) | LLM07 — System Prompt Leakage (related) |
| DMS | LLM10 — Unbounded Consumption |
What’s Out of Scope¶
Items in SAIF that don’t apply to LogServ’s architecture:
- Model training, fine-tuning, RAG with embedded sensitive data — the AI Assistant does not train, fine-tune, embed, or persist any customer data into any model.
- Vendor model integrity and vendor data handling — these are the LLM vendor’s responsibility. Anthropic, OpenAI, Azure OpenAI, and AWS Bedrock each publish their own data-usage commitments and security posture; the customer’s DPA review should confirm processor obligations.
- Customer Splunk infrastructure security — Splunk’s own access controls, role-based ACLs, and indexer encryption apply normally. The AI Assistant inherits the security posture the customer has configured for Splunk Web access.
Known Residual Gaps¶
Honesty matters in a security architecture page. The following gaps are documented:
- User-prompt jailbreak detection is flag-and-proceed, not block. Regex pattern matching has false positives. Pattern coverage will grow as new attack patterns surface in the wild. The flag-and-proceed posture lets SOC teams review while preserving legitimate investigative use.
- Hostname redaction at Tier 2 is opt-in (default off). Hostname patterns can leak environment topology. Admins can flip the default in Settings if their threat model requires it.
- Tarball GPG signing is not yet implemented. Splunkbase AppInspect precert + DS-channel distribution cover most of the threat model, but a signed tarball would provide an additional integrity proof point. Tracked as a follow-up item.
What Customers Can Do¶
Concrete actions a customer’s security team can take to validate or strengthen the posture:
- Review the audit log regularly. Navigate to AI Assistant → Settings → Audit Log. Filter by category to investigate anomalies. Categories worth scheduled review:
user_prompt_jailbreak_flag,security_blocked_spl,rate_limited_prompt,daily_spend_cap_hit,vendor_tier2_elevation. - Configure the HEC audit forwarder to a separate destination — a different Splunk indexer, a SIEM, an S3 bucket with Object Lock, or any HEC-compatible sink. The acceptance modal recorded when the forwarder is left disabled is a useful compliance artifact.
- Pick the tier that matches your risk appetite. Tier 1 is the safest default (count + timing only). Tier 2 is more powerful but ships aggregated metadata to the vendor. Tier 0 (Ollama, planned) eliminates the vendor egress entirely.
- Set the daily spend cap to a number that bounds your monthly liability. The cap can be raised or removed at any time via Settings.
- Validate the SBOM against your organization’s vulnerability scanning. The
SBOM.jsonships at the root of the App tarball.
Further Reading¶
- OWASP LLM Top 10 Compliance — same controls organized by attack pattern
- Privacy Tiers — the type-system privacy boundary explained
- Settings — admin-controlled toggles and configuration
- Audit Log — viewer + filter conventions + tamper-evidence model
- Free-Form Prompts — system primer + tool catalog
- Templates-only Build Flag — the current LLM-disabled gating mechanism
- Google’s Secure AI Framework (SAIF) — the external reference framework this page maps against
Ended: AI Assistant
Developer Reference ↵
Clean Deployment Test Guide¶
Overview¶
This guide walks through a full clean-slate test of the SAP LogServ packages:
- Data TA (
splunk_ta_sap_logserv) – installed on the DS and pushed to HFs - LogServ App (
splunk_app_sap_logserv) – installed on the SH only
The test validates the complete workflow: install, DS automation, filter configuration, deployment push, data ingestion, and filter verification.
Prerequisites¶
- DS (Deployment Server) – also serves as SH/Indexer combo in this test topology
- HF-01, HF-02 – Heavy Forwarders configured as deployment clients
- Both HFs have AWS TA SQS-Based S3 inputs configured (disabled until Phase 6)
- UCC-built Data TA
.tar.gzpackage ready for installation - LogServ App
.tar.gzpackage ready for installation
Part 1: Clean Slate Setup¶
On the DS¶
# Switch to splunk user
sudo su - splunk

# Remove the Data TA
rm -rf /opt/splunk/etc/apps/splunk_ta_sap_logserv

# Remove the deployment-apps copy
rm -rf /opt/splunk/etc/deployment-apps/splunk_ta_sap_logserv

# Remove serverclass.conf files
rm -f /opt/splunk/etc/system/local/serverclass.conf
rm -f /opt/splunk/etc/apps/search/local/serverclass.conf

# Delete the server class via REST (ignore errors if it doesn't exist)
curl -sk -u admin:$SPLUNK_PASSWORD -X DELETE \
  "https://localhost:8089/services/deployment/server/serverclasses/SAP_LogServ_HeavyForwarders" 2>/dev/null

# Remove cached files
rm -rf /opt/splunk/var/run/splunk/dispatch/splunk_ta_sap_logserv* 2>/dev/null

# Exit splunk user
exit
If also testing the LogServ App:
sudo su - splunk
rm -rf /opt/splunk/etc/apps/splunk_app_sap_logserv
exit
Restart Splunk:
sudo systemctl restart Splunkd
On Each HF (HF-01 and HF-02)¶
sudo su - splunk
rm -rf /opt/splunk/etc/apps/splunk_ta_sap_logserv
exit
sudo systemctl restart Splunkd
Verify Clean Slate¶
On the DS:
sudo su - splunk
ls /opt/splunk/etc/apps/splunk_ta_sap_logserv 2>/dev/null
ls /opt/splunk/etc/deployment-apps/splunk_ta_sap_logserv 2>/dev/null
find /opt/splunk/etc -name "serverclass.conf" -path "*/local/*" 2>/dev/null | xargs cat 2>/dev/null
All should return nothing.
On each HF:
sudo su - splunk
ls /opt/splunk/etc/apps/splunk_ta_sap_logserv 2>/dev/null
Should return nothing.
Part 2: Deployment Test Phases¶
Phase 1: Install the Data TA on the DS¶
- Log into Splunk Web on the DS
- Go to Apps > Manage Apps > Install app from file
- Upload the Data TA
.tar.gzfile and install - Restart Splunk when prompted
Phase 2: Install the LogServ App on the SH¶
- Log into Splunk Web on the SH (same host as DS in combo topology)
- Go to Apps > Manage Apps > Install app from file
- Upload the LogServ App
.tar.gzfile and install - Restart Splunk when prompted
Phase 3: Configure Filters and Trigger DS Automation¶
- Go to the Data TA > Configuration > Filters tab
- Enable filtering, set include/exclude patterns and Days in Past
- Click Save
- After the page reloads, verify you see:
- The “Deployment Server Detected” banner
- The “Server Class Setup Required” notice
- The “Deploy to Forwarders” button
Phase 4: Verify DS Automation¶
Confirm the Data TA was copied to deployment-apps:
sudo su - splunk
ls /opt/splunk/etc/deployment-apps/splunk_ta_sap_logserv/
Confirm filter configs were mirrored:
cat /opt/splunk/etc/deployment-apps/splunk_ta_sap_logserv/local/transforms.conf
Confirm the server class was created:
find /opt/splunk/etc -name "serverclass.conf" -path "*/local/*" 2>/dev/null | xargs cat
You should see both stanzas:
[serverClass:SAP_LogServ_HeavyForwarders][serverClass:SAP_LogServ_HeavyForwarders:app:splunk_ta_sap_logserv]withrestartSplunkd = trueandstateOnClient = enabled
Phase 5: Configure the Server Class and Deploy¶
- Go to Settings > Forwarder Management
- Find
SAP_LogServ_HeavyForwarders - Click the three-dot menu > Edit agent assignment
- Add client targeting using HF IP addresses
- Save the agent assignment
- Return to the Filters tab – the “Server Class Setup Required” notice should be gone
- Click “Deploy to Forwarders” and confirm
Phase 6: Verify HFs Received the Data TA¶
Wait for HFs to phone home (default interval is 30-60 seconds), then verify:
# On each HF
sudo su - splunk
ls /opt/splunk/etc/apps/splunk_ta_sap_logserv/
cat /opt/splunk/etc/apps/splunk_ta_sap_logserv/local/transforms.conf
Confirm both HFs show as active clients in Settings > Forwarder Management under the server class.
Phase 7: Enable Ingestion and Test Filtering¶
- Enable the SQS-Based S3 inputs on both HFs (these are in the AWS TA, not the Data TA)
- Wait a few minutes for data to flow
- On the SH, search for incoming data:
`sap_logserv_idx_macro` | stats count by host, sourcetype
- Verify included log types are indexed:
`sap_logserv_idx_macro` | stats count by sourcetype
-
Verify excluded log types are NOT present (if you set any excludes)
-
Verify time filtering – search for events older than your Days in Past cutoff:
`sap_logserv_idx_macro` earliest=-30d latest=-10d | stats count
This should return 0 results if your Days in Past is less than 10.
Phase 8: Test Filter Update Round-Trip¶
- On the DS Filters tab, change a filter setting (e.g., add an exclude pattern) and Save
- Click “Deploy to Forwarders” again
- After phone-home, verify on both HFs that
local/transforms.confreflects the updated filter - Confirm the new filter is working as expected in search results
Part 3: Dashboard Verification¶
After data is flowing, verify the LogServ App dashboards:
- Navigate to the LogServ App in Splunk Web
- Check each dashboard loads with data:
- Data Pipeline Overview – shows host event counts and sourcetype distribution
- DNS Analytics – shows DNS query patterns (requires
isc:bind:querydata) - HANA Audit – shows HANA audit events (requires
sap:hana:auditdata) - Web Dispatcher Access – shows HTTP traffic (requires
sap:webdispatcher:accessdata) - Host Details – drill down from Overview by clicking a host row
Time range
Set the Global Time Range to All time or an appropriate window that covers your test data.
Cleanup Scripts¶
Automated cleanup scripts are available at cleanup_scripts/ in the project root:
| Script | Target | Purpose |
|---|---|---|
run_all_cleanups.sh |
Local (orchestrator) | SCPs and runs all cleanup scripts |
cleanup_heavy_forwarder.sh |
HF-01, HF-02 | Removes Data TA from HFs |
cleanup_deploy_server.sh |
DS | Removes Data TA from apps/ and deployment-apps/ |
cleanup_sh_idxr.sh |
SH/Indexer | Removes Data TA + LogServ App for clean reinstall |
All scripts use systemctl for Splunk management. Run from local Git Bash:
cd cleanup_scripts && bash run_all_cleanups.sh
Developer Reference: Architecture and Internals¶
Overview¶
This document covers the internal architecture of the SAP LogServ TA’s filtering and deployment automation system. It is intended for developers who need to maintain, extend, or test the TA.
The filtering system provides index-time event filtering via TRANSFORMS-based queue routing. It includes a UI built on UCC (Splunk Universal Configuration Console), custom REST handlers, deployment server automation, and background scripted inputs for daily maintenance and upgrade detection.
Architecture Summary¶
+-------------------------------------------------------+
|  Splunk Web (UCC Configuration UI)                    |
|  Configuration -> Filters tab                         |
|  + filter_settings_hook.js (Deploy button, banners)   |
+---------------------------+---------------------------+
                            | Save
                            v
+-------------------------------------------------------------+
|  splunk_ta_sap_logserv_rh_filter_settings.py (REST Handler) |
|  - Validates patterns                                       |
|  - Saves settings to settings conf                          |
|  - Generates local/transforms.conf + local/props.conf       |
|  - Mirrors to deployment-apps/ (if DS)                      |
|  - Creates server class (if DS, first time)                 |
|  - Reloads confs via REST API                               |
+---------------------------+---------------------------------+
                            |
              +-------------+-------------+
              v                           v
    +------------+          +--------------------+
    | Single     |          | Deployment Server  |
    | Instance   |          |                    |
    | (done)     |          | deployment-apps/   |
    +------------+          | + serverclass.conf |
                            | + Deploy button    |
                            +---------+----------+
                                      | Phone home
                                      v
                            +------------------+
                            | Heavy Forwarders |
                            | (receive TA +    |
                            |  filter configs) |
                            +------------------+
Source File Map¶
All source files live under the UCC package directory:
sap_logserv_package/splunk_ta_sap_logserv/
├── globalConfig.json                          # UCC UI definition (Filters tab)
├── additional_packaging.py                    # UCC build hook (web.conf expose)
└── package/
    ├── app.manifest                                # TA version and metadata
    ├── bin/
    │   ├── splunk_ta_sap_logserv_filter_utils.py        # Core library
    │   ├── splunk_ta_sap_logserv_rh_filter_settings.py  # REST handler: Filters tab
    │   ├── splunk_ta_sap_logserv_rh_deployment_push.py  # REST handler: Deploy button
    │   ├── logserv_filter_time_refresh.py               # Daily epoch cutoff refresh
    │   └── logserv_filter_upgrade_check.py              # Upgrade coverage check
    ├── default/
    │   ├── transforms.conf    # Sourcetype routing + @logserv_filter annotations
    │   ├── props.conf         # Sourcetype configs, TRANSFORMS chains
    │   ├── inputs.conf        # Scripted input schedules
    │   └── macros.conf        # Index name redirect macro
    ├── metadata/
    │   └── default.meta       # Default permissions and export settings
    └── appserver/static/js/build/custom/
        └── filter_settings_hook.js   # UCC hook (DS detection, Deploy button)
Key Components¶
Core Library¶
splunk_ta_sap_logserv_filter_utils.py
This is the central module. All other components import from it.
Key Functions¶
| Function | Purpose |
|---|---|
get_app_path() |
Determines the app installation path (checks SPLUNK_HOME, falls back to relative path) |
discover_supported_types(app_path) |
Scans default/transforms.conf for @logserv_filter annotations |
find_uncovered_types(supported, patterns) |
Compares supported types against user include patterns |
parse_comma_patterns(string) |
Splits comma-separated pattern string into list |
validate_patterns(patterns, field_name) |
Validates pattern syntax (dir/subdir format, valid characters) |
validate_single_pattern(pattern) |
Validates one pattern against rules |
fnmatch_patterns_to_combined_regex(patterns) |
Converts a list of fnmatch patterns into a single combined regex using alternation |
epoch_cutoff_from_days(days_in_past) |
Computes the epoch timestamp for midnight N days ago (UTC) |
generate_epoch_less_than_regex(cutoff_epoch) |
Generates a digit-by-digit regex matching epoch values less than the cutoff |
generate_transforms_stanzas(include, exclude, days) |
Generates filter transform stanzas with regex |
generate_props_filter_lines(include, exclude, days, enabled) |
Generates the TRANSFORMS-00-filter line |
write_local_conf(app_path, conf_type, content) |
Writes between marker comments in local conf files |
get_ta_version(app_path) |
Reads version from default/app.conf (falls back to app.manifest if not present) |
get_server_roles(session_key) |
Queries /services/server/info for roles |
is_deployment_server(session_key) |
Two-step DS detection (roles + client probe) |
get_deployment_apps_path() |
Returns the etc/deployment-apps/ path for the TA |
ensure_deployment_app_synced(app_path) |
Full app copy/upgrade to deployment-apps/ |
mirror_to_deployment_apps(app_path) |
Copies local/transforms.conf and local/props.conf |
ensure_serverclass(session_key) |
Creates server class + app mapping via REST + file |
Constants¶
| Constant | Value | Purpose |
|---|---|---|
APP_NAME |
splunk_ta_sap_logserv |
App directory name |
SERVERCLASS_NAME |
SAP_LogServ_HeavyForwarders |
Auto-created server class name |
SETTINGS_CONF |
splunk_ta_sap_logserv_settings |
UCC settings conf file |
FILTER_STANZA |
filter_settings |
Stanza name in settings conf |
SYSTEM_MESSAGE_NAME |
logserv_filter_upgrade_warning |
System message banner name for upgrade warnings |
ANNOTATION_PATTERN |
Compiled regex | Matches @logserv_filter: annotation comment lines |
VALID_SEGMENT_PATTERN |
Compiled regex | Validates characters in dir/subdir pattern segments |
FILTER_MARKER_START / FILTER_MARKER_END |
Marker comments | Delimit generated content in local conf files |
Filters Tab REST Handler¶
splunk_ta_sap_logserv_rh_filter_settings.py
UCC REST handler (extends AdminExternalHandler) registered in globalConfig.json. Handles the Save action:
- Validates patterns server-side (blocks save on failure via
admin.ArgValidationException) - Saves settings to
splunk_ta_sap_logserv_settings.conf(default UCC behavior) - Generates
local/transforms.confandlocal/props.confwith filter stanzas - Syncs and mirrors to deployment-apps if on a DS (full app copy/upgrade + filter configs)
- Creates server class if on a DS (first time only)
- Reloads confs via REST API (
/configs/conf-transforms/_reload,/configs/conf-props/_reload) - Checks for uncovered types and manages system message banner
Deploy Button REST Handler¶
splunk_ta_sap_logserv_rh_deployment_push.py
Persistent REST handler (PersistentServerConnectionApplication) registered in restmap.conf. Provides two endpoints:
- GET
/services/splunk_ta_sap_logserv/deployment_push— Returnsis_deployment_serverboolean and server class status (used by the JS hook to render the UI) - POST — Triggers deployment reload via
/services/deployment/server/config/_reload
Note
Persistent handlers do NOT get import_declare_test. They require explicit sys.path setup for the app’s bin/ and lib/ directories at the top of the file.
Note
Custom persistent endpoints require an [expose:] stanza in web.conf to be accessible through the Splunk Web proxy (port 8000). This is handled by additional_packaging.py during the UCC build.
UCC Hook¶
filter_settings_hook.js
JavaScript hook loaded by UCC on the Filters tab. Lifecycle methods:
onCreate/onRender/onEditLoad— CallscheckDeploymentServer()to GET the deployment push endpoint. If DS detected, injects the deploy banner, server class guidance notices, and Deploy button into the DOMonSaveSuccess— Triggerswindow.location.reload()after 500ms to reflect server-side changes
Daily Time Refresh¶
logserv_filter_time_refresh.py
Scripted input (runs every 86400 seconds / once per day):
- Reads filter settings from the settings conf via REST
- Regenerates
local/transforms.confandlocal/props.confwith updated epoch cutoff regex - Mirrors to deployment-apps if on a DS
- Reloads confs
Deployment client guard: If the instance is a deployment client (HF) but NOT a deployment server, the script skips execution entirely. This prevents HFs from overwriting filter configs pushed by the DS.
Upgrade Coverage Check¶
logserv_filter_upgrade_check.py
Scripted input (runs every 600 seconds / 10 minutes):
- Compares current TA version against last-checked version (persisted in state file)
- On version change, discovers supported types from
@logserv_filterannotations - Compares against user’s include patterns
- Creates a Splunk system message banner if uncovered types are found
Performance
The version check is ~2ms on unchanged runs. Full comparison only runs once per version change.
How Filtering Works Technically¶
Filter Chain¶
All filtering happens via a single TRANSFORMS-00-filter line in local/props.conf under the [sap_logserv_logs] stanza. The 00 prefix ensures filters run before any sourcetype routing transforms (01–99).
The filter chain is evaluated left to right:
logserv_filter_include_drop— Drops ALL events (sends tonullQueue)logserv_filter_include_allow— Rescues events matching include patterns (sends back toindexQueue)logserv_filter_time_drop— Drops events with old timestamps (sends tonullQueue)logserv_filter_exclude— Drops events matching exclude patterns (sends tonullQueue)
This “deny-all, then allow” approach ensures only explicitly included events pass through.
Include/Exclude Regex Generation¶
User-facing fnmatch patterns (e.g., linux/*) are converted to Splunk-compatible regex that matches against the raw NDJSON event data. The include_allow regex uses lookahead assertions to match clz_dir and clz_subdir fields:
^(?=.*"clz_dir"\s*:\s*"linux")(?=.*"clz_subdir"\s*:\s*".+")
Multiple include patterns are OR’d together with |.
Time Filter Regex¶
The time filter matches epoch timestamps in the raw JSON "_time" field. Since TRANSFORMS cannot use dynamic expressions (unlike INGEST_EVAL which is unavailable on Splunk Cloud), the cutoff is a pre-computed regex that matches epoch values less than the cutoff. This regex must be refreshed daily to maintain accuracy.
Failure mode
If the daily refresh doesn’t run, the cutoff becomes one day older, filtering slightly more data. This is the safer direction.
Why TRANSFORMS Instead of INGEST_EVAL¶
INGEST_EVAL is the preferred modern approach for index-time filtering, but it is unavailable on Splunk Cloud (heavy forwarders managed by Splunk Cloud don’t support it). TRANSFORMS-based filtering works on all deployment architectures including Splunk Cloud with on-premises Heavy Forwarders.
Deployment Server Automation¶
DS Detection¶
Two-step detection in is_deployment_server():
- Fast path — Check
server_rolesfrom/services/server/infofordeployment_server - Fallback — If role is absent, query
/services/deployment/server/clientsto check for connected deployment clients. Returns true only if at least one client is connected
Why the fallback exists
Splunk drops the deployment_server role when no serverclass.conf exists. The /services/deployment/server/config endpoint cannot be used as a fallback because it returns HTTP 200 on ALL Splunk Enterprise instances (including HFs), causing false positives.
Server Class Creation¶
ensure_serverclass() creates SAP_LogServ_HeavyForwarders in three steps:
-
REST API create — POST to
/services/deployment/server/serverclasseswithnameparameter to create the server classThe
disabledparameter is NOT supported during creation (Splunk returns an error). -
REST API disable — Separate POST to
/services/deployment/server/serverclasses/SAP_LogServ_HeavyForwarderswithdisabled=trueto disable the server class. This ensures no deployment occurs until the admin configures client targeting and enables the server class in Forwarder Management. -
File-based app mapping — After REST creates and disables the server class, the function locates the resulting
serverclass.conf(which Splunk may write tosystem/local/orapps/search/local/) and appends the app mapping stanza:
[serverClass:SAP_LogServ_HeavyForwarders:app:splunk_ta_sap_logserv]
restartSplunkd = true
stateOnClient = enabled
Note
The app mapping cannot be created via REST API — the URL path format serverclasses/{name}/app:{appname} returns HTTP 404.
Deployment Client Guard¶
The logserv_filter_time_refresh.py scripted input checks whether the instance is a deployment client (but not a DS). If so, it skips execution to prevent overwriting filter configs that were pushed by the DS. Without this guard, the time refresh script would read the HF’s empty local settings, regenerate configs with only a time filter, and overwrite the complete filter chain.
Adding Support for New Sourcetypes¶
Step 1: Add a Routing Transform¶
Add the @logserv_filter annotation on the line immediately above the stanza header in default/transforms.conf:
# @logserv_filter: newdir/newsubdir
[set_srctype_for_new_logtype]
REGEX = "clz_subdir":"newsubdir"
FORMAT = sourcetype::sap:newlogtype
DEST_KEY = MetaData:Sourcetype
The annotation is critical. It declares which clz_dir/clz_subdir values the transform handles. Without it, the upgrade check cannot detect that a new log type is supported, and users won’t be notified.
Multiple values can be comma-separated:
# @logserv_filter: newdir/type_a, newdir/type_b, newdir/type_c
[set_srctype_for_new_dir]
REGEX = "clz_subdir":"(type_a|type_b|type_c)"
FORMAT = sourcetype::sap:newdir:logs
DEST_KEY = MetaData:Sourcetype
When the same clz_subdir value exists under multiple clz_dir paths (e.g., audit appears under both abap/ and scc/), use a compound lookahead regex to match both fields and avoid routing collisions:
# @logserv_filter: scc/audit
[set_srctype_scc_audit]
REGEX = (?=.*"clz_dir":"scc")(?=.*"clz_subdir":"audit")
FORMAT = sourcetype::sap:scc:audit
DEST_KEY = MetaData:Sourcetype
When to use compound lookahead: Check if the clz_subdir you are adding already exists in another clz_dir path. If it does, both the existing and new transforms must use compound lookahead. Current collision-prone values include audit (abap, scc), sapstartsrv (abap, sap), and tracelogs (hana, scc).
Step 2: Add to TRANSFORMS Chain¶
Add your new transform to the appropriate TRANSFORMS-* line in the [sap_logserv_logs] stanza of default/props.conf:
[sap_logserv_logs]
...
TRANSFORMS-07-srctype_for_newdir = set_srctype_for_new_logtype
Use a number between 01 and 98 for the TRANSFORMS prefix. 00 is reserved for filters and 99 is reserved for set_raw_only.
Step 3: Add Sourcetype Configuration¶
If the new sourcetype needs field extractions, calculated fields, or CIM field aliases, add a [sap:newlogtype] stanza to default/props.conf.
Step 4: Bump the Version¶
Update the version in package/app.manifest (and globalConfig.json if applicable). This triggers the upgrade check to compare the new annotations against existing user include patterns.
What Happens on Upgrade
- The
logserv_filter_upgrade_check.pyscripted input detects the version change within 10 minutes - It scans the updated
default/transforms.conffor@logserv_filterannotations - If the user’s include patterns don’t cover the new log types, a system message banner appears across all Splunk Web pages
- The user updates their include patterns (or uses
*/*) and the banner clears
Testing Environments¶
Environment 1: Single Instance (Standalone)¶
Setup: One Splunk Enterprise instance acting as Search Head, Indexer, and data receiver.
What to test
- Filter save generates correct
local/transforms.confandlocal/props.conf - Conf reload works without restart
- Include, exclude, and time filters work correctly in search results
- Disabling filtering clears the generated conf files
- Pattern validation blocks invalid input
- No deployment server UI elements appear (no banner, no deploy button)
Environment 2: Deployment Server + Heavy Forwarders¶
Setup: Three instances minimum: DS (can be combined with SH/Indexer), HF-01 (deployment client), HF-02 (deployment client).
What to test
- DS detection works (banner and deploy button appear)
- Filter save triggers full app copy to
deployment-apps/ - Filter configs are mirrored to
deployment-apps/local/ - Server class
SAP_LogServ_HeavyForwardersis auto-created with app mapping - Client targeting (IP-based) matches HFs correctly
- Deploy button triggers reload and HFs receive the TA
- Filter update round-trip: change on DS → deploy → verify on HFs
- Time refresh script skips on HFs (deployment client guard)
- Time refresh script runs correctly on DS and mirrors updated configs
Environment 3: Splunk Cloud + On-Premises Heavy Forwarders¶
Setup: Splunk Cloud instance (Search Head / Indexer), separate on-premises DS, on-premises HFs configured as deployment clients.
What to test
- Same as Environment 2, but additionally verify:
- The TA is installed on the Splunk Cloud instance for dashboards and search-time knowledge objects, but filtering is NOT configured there
- Filter configuration and TA distribution to HFs are managed entirely from the on-premises DS
- Filtering works at the HF level before data reaches Splunk Cloud
- No INGEST_EVAL dependency (TRANSFORMS-only filtering)
Environment 4: Fresh DS with No Prior Server Classes¶
Setup: DS with deployment clients connected but no serverclass.conf exists.
What to test
- DS detection works via the fallback (connected clients check)
ensure_serverclass()createsserverclass.conffrom scratch- The
deployment_serverrole activates after server class creation - Full deployment workflow completes successfully
Known Gotchas and Technical Notes¶
Local Imports in Utility Functions¶
Functions in splunk_ta_sap_logserv_filter_utils.py use local imports (inside the function body) for Splunk-specific modules like splunk.rest and json. This is intentional — these modules are unavailable during the UCC build step, so importing them at the module level would break the build.
The critical detail is that local imports are scoped to the function they are declared in. They do NOT carry into sibling functions. Each function that needs splunk.rest or json must import them independently. For example, both get_server_roles() and is_deployment_server() need their own local import splunk.rest as rest and import json statements — the imports inside get_server_roles() are not visible to is_deployment_server() even though one calls the other.
Forgetting a local import inside a function that has a bare except Exception: pass block is particularly dangerous because the resulting NameError is silently swallowed, causing the function to return a default value without any log output.
Persistent Handler sys.path¶
Persistent REST handlers (splunk_ta_sap_logserv_rh_deployment_push.py) do NOT get import_declare_test from UCC. They require explicit sys.path setup at the top of the file to import from the app’s bin/ and lib/ directories. Without this, the handler returns 500 errors from splunkd.
web.conf Expose Stanza¶
Custom persistent endpoints are not accessible through the Splunk Web proxy (port 8000) by default. They require an [expose:] stanza in web.conf. This is injected by additional_packaging.py during the UCC build:
[expose:splunk_ta_sap_logserv_deployment_push]
pattern = splunk_ta_sap_logserv/deployment_push
methods = POST, GET
Server Class REST API Limitations¶
- The
disabledparameter is NOT accepted during server class creation. Create first, then POST to the specific server class URL to disable - App mappings (
:app:appnamestanzas) CANNOT be created via REST API. The URL format returns 404. Use file-based append instead - Splunk may write
serverclass.confto different locations (system/local/orapps/search/local/). The code searches multiple locations
Deployment Client Config Overwrite¶
Without the deployment client guard in logserv_filter_time_refresh.py, HFs would regenerate filter configs from their own (empty) local settings on the daily time refresh run. This overwrites the complete filter chain pushed by the DS with only a time filter. The guard checks for the deployment_client role and skips execution if found.
TRANSFORMS-00-filter Ordering¶
The filter TRANSFORMS line MUST use prefix 00 to ensure it runs before sourcetype routing (01–99). If filters ran after routing, events would already have their sourcetype set but would then be dropped, wasting processing.
Marker Comments¶
Generated filter content in local/transforms.conf and local/props.conf is wrapped in marker comments:
### BEGIN LOGSERV FILTER CONFIG - DO NOT EDIT MANUALLY ###
...
### END LOGSERV FILTER CONFIG ###
The write_local_conf() function replaces content between these markers (or appends them if not present). Manual customizations outside the markers are preserved.
DS Role Disappears Without Server Classes¶
Splunk removes the deployment_server role from server_roles when no server class is defined in any serverclass.conf. The is_deployment_server() fallback handles this by checking for connected deployment clients via the /services/deployment/server/clients endpoint. This endpoint returns 0 clients on HFs (no false positives) and returns connected clients on a real DS even without any server classes.
The /services/deployment/server/config endpoint CANNOT be used as a fallback because it returns HTTP 200 on ALL Splunk Enterprise instances, including HFs.
AI Assistant — Implementation Reference¶
This document covers the implementation details of the LogServ App’s AI Assistant subsystem — file paths, type-system patterns, build mechanics, audit-event schemas, and extension recipes. Intended for engineers who need to maintain or extend the AI Assistant code.
For the customer-facing documentation, see the AI Assistant section. The customer-facing pages cover what users see and how to use the feature; this page covers how it’s built.
File Path Map¶
The AI Assistant subsystem lives in the LogServ App’s React workspace at packages/log-serv-app/src/main/webapp/pages/home/. Key files:
| Path | Purpose |
|---|---|
hooks/useAIAssistant.ts |
The orchestrator hook. Contains runCannedPrompt, sendUserMessage, tier1Summary, tier2Summary, SYSTEM_PRIMER_TIER1, SYSTEM_PRIMER_TIER2, POWER_MODE_RULE_SUFFIX, SAVED_SEARCH_SPL, SAVED_SEARCH_DASHBOARDS, SAVED_SEARCH_CHART_HINTS, resolveNextSteps, wrapAsToolResultData, sanitizeAggregateValue. |
state/AIAssistantProvider.tsx |
React context + reducer. DisplayMessage shape including toolResult.spl / earliest / latest for drill-down chip URL pre-resolution. |
components/ai/types/Hidden.ts |
The Hidden<T> and Visible<T> brand-type definitions, markHidden, unwrapHidden, markVisible, unwrapVisible, sanitize. |
components/ai/mcp/MCPClient.ts |
MCP client wrapper. Constructs requests, handles cookie + bearer auth, parses responses into MCPToolResult. |
components/ai/providers/ |
Per-vendor provider implementations: AnthropicProvider.ts, OpenAIProvider.ts, AzureOpenAIProvider.ts, BedrockProvider.ts, plus shared credentials.ts, sseUtils.ts, anthropicEventTranslator.ts. |
components/ai/chat/AIAssistant.tsx |
Top-level chat panel. Builds the citationLookup: Map<string, { toolUseId; splUrl? }> from toolResultsInOrder. |
components/ai/chat/ChatMessage.tsx |
Renders user / assistant_text / tool_call / tool_result / system_notice / guidance messages. Contains TEXT_PATTERN regex for citation + severity + bold parsing. |
components/ai/chat/ToolResultPanel.tsx |
Renders a single tool result as table / chart / KPI / pie. Contains the actions-slot rendering for ↗ Dashboard / ↗ Run SPL / Clear chips. |
components/ai/chat/ChatInput.tsx |
Chat input toolbar. ✦ Power toggle visibility gating + Templates-only gating. |
components/ai/chat/PrivacyBanner.tsx |
Tier banner + model picker. Templates-only hides the picker. |
components/ai/audit/AuditWriter.ts |
Browser-side audit batch + flush. Dual-writes to local logserv_ai_assistant_audit index AND optional HEC forwarder. |
components/ai/audit/auditTypes.ts |
All 12 audit-event TypeScript types. |
dashboards/AIAssistantSettings.tsx |
The 4-tab Settings page. Templates-only hides the Provider Credentials tab. |
utils/splGuard.ts |
SPL static-analysis guard. Blocks collect/outputlookup/outputcsv/delete/sendalert/sendemail/script/run/tscollect for AI-authored ad-hoc SPL. |
utils/jailbreakPatterns.ts |
User-prompt jailbreak-pattern detection. FNV-1a hash + matched-groups + char-class fingerprint capture. |
utils/piiRedaction.ts |
Tier 2 PII redaction. FNV-1a 32-bit hash → 7-char hex tag, sync. Stable per-value across the run. |
utils/rateLimit.ts |
Per-user rolling-1-hour rate limit. Records rate_limited_prompt audit event on hit. |
utils/dailySpend.ts |
Cumulative-cost daily spend cap. Records daily_spend_cap_hit on overflow. |
utils/vendorCost.ts |
Per-vendor pricing table for USD cost estimate. |
utils/drilldownUrls.ts |
buildDashboardUrl, buildHostDetailsUrl, buildSplunkSearchUrl, openInNewTab, splQuote, sourcetypeToDashboardSlug. |
buildFlags.ts |
Build-time feature flags. Currently exports TEMPLATES_ONLY: boolean. |
utils/aiConfigApi.ts |
Read / write config from default/ai_assistant_settings.conf via REST. |
utils/passwordsApi.ts |
Read / write credentials from Splunk’s encrypted password store via services/storage/passwords. |
utils/telemetryConfApi.ts |
Splunk-pattern legal-acknowledgement opt-in tracking via default/ai_assistant_acks.conf. |
state/dashboardRefreshPersistence.ts |
KV Store CRUD for the per-dashboard auto-refresh picker. |
default/data/mcp/logserv_intent_map.json |
The 48-prompt catalog. |
default/savedsearches.conf |
The 48 saved searches that intent-map prompts dispatch. |
default/ai_assistant_settings.conf |
Org-wide AI Assistant config defaults. |
default/ai_assistant_acks.conf |
Splunk-pattern legal-acknowledgement opt-in version + acknowledgement timestamps. |
The Hidden<T> / Visible<T> Brand Type Pattern¶
The privacy invariant — “no event data from your Splunk instance is ever transmitted to any AI vendor” — is mechanically enforced via TypeScript brand types in components/ai/types/Hidden.ts:
declare const HIDDEN_BRAND: unique symbol;
declare const VISIBLE_BRAND: unique symbol;

export type Hidden<T> = T & { readonly [HIDDEN_BRAND]: true };
export type Visible<T> = T & { readonly [VISIBLE_BRAND]: true };

export const markHidden = <T>(v: T): Hidden<T> => v as Hidden<T>;
export const unwrapHidden = <T>(v: Hidden<T>): T => v;

export const markVisible = <T>(v: T): Visible<T> => v as Visible<T>;
export const unwrapVisible = <T>(v: Visible<T>): T => v;

export const sanitize = <T, S>(
    hidden: Hidden<T>,
    summarizer: (v: T) => S,
): Visible<S> => markVisible(summarizer(unwrapHidden(hidden)));
Invariant: the only way to obtain a Visible<S> from a Hidden<T> is via sanitize(hidden, summarizer). The compiler refuses any other coercion path. The summarizer receives the unwrapped data and returns a non-data summary string; the orchestrator’s call site picks the summarizer based on the active privacy tier (tier1Summary for Tier 1, tier2Summary for Tier 2).
Where the chokepoint runs: useAIAssistant.ts sendUserMessage → tool dispatch → MCPClient returns Hidden<MCPToolResult> → sanitize(toolResult, tier === 2 ? tier2Summary : tier1Summary) → resulting Visible<string> is appended to the outbound vendor message buffer.
Where the type system enforces: every outbound vendor message is built from Visible<Message>[]. Anywhere code constructs an outbound message, the types refuse a Hidden<T> value. There is no as any cast; bypassing requires modifying the brand-type code itself, which is reviewed.
Augmenting a Visible<T>-branded string: direct concatenation produces a TS error since the brand type can’t widen back automatically. The pattern is unwrapVisible() + new string + markVisible(). The Power Mode primer augmentation uses this pattern.
The Build Flag Pattern (TEMPLATES_ONLY and Future Flags)¶
Why compile-time, not runtime¶
Compile-time flags are baked into the bundle at build time and CANNOT be changed post-deploy. The runtime alternative — an admin toggle that disables a code path — would let any admin flip it on. For deployments where a code path is intentionally not available (e.g., the LLM dispatch path under review), a compile-time variant is the right shape: the bundle has no code path that reaches the disabled feature, and there’s no runtime setting that could enable one.
Single source of truth¶
buildFlags.ts is the canonical module for compile-time flags — it exports each flag as a typed boolean derived from a build-time substitution. Use sites import the flag from buildFlags.ts rather than reading the underlying env var directly. After minification + dead-code elimination, unreachable branches are eliminated from the bundle that has the flag off (verified via grep on the minified output for the absence of the underlying env-var token).
The pattern composes: a build can carry multiple flags simultaneously, and DCE ensures each variant is lean.
Defense-in-depth runtime guards¶
Even with compile-time gating, defense in depth pairs the UI gating with a runtime guard at the LLM dispatch entry point. When TEMPLATES_ONLY is true, the guard short-circuits the dispatch with a system notice directing the user to the prompt browser instead. The UI gating is the primary defense; the function-level guard catches any future code path that might bypass the disabled chat input (keyboard shortcut, programmatic dispatch, etc.).
The Chat Citation Parser¶
components/ai/chat/ChatMessage.tsx parses inline markers in assistant_text + guidance messages. The regex:
const TEXT_PATTERN = /\[(?:→|->)\s*([a-zA-Z0-9_:.\-]+)\]|\[severity:(critical|high|medium|low)\]|\*\*([^*]+)\*\*/g;
Three numbered capture groups disambiguate which alternative fired:
| Group | Pattern | Renders as |
|---|---|---|
| 1 | [→ logserv_xxx] or [-> logserv_xxx] |
Clickable scroll-to-tile span via onJumpToResult(toolUseId); auto-appends sibling ↗ Dashboard chip(s) + ↗ Run SPL chip |
| 2 | [severity:critical|high|medium|low] |
Glossy colored dot via <SeverityDot $level={level} /> |
| 3 | **bold text** |
Bold-stripped: the ** markers are dropped and the inner text is re-parsed recursively for nested citation / severity markers (build 174 fix) |
The recursive-parse fix (build 174): when the AI drifts and emits **[severity:medium]** (markdown bold wrapping the severity marker), the bold alternative matches first and would render the inner text as plain string, losing the severity dot. The fix recursively calls renderTextWithCitations() on the bold inner content. Save/restore of TEXT_PATTERN.lastIndex around the recursive call is required because the regex is module-scoped + /g-stateful — not saving would corrupt the outer iteration.
Why module-scoped state: lastIndex reset at function entry handles the common case. For recursive parses, save/restore around the call is required.
The MCP Tool Definitions Sent on Every Free-Form Request¶
The AI sees these two tool definitions on every free-form request. The schemas are sent in the system primer’s tool-block:
splunk_run_saved_search¶
{
    "name": "splunk_run_saved_search",
    "description": "Dispatch a saved search from the LogServ App's catalog.",
    "input_schema": {
        "type": "object",
        "properties": {
            "name": {"type": "string", "description": "Saved-search name from the catalog (e.g., logserv_hana_failed_auth)"},
            "earliest_time": {"type": "string", "description": "Splunk earliest token (-24h, -7d, etc.)"},
            "latest_time": {"type": "string", "description": "Splunk latest token (now, etc.)"},
            "render_hint": {"type": "string", "enum": ["table", "timechart", "kpi", "pie"]},
            "top_n": {"type": "integer", "minimum": 1, "maximum": 50, "description": "Width of categorical aggregates the AI receives in Tier 2 summary. Default 10."}
        },
        "required": ["name"]
    }
}
splunk_run_query¶
Same schema shape but accepts a query (SPL string) instead of name. SPL is run through utils/splGuard.ts before dispatch to block write/delete/alert operators.
The SPL Static-Analysis Guard¶
utils/splGuard.ts exposes analyzeSpl(spl: string): { blocked: boolean; reason?: string; operator?: string }. Blocked operators:
const BLOCKED_OPERATORS = [
    'collect', 'outputlookup', 'outputcsv',
    'delete', 'sendalert', 'sendemail',
    'script', 'run', 'tscollect',
];
Detection runs after lowercasing + stripping leading whitespace per pipe segment. Quoted strings are stripped before matching to avoid false positives on legitimate SPL where these tokens appear inside string literals.
Audit on block: security_blocked_spl event with spl (truncated to 1000 chars) + operator field. The synthetic error tool_result lets the AI see the failure and recover by writing a different query.
Scope: only AI-authored splunk_run_query SPL. Pre-authored saved searches dispatched via splunk_run_saved_search are NOT subject to the guard — their SPL is reviewed at build time.
Audit Event Schemas¶
All audit events extend a BaseAuditEvent shape:
interface BaseAuditEvent {
    category: string;       // discriminator
    timestamp: string;      // ISO-8601 UTC
    user: string;           // Splunk username
    sessionId: string;      // Per-tab session UUID
    seq: number;            // Monotonic per-session sequence
}
Per-category extras:
| Category | Extra fields |
|---|---|
local_only (LocalOnlyEvent) |
promptId: string, spl: string, rowCount: number, executionMs: number, ok: boolean |
vendor_tier1 (VendorTier1Event) |
provider, model, inputTokens, outputTokens, vendorCostEstimateUsd, outboundBytes, promptLength, turnCount, powerMode?: boolean |
vendor_tier2 (extends Tier1Event) |
aggregateKind: string, tier2RedactionsApplied: number |
vendor_tier2_elevation |
previousTier, newTier |
security_blocked_spl (SecurityBlockedSplEvent) |
spl (truncated to 1000 chars), operator: string |
rate_limited_prompt (RateLimitedPromptEvent) |
cap, attemptedCount, windowSeconds |
user_prompt_jailbreak_flag (UserPromptJailbreakFlagEvent) |
promptHash (FNV-1a 32-bit hex), promptLength, matchedGroups: string[], charClassFingerprint: string |
session_tool_cap_hit (SessionToolCapHitEvent) |
cap, attemptedCount, toolName |
daily_spend_cap_hit (DailySpendCapHitEvent) |
cap, currentSpend, attemptedSpend |
audit_forwarder_failure |
destinationUrl (sanitized — query strings stripped), reason, batchSize |
forwarder_disabled_acceptance / ai_assistant_enable_acceptance |
host (Splunk-stamped IP), tcVersion, optInChoice, disclaimerHash |
All schemas live at components/ai/audit/auditTypes.ts.
Splunk reserved-field gotcha¶
The category field on these events is a Splunk reserved name. The viewer’s SPL uses | eval category=json_extract(_raw, "category") after spath because spath does NOT overwrite reserved fields. Replicate this pattern in custom queries.
Adding a New Predefined Prompt¶
- Edit
default/data/mcp/logserv_intent_map.json— add a new entry to thepromptsarray. Required fields:promptId,savedSearch,label,description,spl,renderHint. Optional:chartHint,chartPalette,dashboard,interpretation,nextSteps. - Edit
default/savedsearches.conf— add a stanza with the same name as the prompt’ssavedSearchfield. The SPL must match byte-for-byte. - Bump the intent map’s top-level
versionfield. - Run
yarn intentMap.consistency-test(or equivalent in your CI) — the test asserts byte-equality between the intent map’s SPL and savedsearches.conf for every prompt. - Pre-deploy SPL dry-run. Dispatch the new prompt’s SPL via
services/search/jobs/oneshotagainst live data:Confirm the result has rows with the expected fields. ~50% of new prompts fail static review with field-extraction issues that only surface against live data.curl -sk -u admin:<pw> --data-urlencode "search=<your spl>" \ -d output_mode=json -d earliest_time=-30d -d latest_time=now \ https://localhost:8089/services/search/jobs/oneshot - Bump UI App
[install] buildinapp.confto bust Splunk Web’s static-asset cache.
Intent map JSON schema¶
interface IntentMapPrompt {
    promptId: string;
    savedSearch: string;
    label: string;
    description: string;
    spl: string;
    renderHint: 'table' | 'timechart' | 'kpi' | 'pie';
    chartHint?: 'timechart' | 'kpi' | 'pie';
    chartPalette?: 'volume' | 'errors' | 'errors-2' | 'errors-3' | 'auth' | 'status' | 'categorical' | 'neutral';
    dashboard?: string | string[];
    interpretation?: string;
    nextSteps?: Array<string | { text: string; savedSearch?: string; spl?: string }>;
}
Splunk risky-command safeguard¶
Splunk Web’s Search app has a safety modal on these commands: map, runshell, script, delete, crawl, tscollect, loadjob, outputlookup, outputcsv, sendalert, sendemail. URLs to /app/search/search?q=... containing one of these triggers the modal.
Scan all SPL — including nextSteps.spl deep-dive strings — for risky commands before shipping. Rewrite map-style cross-row dispatches to first-class subsearch syntax: [ search ... | top 1 X | fields X ].
Adding a New Audit Event Category¶
- Edit
components/ai/audit/auditTypes.ts— add a new TypeScript interface extendingBaseAuditEventwith the category-specific fields. Add the type to theAuditEventunion. - Add the new category id to the discriminator string-literal type.
- Find the call site that should emit the event. Construct the event object and call
ctx.actions.recordAudit(event). - Edit
components/AuditLogViewer.tsx— add the new category id toAUDIT_CATEGORIES(the filter chip set) and toCATEGORY_GRADIENTS(the chip gradient lookup). - Bump the UI App build.
The audit writer (components/ai/audit/AuditWriter.ts) sends events to BOTH the local logserv_ai_assistant_audit index AND the optional HEC forwarder. No code change needed at the writer layer for new categories.
System Primer Architecture¶
Two primer variants ship: SYSTEM_PRIMER_TIER1 and SYSTEM_PRIMER_TIER2. Both live in hooks/useAIAssistant.ts as exported constants. They share most of their content; the differences:
- Tier 1 primer instructs the AI that summaries it receives are count + execution-time only, and to write SHAPE-aware narrative (“X rows returned for the search’s rolling window”) rather than inventing concrete values.
- Tier 2 primer informs the AI that summaries include aggregated metadata (per-column cardinality, top-N values + counts, numeric stats, time range), and instructs it to ground every claim in the actual values from the aggregates. PII redaction tagging is also explained.
Both primers include:
- The TOOL_RESULT_DATA boundary block (
<TOOL_RESULT_DATA>...</TOOL_RESULT_DATA>sentinels) - The TIME-WINDOW REASONING block (build 171)
- The canonical saved-search catalog (48 entries)
- The LogServ data model (sourcetypes + key fields, for ad-hoc SPL)
- The decision rule for
splunk_run_saved_searchvssplunk_run_query - The SYNTHESIS RULES section: lettered finding format, severity-dot rendering, citation format, etc.
Power Mode augmentation: when the user has Power Mode on, POWER_MODE_RULE_SUFFIX is appended to the primer at dispatch time via unwrapVisible(content) + suffix then markVisible() (the brand type can’t widen back automatically).
Pre-Resolving Drill-Down URLs at the Orchestrator Layer¶
The drill-down chip URLs (↗ Dashboard, ↗ Run SPL) are pre-resolved at the AIAssistant.tsx layer, where each tool result’s exact dispatch window is known. The resolved URLs are stored on the citationLookup Map for the chat parser to consume:
const citationLookup: Map<string, { toolUseId: string; splUrl?: string }> = new Map();
toolResultsInOrder.forEach((tr) => {
    if (tr.displayName) {
        const splUrl = tr.spl
            ? buildSplunkSearchUrl(tr.spl, tr.earliest, tr.latest)
            : undefined;
        citationLookup.set(tr.displayName, { toolUseId: tr.toolUseId, splUrl });
    }
});
The chat-side renderer (ChatMessage.tsx) is dumb — it just renders <a href={entry.splUrl}> when the lookup carries a URL. This avoids duplicating SPL-lookup logic at every consumer.
Same pattern applies to the dashboard chips (build 156): the dashboardLinks are resolved once via resolveDashboardLinks(slugs) at the orchestrator and consumed as {slug, name, url} triples.
Legal Acknowledgement Modal Trigger Logic¶
Two compile-time legal modals gate Settings save flows:
- Enable Acceptance Modal — gates
enabled = truesaves. - Forwarder Disabled Acceptance Modal — gates
audit_forwarder_enabled = falsesaves.
Both follow Splunk’s splunk_instrumentation optInVersion framework with one extension. The trigger logic is:
isEnableTcPending = (
    (saved.enabled === false && draft.enabled === true)  // deliberate toggle-on
    OR
    (currentOptInVersion > userAcknowledgedVersion)       // version bumped
)
The pure optInVersion-only path is what Splunk’s stock telemetry uses (acknowledge once per version, durable until bump). We added the deliberate-toggle-transition trigger because re-enabling AI Assistant after a disable is a deliberate user action that warrants re-acknowledgement of the legal posture each time.
telemetryConfApi.ts exposes readTcAcknowledgement(stanza) / writeTcAcknowledgement(stanza, choice, version) parameterized by stanza name. The two modal stanzas are constants: STANZA_FORWARDER_TC and STANZA_ENABLE_TC.
The conf-writer coerces yes/no to '1'/'0'. The audit event preserves the literal string in _raw, so the audit event is the canonical record while the conf is the state marker.
Why Primer Rules Beat Other Fixes (TIME-WINDOW REASONING)¶
Three alternative fixes were considered before settling on primer rules for the time-window reasoning behavior:
- Surface the dispatch window in Tier 2 metadata even for non-
_timeresults. Would let the AI see the window directly without reasoning about it. Higher engineering effort (~4-6 hours) than primer rules; deferred unless rules alone don’t move the needle. - Re-order the regex alternatives so severity matches first. Doesn’t help: bold wraps around the severity, so even if severity tries first, it can’t match inside an unmatched bold span.
- Update the primer to forbid bold around severity markers. Helps for future prompts but doesn’t repair existing UI. Parser must be tolerant either way.
Primer rules were the cheapest test of “is this a primer-rules issue?” and it worked: same prompt, same data, dramatically better self-correction behavior in one turn instead of needing a follow-up prompt to re-rank cumulative-noise findings.
This is the canonical pattern: when the AI has the data but isn’t using it correctly, primer rules are the cheapest first attempt. When the AI doesn’t have the data, metadata expansion is the next step.
Splunk Static-Asset Cache Busting¶
Splunk Web caches the React bundle’s asset URL under a hash that includes the [install] build integer in app.conf. Re-deploying the same build number with new bytes serves stale assets even after Splunkd restart. Always bump the build number for any meaningful code change.
The 3-part SemVer in [id] version is independent and only changes on user-facing version bumps. AppInspect’s pretrained / Splunkbase precert rules require 3-part SemVer, so directory naming uses a 4-part vMAJOR.MINOR.PATCH.SNAPSHOT form for snapshot-tracking purposes only — the app.conf [id] version stays 3-part.
Live UI Refresh on Settings Save¶
When the admin saves a config change in the General tab that affects what users see (master enabled toggle, mcp_required, power_user_roles, etc.), the React app re-runs loadAIAssistantConfig() immediately and re-applies the new config to the running session. No page reload required.
Implementation: App.tsx accepts an onConfigSaved callback that re-loads config from the storage REST API. The callback is threaded App → AppShell → AIAssistantSettings → GeneralPanel, called after writeAIConfig succeeds. Affected props are recomputed on the next React render and the dependent UI re-renders accordingly (e.g., the ✦ AI Assistant button in the top-right nav appears / disappears).