DNS Analytics
Why This Dashboard Matters
The DNS Analytics dashboard transforms DNS query data into a security detection tool. DNS is used by virtually all network communications and is often exploited by attackers for command-and-control (C2) beaconing, data exfiltration via DNS tunneling, and reconnaissance. Because DNS traffic is rarely inspected by traditional security tools, this dashboard fills a critical visibility gap in SAP infrastructure security.
Panels
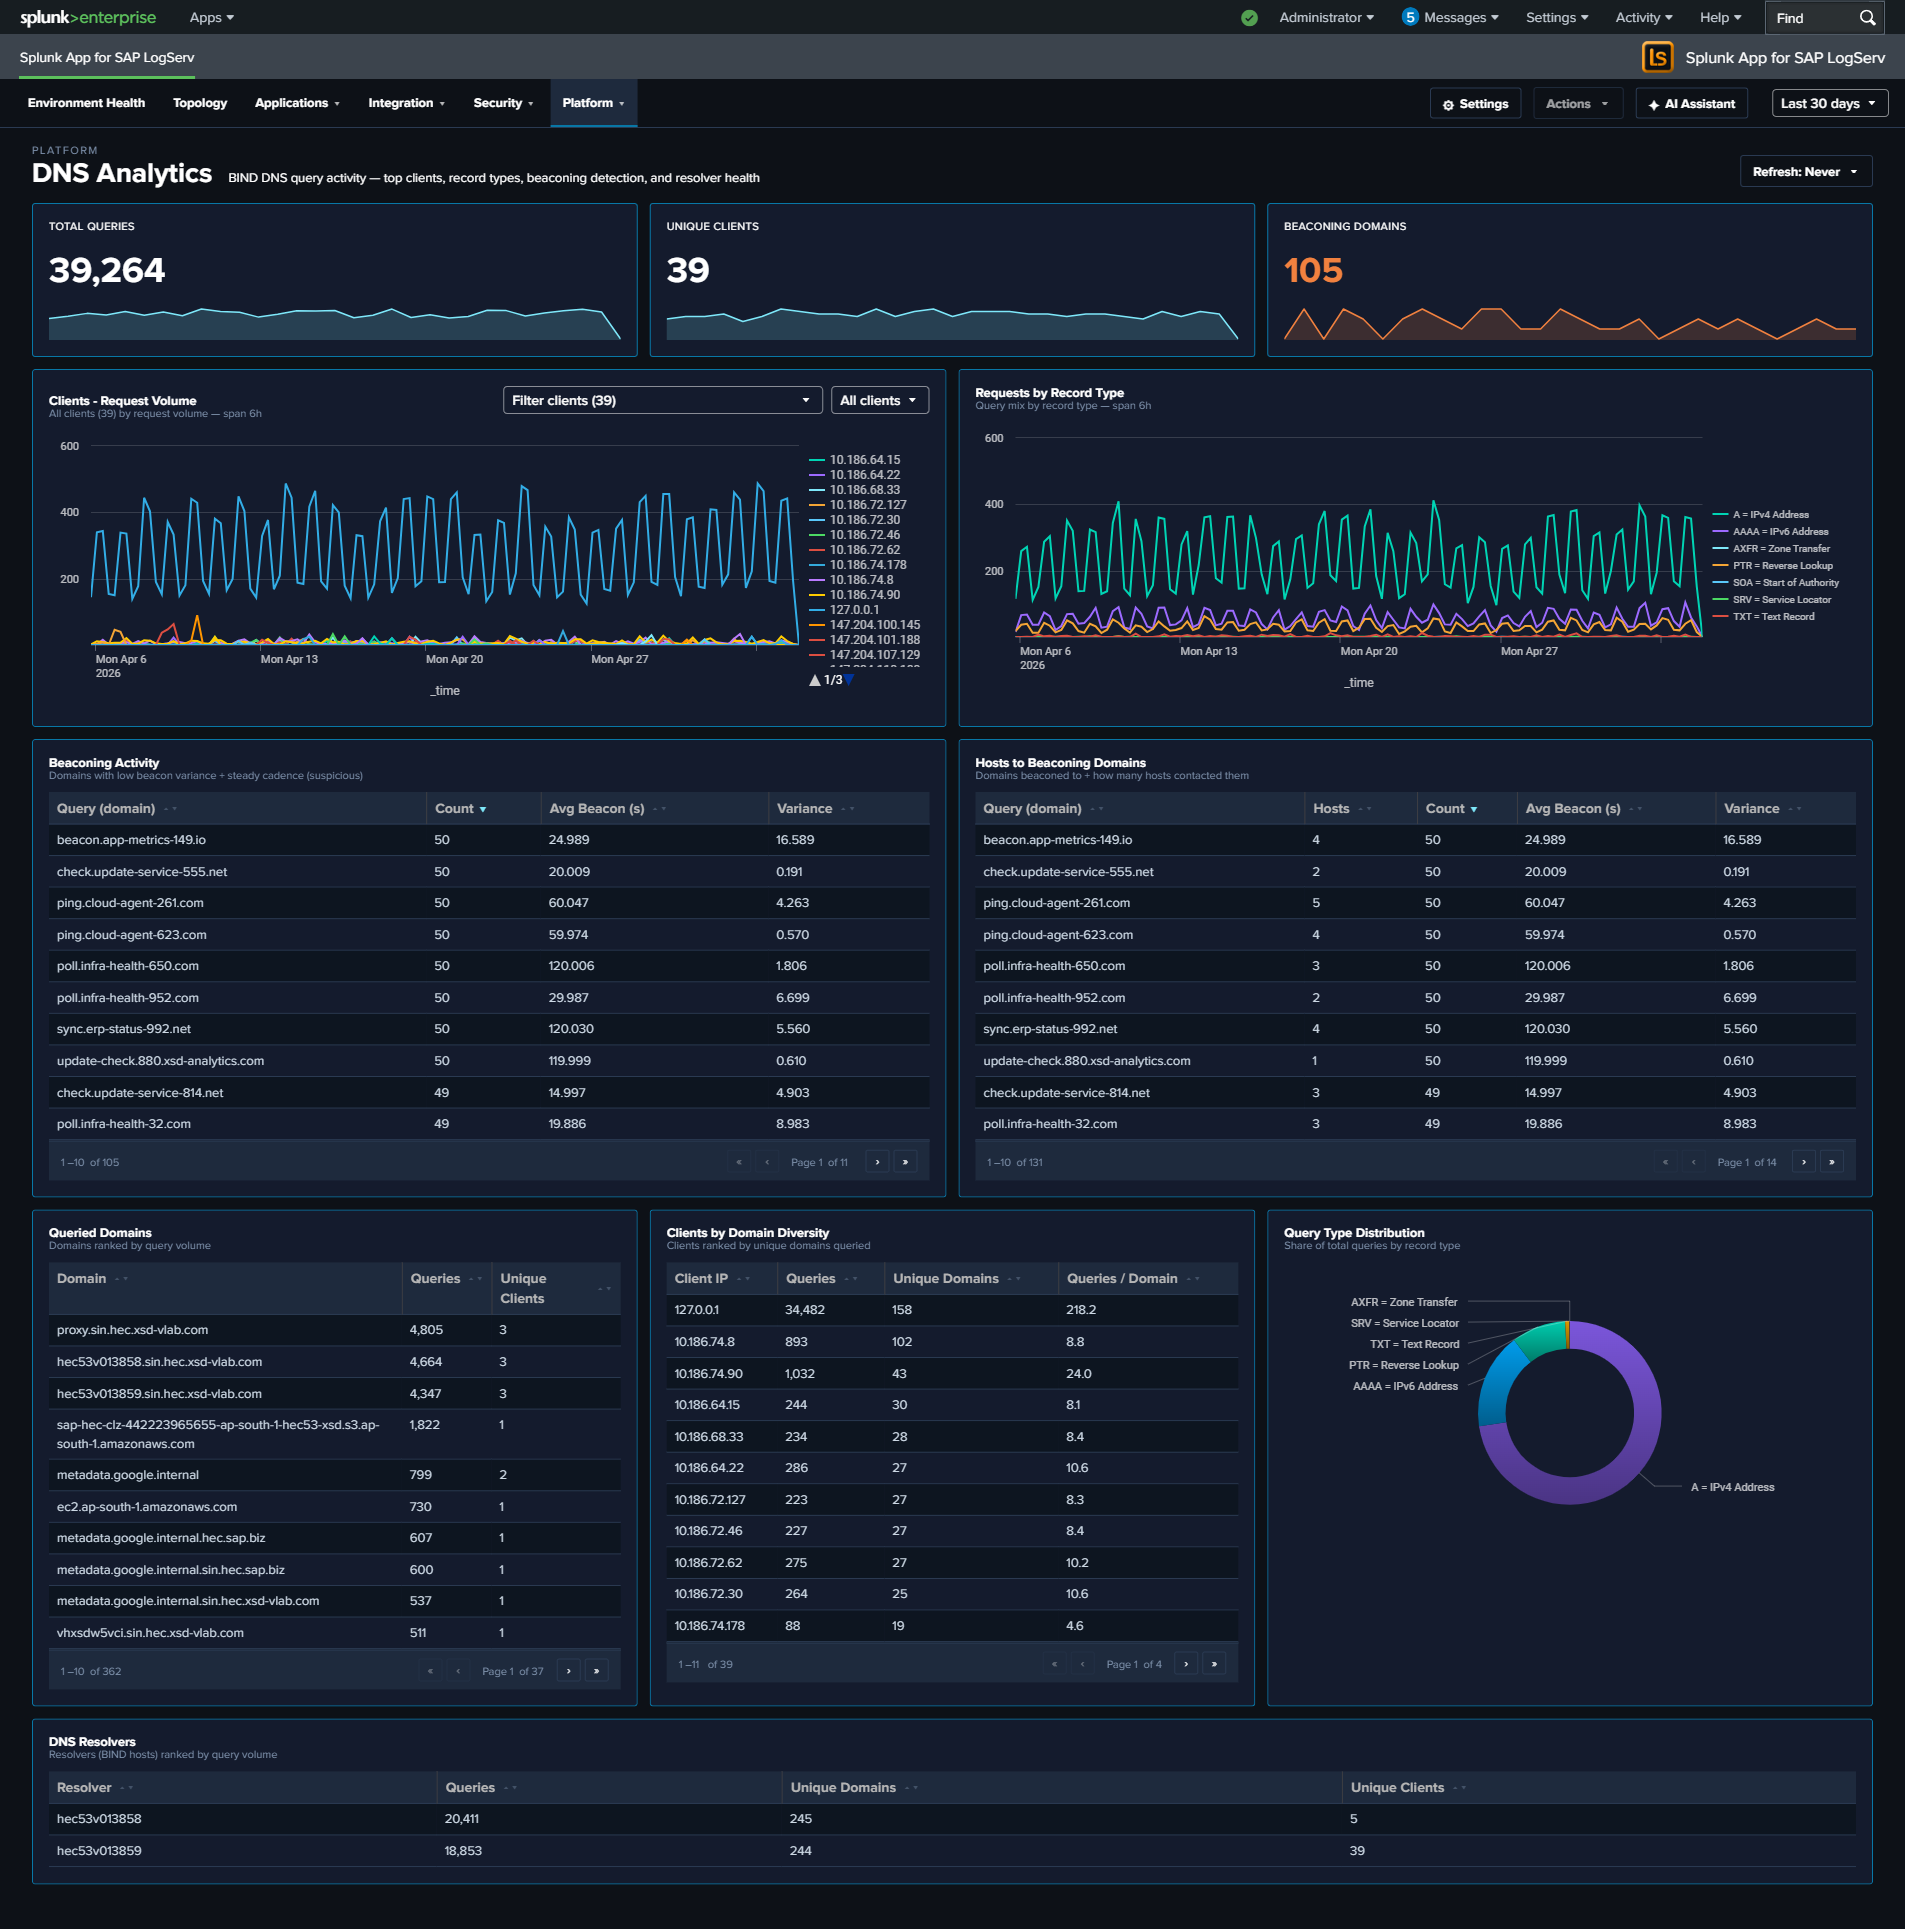
- Total Queries – Aggregate count of DNS queries in the selected time range
- Unique Clients – Count of distinct client IPs generating DNS queries
- Beaconing Domains – Count of domains exhibiting periodic query patterns consistent with C2 beaconing
- Top 10 Clients - Request Volume – Time-series line chart of the most active DNS clients
- Query Type Distribution – Donut chart showing the breakdown of DNS record types (A, AAAA, PTR, TXT, etc.)
- Top DNS Resolvers – Table of the BIND resolvers (the DNS hosts processing queries) ranked by query count; the
hostfield is the authoritative resolver sincesrc/destare always 127.0.0.1 in this environment - Requests by Record Type – Line chart trending DNS query types (A, AAAA, PTR, MX, etc.) over time
- Beaconing Activity – Bubble chart highlighting domains with regular, periodic query patterns that may indicate C2 beaconing
- Hosts to Beaconing Domains – Full-width bubble chart mapping which hosts are communicating with suspected beaconing domains
- Top Queried Domains – Table of the most looked-up domains with unique client counts
- Top Clients by Domain Diversity – Table ranking clients by number of unique domains queried, with queries-per-domain ratio for DGA detection
What to Look For
- Beaconing patterns – The Beaconing Activity panel uses statistical analysis (low variance in query intervals) to detect domains being contacted at regular intervals, which is a hallmark of malware C2 communication. Domains with low variance and high count are the highest priority.
- Unusual record types – TXT record queries at high volume are a common DNS tunneling technique. MX queries from non-mail servers may indicate reconnaissance. Watch the Query Type Distribution donut and the Requests by Record Type line chart for deviations from your normal mix.
- New high-volume clients – A host that suddenly becomes one of the top DNS clients may be compromised and performing domain generation algorithm (DGA) lookups or reconnaissance scanning.
- Multiple hosts reaching beaconing domains – The Hosts to Beaconing Domains panel shows lateral spread. If multiple internal hosts contact the same suspected C2 domain, it suggests widespread compromise.
- High domain diversity – Clients querying many unique domains with a low queries-per-domain ratio in the Top Clients by Domain Diversity table may indicate Domain Generation Algorithm (DGA) activity or automated reconnaissance.
- Resolver imbalance – The Top DNS Resolvers table should show an expected workload split across your BIND servers. One resolver handling disproportionate load may indicate a misconfigured forwarder or a cluster failover that wasn’t noticed.