Linux System & Security
Why This Dashboard Matters
The Linux dashboard provides OS-level visibility for the hosts running SAP applications. Most SAP ABAP and HANA systems run on Linux, making OS-level monitoring essential for understanding the infrastructure beneath the application layer. This dashboard combines SAP-aware context (SID, instance, application identification from syslog) with kernel-level security monitoring (firewall drops and kernel events).
Panels
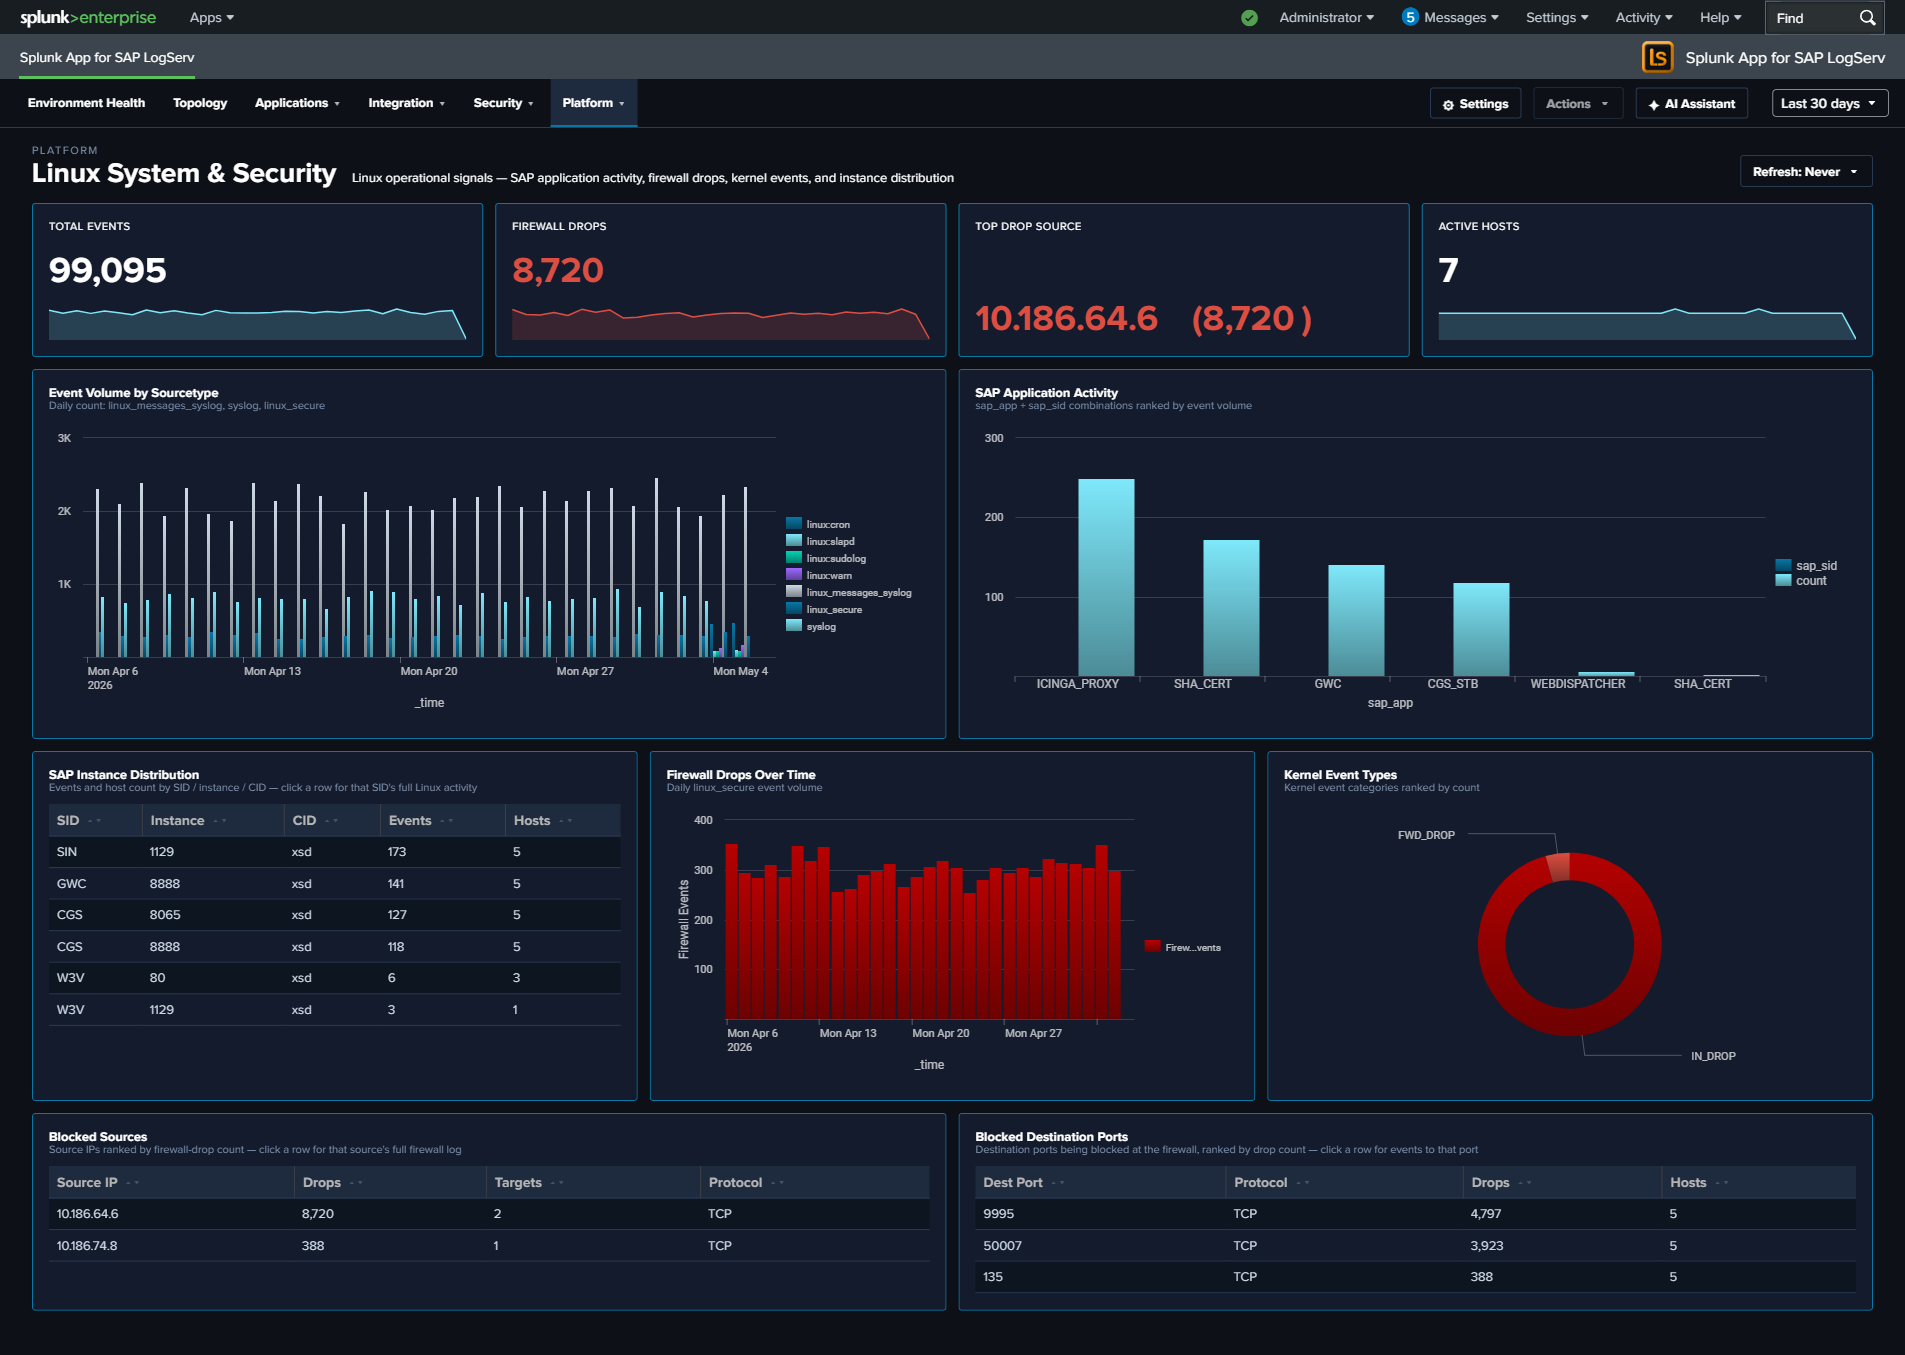
- Total Events – Aggregate event count across all Linux sourcetypes
- Firewall Drops – Count of kernel firewall drop events
- Active Hosts – Count of distinct Linux hosts reporting data
- Top Drop Source – Single-value panel showing the #1 source IP by firewall-drop count in the format
<IP> (<count>), e.g.10.186.64.6 (8,522). This surfaces the dominant drop source directly in the KPI row so it doesn’t get buried in the table. Click the KPI to drill down to all source IPs ranked by drop count. - Event Volume by Sourcetype – Daily trend across
linux_messages_syslogplus the v0.0.5.0 Path-B sourcetypes (linux:cron,linux:warn,linux:sudolog,linux:slapd) andlinux_secure. The legacysyslogsourcetype is OR-ed alongside the new sourcetypes during the transition; existingsourcetype=syslogindexed data ages out per index retention. - SAP Application Activity – Column chart showing event distribution by SAP application and SID
- SAP Instance Distribution – Table of SAP instances with event counts by SID, instance number, and CID
- Firewall Drops Over Time – Timeline of kernel firewall drop events
- Kernel Event Types – Pie chart breakdown of kernel event categories (IN_DROP, segfault, etc.)
- Top Blocked Sources – Table of source IPs being blocked by the firewall with target counts and protocols
- Top Blocked Destination Ports – Table of destination ports targeted by blocked traffic
What to Look For
- Firewall drop spikes – A sudden increase in blocked connections may indicate port scanning, network reconnaissance, or a brute-force attack against SAP services.
- Top Drop Source concentration – If the Top Drop Source KPI shows a single IP accounting for the overwhelming majority of drops, that IP is either a misconfigured internal system hammering a blocked port (check if it’s an internal SAP host that recently changed config) or a persistent external scanner. Click through to see the distribution.
- New blocked source IPs – Unfamiliar source IPs appearing in the Top Blocked Sources table should be investigated, especially if they target SAP service ports (3200-3299 for dialog, 8000-8099 for HTTP, 30015 for HANA).
- SAP application distribution changes – If the SAP Application Activity chart shows a previously active SID or application going silent, it may indicate a process crash or configuration issue.
- Kernel segfaults – Segmentation faults appearing in the Kernel Event Types panel indicate application crashes, which may affect SAP system stability.
- Port targeting patterns – The Top Blocked Destination Ports table reveals which services attackers are targeting. Ports associated with SAP services warrant immediate attention.