Network Perimeter
Why This Dashboard Matters
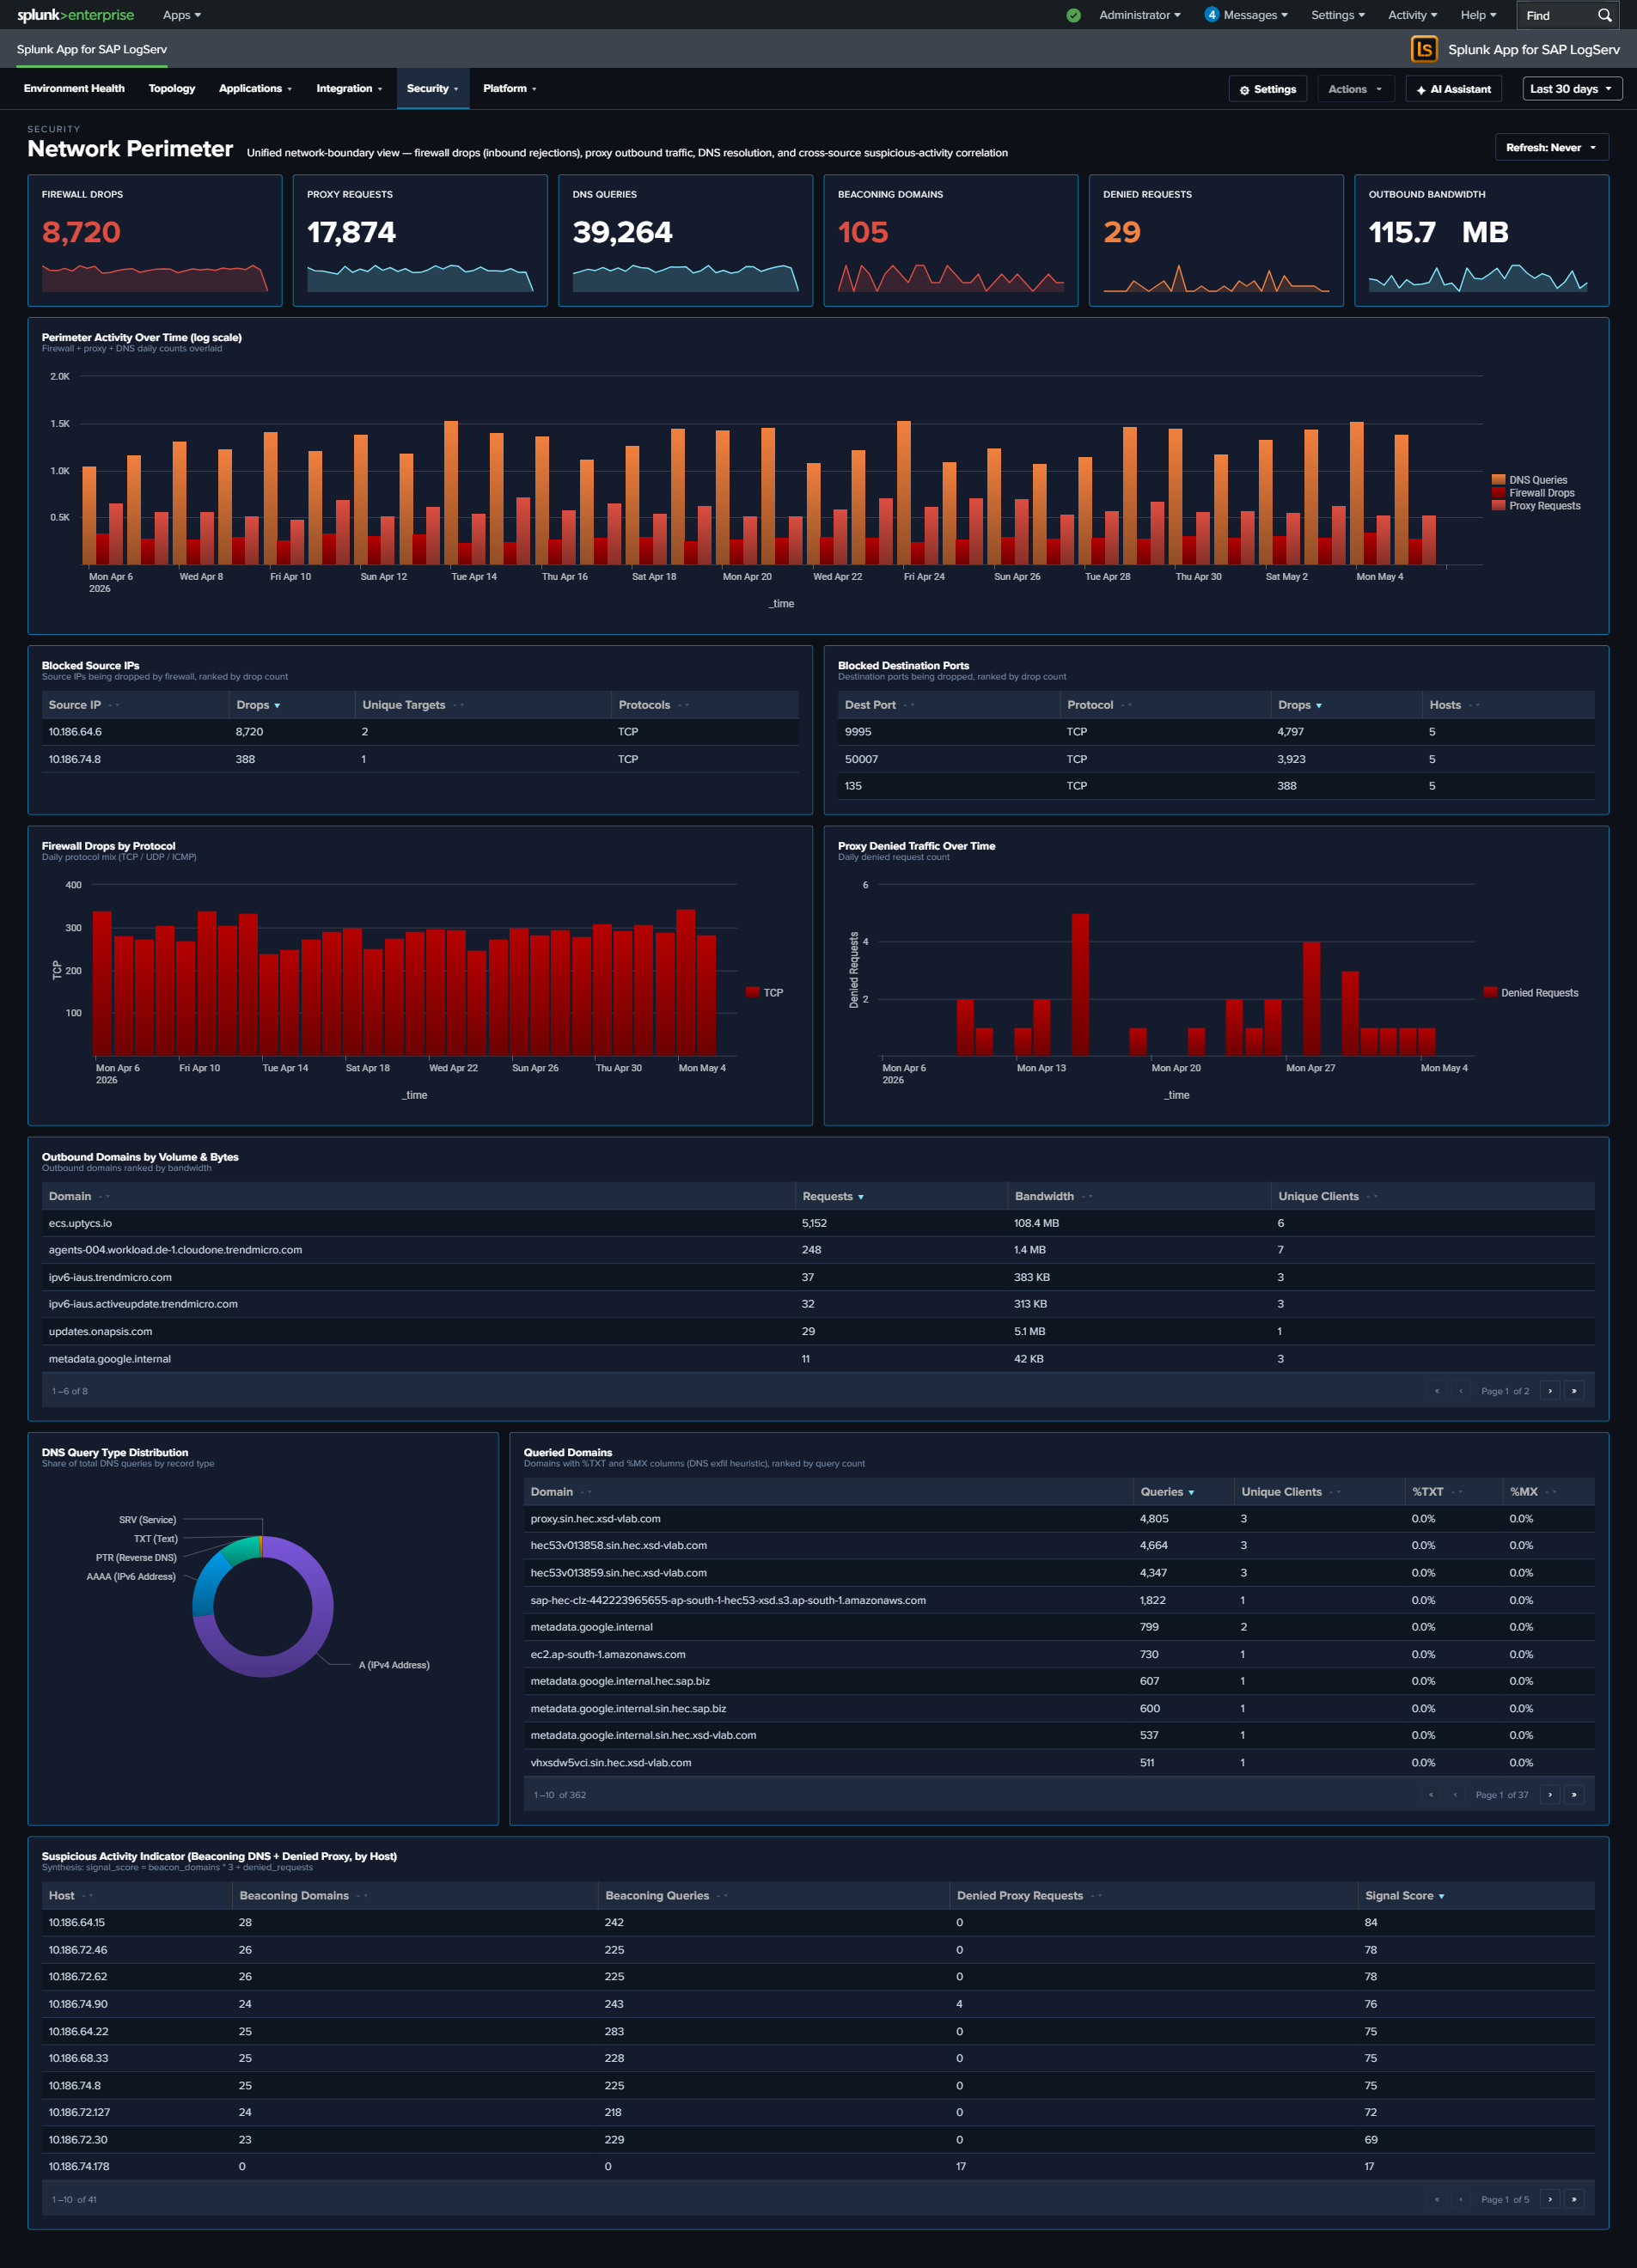
Firewall drops, proxy traffic, and DNS queries are three different lenses on the same underlying question: what is crossing the network boundary and should it be there? Each lens lives on its own operational dashboard (Linux, Proxy Analytics, DNS Analytics), but an attacker rarely limits themselves to a single surface – a compromised host often shows up in multiple signals simultaneously, and that correlation is where the security value lives. Network Perimeter synthesizes the three sources into a single view: inbound rejections (firewall), outbound flow (proxy), and resolution activity (DNS), with a dedicated cross-source panel that ranks hosts by combined suspicious-signal score. Use it as the first stop for “is our network perimeter healthy and clean?”
Panels
- Firewall Drops – Count of kernel firewall
IN_DROPevents fromlinux_secure - Proxy Requests – Count of HTTP requests handled by Squid
- DNS Queries – Count of DNS queries from
isc:bind:query - Beaconing Domains (red) – Domains exhibiting periodic query patterns (low variance in inter-query interval) – candidate C2 channels
- Denied Requests (red) – Count of proxy requests with
status=403orvendor_action="TCP_DENIED"; click to drill down - Outbound Bandwidth –
sum(bytes_out)across all proxy requests, formatted KB/MB/GB - Perimeter Activity Over Time – Full-width multi-line chart (log-scale y-axis) showing daily counts of all three sources on a single timeline. Log scale keeps Firewall Drops and Proxy Requests visible alongside the much larger DNS Queries volume; simultaneous spikes across two or three lines are the correlation signal to watch for.
- Top Blocked Source IPs – Table of the 20 source IPs most rejected by the firewall, with unique target count and protocols seen; row drilldown to the matching events
- Top Blocked Destination Ports – Table of the 20 destination ports most targeted by rejected traffic, grouped by port + protocol
- Firewall Drops by Protocol – Stacked column showing daily IN_DROP events split by TCP / UDP / ICMP. Protocol shifts are often the clearest signal (ICMP spikes = ping flood / recon; UDP spikes = DNS amplification / port scan; TCP spikes = SYN-style port scan)
- Proxy Denied Traffic Over Time – Area chart of daily denied proxy requests – the outbound complement to firewall drops (inbound)
- Top Outbound Domains by Volume & Bytes – Table of the 20 destination domains receiving the most outbound traffic, ranked by bytes, with request count and unique client count. Row drilldown opens the events for that domain.
- DNS Query Type Distribution – Donut of query-type mix (A / AAAA / PTR / TXT / MX / other). High TXT or MX volume from non-mail hosts is a DNS-tunneling / exfiltration indicator.
- Top Queried Domains – Full-width table of the 30 most queried domains with unique-client count and per-domain
%TXTand%MXratios for quick anomaly spotting. Row drilldown opens DNS query events for that domain. - Suspicious Activity Indicator – Full-width cross-source table of internal hosts appearing in both beaconing DNS queries and denied proxy requests, ranked by signal score (
beacon_domains × 3 + denied_requests). Columns: Host, Beaconing Domains, Beaconing Queries, Denied Proxy Requests, Signal Score. Row drilldown opens both DNS and proxy events for that host.
What to Look For
- Correlated spikes across sources – The Perimeter Activity Over Time chart is the quickest read on “is something happening right now?” Watch for days when two or three of the lines spike together – that’s usually an active event (port scan, active C2, exfiltration window) rather than baseline drift.
- Protocol shifts in firewall drops – The stacked column by protocol is more diagnostic than raw drop counts. A normally TCP-heavy mix suddenly showing large UDP or ICMP bands signals a different attacker technique.
- Top Blocked Source IPs concentration – A single source IP generating the overwhelming majority of drops is either a persistent attacker or a misconfigured internal host. Either way, the action is the same: investigate that specific IP.
- TXT-heavy queries to a single domain – A domain in Top Queried Domains with a high
%TXTratio is a DNS-tunneling pattern. Cross-reference the Suspicious Activity Indicator to see which hosts are issuing those queries. - Hosts in the Suspicious Activity table – Any non-empty row here is worth investigating. A host showing up in both beaconing DNS and denied proxy is strong evidence of compromise – the DNS lookups suggest malware C2, and the denied proxy requests suggest the same malware trying to reach blocked destinations.
- Outbound Bandwidth spikes – A sudden rise in the Outbound Bandwidth KPI that isn’t matched by a proportional rise in Proxy Requests means individual transfers are getting larger – often the signature of an exfiltration event.