Cloud Connector
Why This Dashboard Matters
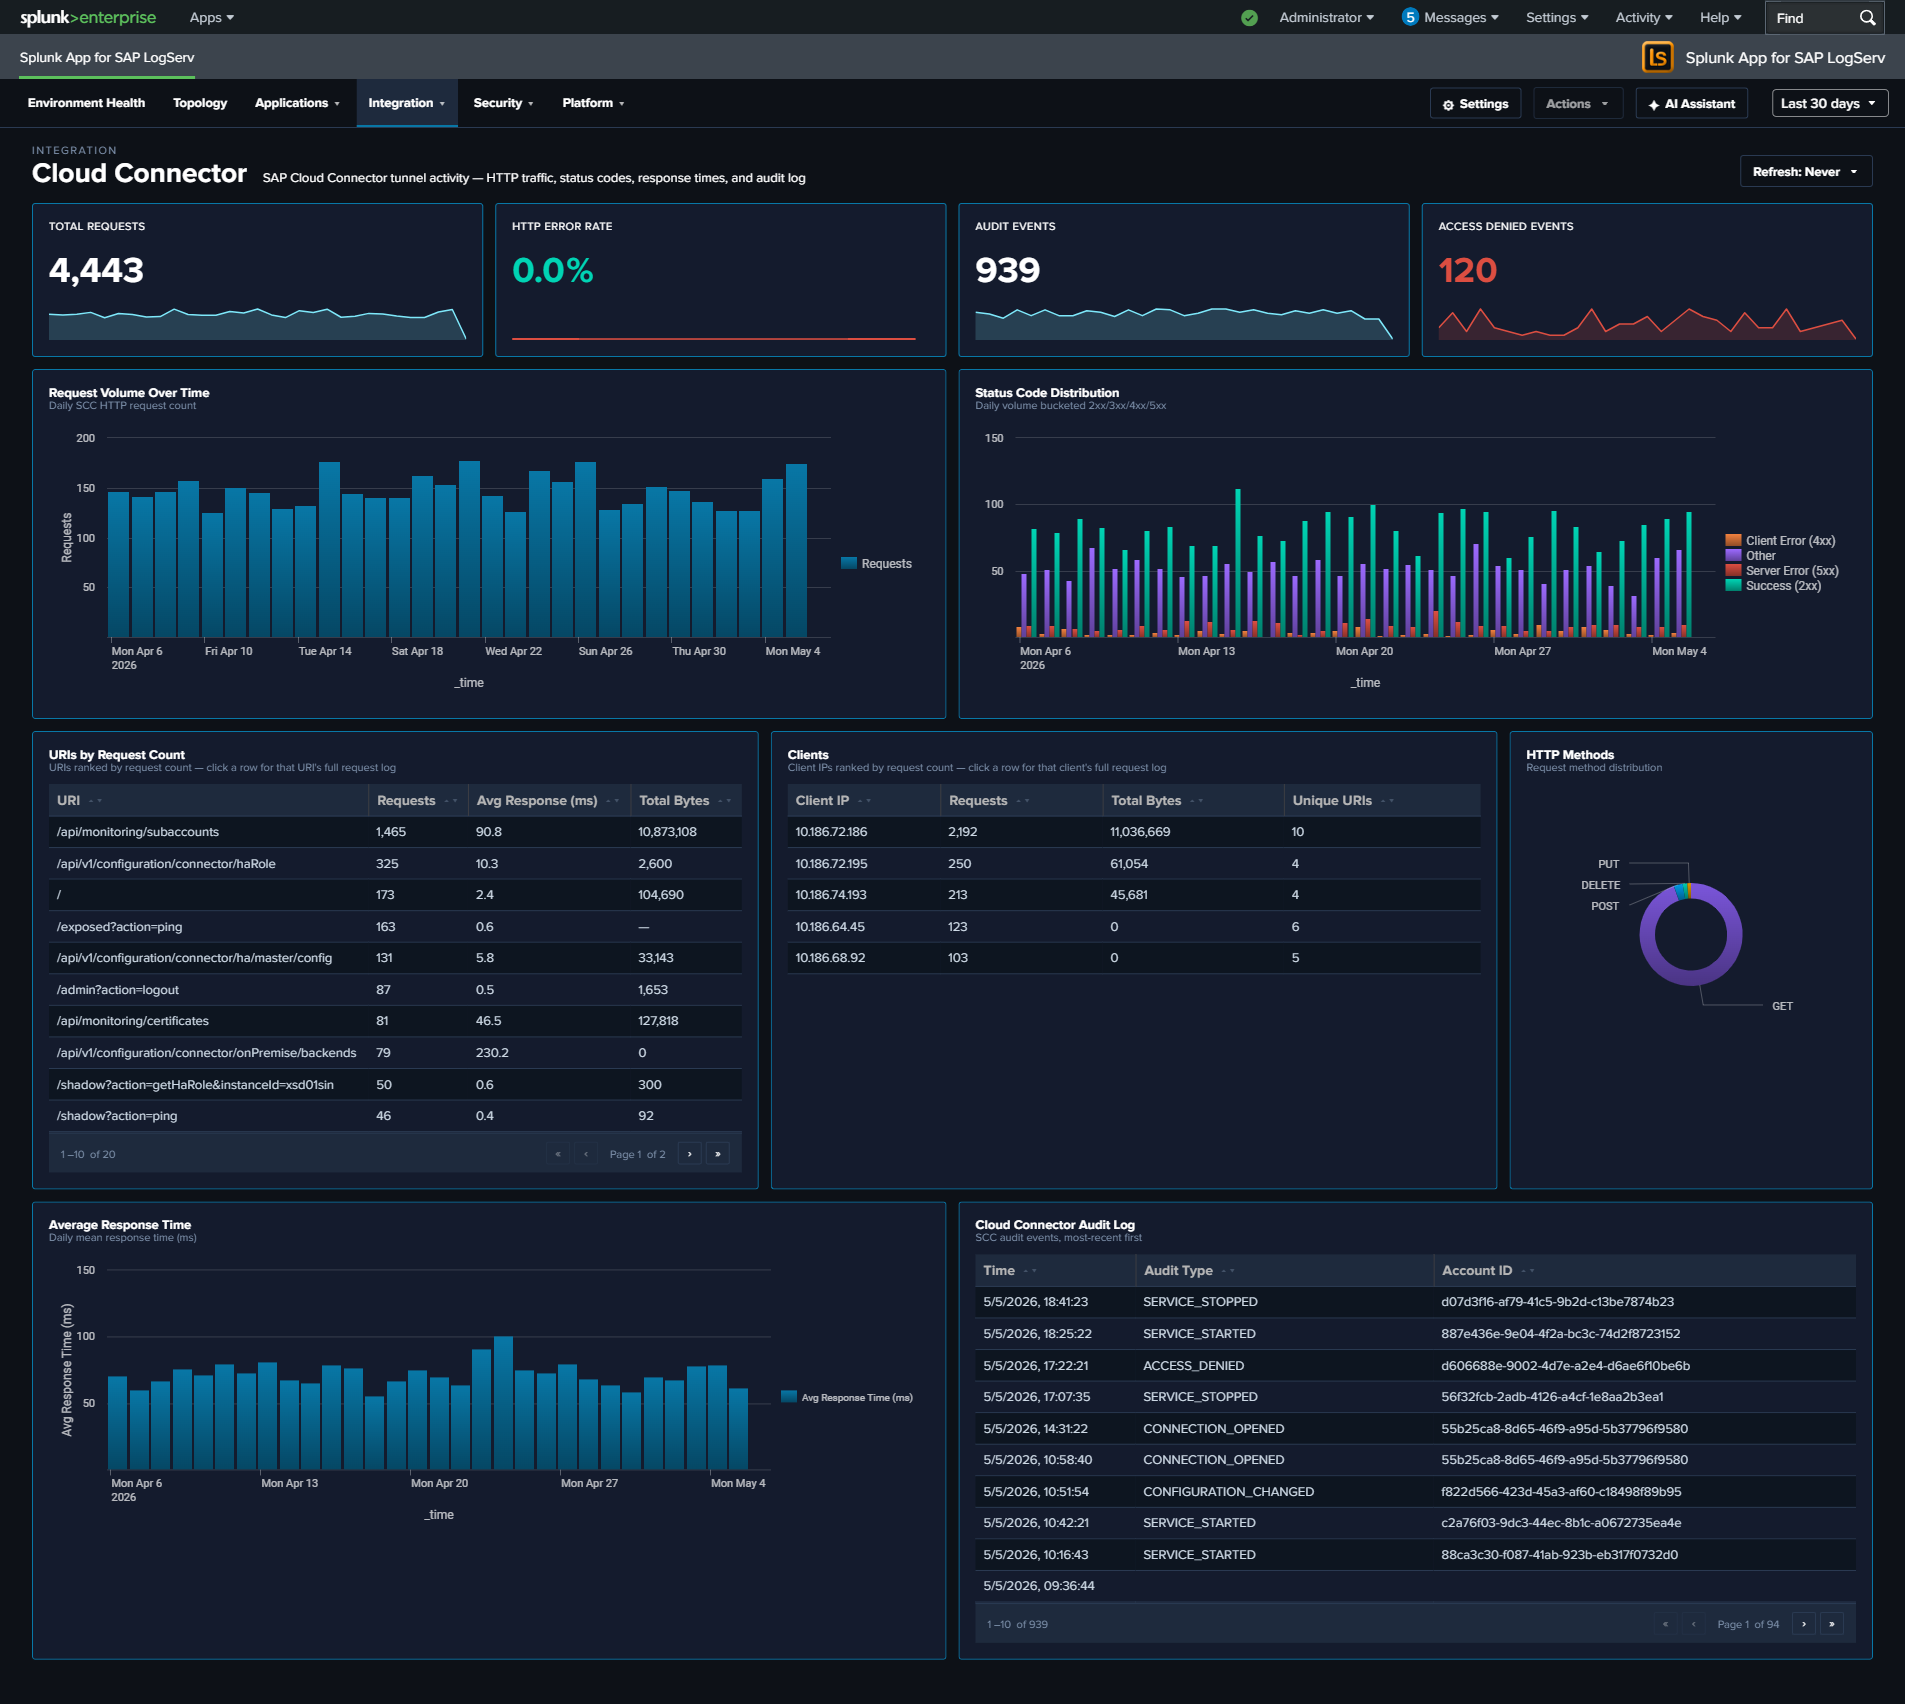
The Cloud Connector dashboard monitors SAP Cloud Connector (SCC), which provides secure tunneled connectivity between on-premise SAP systems and SAP BTP (Business Technology Platform) cloud services. As the bridge between on-premise and cloud, the Cloud Connector’s health directly impacts hybrid integration scenarios, Fiori apps, and cloud-based analytics that depend on on-premise data access.
Panels
- Total Requests – Count of HTTP requests processed by the Cloud Connector
- HTTP Error Rate – Percentage of HTTP requests returning 4xx or 5xx status codes (scoped name clarifies that this is HTTP-only, not audit-log errors)
- Audit Events – Count of Cloud Connector audit log entries
- Access Denied Events – Count of
sap:scc:auditentries withscc_audit_type="ACCESS_DENIED"(click to drill down to the matching events) - Request Volume Over Time – Daily HTTP request trend
- Status Code Distribution – Stacked column chart of 2xx, 3xx, 4xx, and 5xx responses
- Top URIs by Request Count – Table of the most requested URIs with average response time and total bytes
- Average Response Time – Line chart trending response time over time
- HTTP Methods – Pie chart breakdown of request methods
- Top Clients – Table of the most active client IPs with request counts and unique URI counts
- Cloud Connector Audit Log – Table of recent audit events with type and account details
What to Look For
- HTTP Error Rate increases – A rising error rate indicates connectivity issues between on-premise systems and the cloud. Check the Status Code Distribution for whether errors are client-side (4xx) or server-side (5xx).
- Access Denied events – A non-zero Access Denied KPI means the BTP side actively rejected a request – either a misconfigured subaccount binding, an expired certificate, or an unauthorized access attempt. Click the KPI to see which accounts/URIs are being denied.
- Response time degradation – Gradually increasing response times suggest bandwidth constraints, backend system slowdowns, or Cloud Connector resource exhaustion. Sudden spikes may indicate outages.
- Unusual URIs – Requests to unexpected URI paths in the Top URIs table may indicate scanning or misconfigured cloud applications attempting to access unauthorized resources.
- Audit events indicating config changes – Cloud Connector audit entries for configuration modifications should correlate with approved change windows. Unexpected changes may indicate unauthorized access.
- New client IPs – The Cloud Connector should only receive traffic from expected BTP subaccounts. New client IPs may indicate unauthorized access attempts or misconfigured routing.